10 Underrated Python Skills
Tips for feature analysis, hyperparameter tuning, data visualization and more.

In a 2012 article, “The Sexiest Job of the 21st Century,” Harvard Business Review portrayed a vision of data science teams effortlessly creating actionable information from data.
While it’s not quite Baywatch, data science is a dynamic field with great potential to produce valuable insights from an organization’s top strategic asset — the competitive advantage offered by a great data infrastructure.
To help with your data science work, here are ten undervalued Python skills. Mastering these capabilities will — dare I say it — make you an even sexier data scientist. Our team balances beauty and brains, all while pushing the limits, saving people in danger, and doing heroic acts. So let’s get started.
#10 — Setting up a virtual environment
A virtual environment sets up an isolated workspace for your Python project. Whether you’re working solo or with collaborators, having a virtual environment is helpful for the following reasons:
- Avoiding package conflicts
- Providing clear line of sight on where packages are being installed
- Ensuring consistency in package version utilized by the project
The use of a virtual environment allows you (and your teammates) to have different dependencies for different projects. Within the virtual environment, you can test install packages without polluting the system install.

Deploying the venv module is seriously helpful for avoiding issues down the line, so don’t skip this step when getting started with your project.
Read more: save space — and avoid installing the same version of multiple packages in different places — by setting up a virtual environment that contains the most commonly used packages for scientific computing. Then share that common environment as a .pth file across project-specific environments.
#9 — Commenting according to PEP8 standards
Write good comments for improved confidence and collaborative abilities. In Python, that means following the PEP8 style guide.
Comments should be declarative, like:
# Fix issue with utf-8 parsingNOT # fixes issue
Here’s an example with a docstring, a special type of comment that is used to explain the purpose of a function:
def persuasion():
   """Attempt to get point across."""
   print('Following this advice about writing proper Python comments will make you popular at parties')
Docstrings are particularly useful because your IDE will recognize this string literal as the definition associated with a class. In Jupyter Notebook, you can view a function’s docstring by putting your cursor at the end of the function and simultaneously hitting Shift and Tab.
#8 — Finding good utility code
You’ve heard the expression “standing on the shoulders of giants.” Python is an exceedingly well-resourced language. You can speed up your data science discoveries by recognizing you don’t have to go it alone — you can and should reuse the utility code of the programmers who’ve come before you.
One great source for utility code is the blog of Chris Albon, creator of the Machine Learning flashcards that decorate the walls of my home office / bedroom. The landing page of his site offers navigation to hundreds of code snippets to accelerate your workflow in Python.
For instance, Chris shows us how to apply a function (such a pandas’ rolling mean — .rolling()) to a dataframe, by group:
df.groupby('lifeguard_team')['lives_saved'].apply(lambda x:x.rolling(center=False,window=2).mean())This code outputs a dataframe that contains a rolling average of every two rows, restarting for each group in the first part of the .groupby() statement.
#7 — Using pandas-profiling for automated EDA
Use the panda-profiling toolkit to automate much of your exploratory data analysis. EDA is the crucial phase zero of any data science project. It typically involves basic statistical analytics and looking at how features correlate with each other.

This article walks you through a standard ‘manual’ data exploration approach and compares it to the automatic report created by the pandas-profiling library:
A better EDA with Pandas-profiling
Exploratory Data Analysis is Dead, Long Live to Pandas-profiling! A Perfect Overview of your Data with Fewer Efforts.
#6 — Improving target analysis with qcut
In this excellent video about improving your machine learning workflow, Rebecca Bilbro offers the sage advice to check out your target column before doing feature analysis.
Begin with the end in mind — this way you set up a solid understanding of the target variable before jumping into your effort to predict or classify it. Taking this approach helps you identify potentially thorny problems (e.g. class imbalance) up front.
If you’re dealing with a continuous variable, it may be useful to bin your values. Working with 5 bins offers the opportunity to leverage the pareto principle. To create quintiles, simply use panda’s q-cut function:
amount_quintiles = pd.qcut(df.amount, q=5)Each bin will contain 20% of your dataset. Comparing the top quintile of your target variable against the bottom quintile often yields interesting results. This technique serves as a good starting point to determining what might be anomalous about the top (or bottom) performers within your target variable.
For further learning, also check out Rebecca’s appearance on Women Who Code DC’s Career Series, interviewed by yours truly:
#5 — Adding visualizations to feature analysis
Visualizations aren’t just for business intelligence dashboards. Throwing in some helpful charts and graphs will reduce speed to insight as you investigate a new dataset.
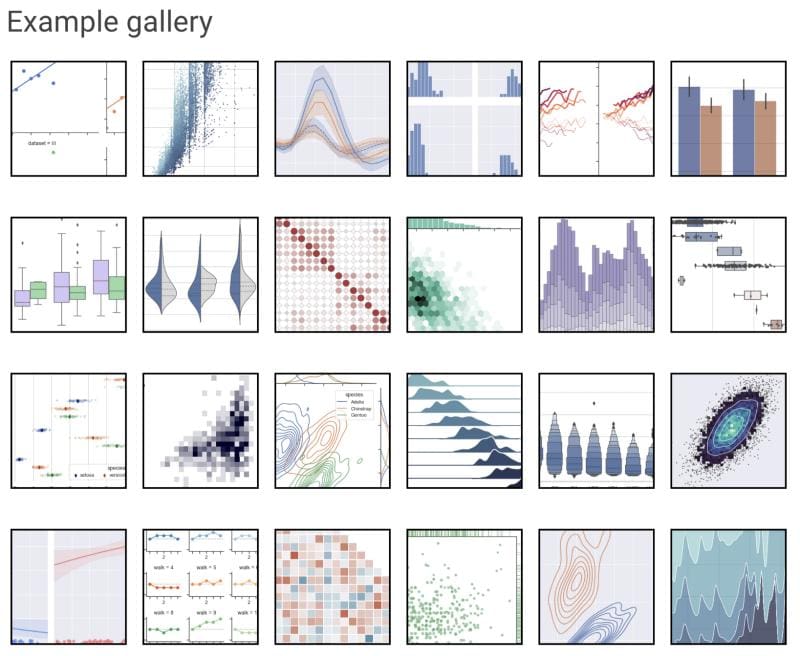
There are many possible approaches to using data viz to advance your analytical capabilities. Some resources to explore:
- Seaborn example gallery
- Bokeh notebook examples
- Yellowbrick gallery
- Streamlet for data exploration (thanks Ian Xiao for this tip!)
- Tableau getting started guide
#4 — Measuring and optimizing runtime
Data scientists have somewhat of a reputation for being tinkerers. But as the field is increasingly drawing nearer to software engineering, the demand for concise, highly performant code has increased. The performance of a program should be assessed in terms of time, space, and disk use — keys to scalable performance.
Python offers some profiling utilities to showcase where your code is spending time. To support the monitoring of a function’s runtime, Python offers the timeit function.
%%timeitfor i in range(100000):
    i = i**3
Some quick wins when it comes to improving your code while working with pandas:
- Use pandas the way it’s meant to be used: do not loop through dataframe rows — use the apply method instead
- Leverage NumPy arrays for more even efficient coding
#3— Simplifying time series analysis
Working with time series can be daunting. My bootcamp instructor showed up to class with a haunted look on the day he prepared to lecture on this topic.
Fortunately, the dtw-python package provides an intuitive way to compare time series. In short, Dynamic Time Warping calculates the distance between two arrays or time series of different length.
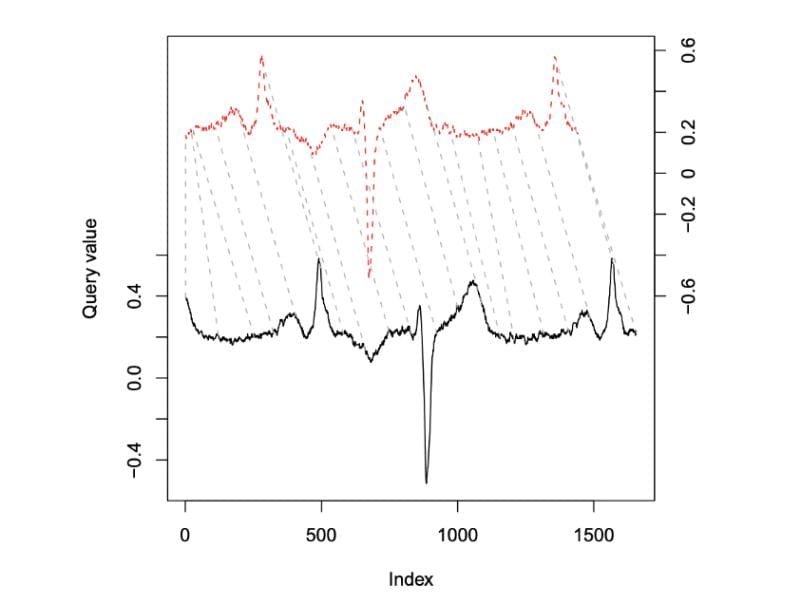
First, DTW stretches and/or compresses series of potentially different lengths to make them resemble each other as much as possible. To borrow an example from speech recognition, employing this technique would help an algorithm recognize that “now” and “nowwwwwwww” are the same word, whether spoken by a snappily impatient adult or a tempestuous toddler. After the transform, the package computes the distance between individual aligned elements.
Learn more:
- Download the paper here (originally implemented in R, but still relevant to Python)
- Read up on use cases here
- Play around with DTW Python yourself using Google Colab here & here.
#2 — Setting up ML Flow for experiment tracking
ML Flow enables the tracking of parameters, code versions, metrics, and output files. The MlflowClient function creates and manages experiments, pipeline runs, and model versions. Log artifacts (e.g. datasets), metrics, and hyperparameters with mlflow.log_artifact, .log_metric() and .log_param().
You can easily view all metadata and results across experiments in a local host browser with the mlflow uicommand.
Also, check out this complete guide to the data science workflow:
Comprehensive Guide to Model Selection
A systematic approach to picking the right algorithm.
#1 — Understanding the __main__ function
Using if __name__ == '__main__' provides the flexibility to write code that can be executed from the command line or imported as a package into an interactive environment. This conditional statement controls how the program will execute given the context.
You should expect that a user running your code as an executable has different goals than a user importing your code as a package. The if __name__ == ‘__main__' statement provides control flow based on the environment in which your code is being executed.
__name__is a special variable in the module’s global namespace- It has a
repr()method that is set by Python - The value of
repr(__name__)depends on the execution context - From the command line,
repr(__name__)evaluates to ‘__main__’ — therefore any code in the if block will run - Imported as a package,
repr(__name__)evaluates to the name of the import — therefore code in the if block will not run
Why is this helpful? Well, someone running your code from the command line will have the intention of executing functions right away. This may not be true of someone importing your package as utility code into a Jupyter Notebook.
In if __name__ == ‘__main__' you should create a function called main() that contains the code you want to run. Across programming languages, the main function provides an entry point for execution. In Python, we name this function main() only by convention — unlike lower level languages, Python does not ascribe any special significance to the main function. By using the standard terminology however, we let other programmers know that this function represents the starting point of the code that accomplishes the primary task of the script.
Rather than including blocks of task-accomplishing code within main(), the main function should call other functions stored within the module. Effective modularization allows the user to reuse aspects of the code as they wish.
The extent to which you modularize is up to you — more functions means more flexibility and easier reuse, but may make your package more difficult for a human to read and interpret as they traverse logical breaks between functions.
Bonus: knowing when not to use Python
As a full-time Python programmer, sometimes I wonder if I’m overly dependent on this tool for scientific computing. Python is a delightful language. It’s straightforward and low maintenance, and its dynamic structure is well suited to the exploratory nature of data science pursuits.
Still, Python is definitely not the best tool to approach every aspect of the broadly defined machine learning workflow. For example:
- SQL is essential for ETL processes that move data into a data warehouse where it’s queryable by data analysts and data scientists
- Java could be helpful for building out pipeline components like data ingest and cleaning tools (e.g. using Apache PDFBox to parse text from a PDF document)
- Julia is taking off as a blazing fast alternative to Python for data science
- Scala is often used for big data and model serving
In this panel discussion hosted by The TWIML AI Podcast, experts explore the data science applications of their chosen programming language.
It’s somewhat bizarre to hear a JavaScript dev talk about the potential to use this typically web-development-centric language for machine learning. But hey, it’s gutsy and creative — and it has the potential to democratize data science by breaking down the barriers between machine learning and traditional software development.
For now, JavaScript has a numbers advantage: 68% of developers use JavaScript, compared to 44% who use Python, according to the 2020 Stack Overflow Developer Survey. Only 1% use Julia, but that’s predicted to change rapidly. Could more ML developers means more competition, more insights, even more arXiv papers? All the more reason to sharpen your Python skills.
Summary
In this article, we covered 10 potentially overlooked Python skills for data scientists. These tips included:
- Creating virtual environments for your projects (#10)
- Commenting according to the Python style guide (#9)
- Finding utility code instead of reinventing the wheel (#8)
- Improving your EDA, target analysis, and feature analysis (#7, 6, 5)
- Writing more performant code based on runtime optimization (#4)
- Using dynamic time warping for time series analysis (#3)
- Tracking experimentation with ML Flow (#2)
- Incorporating a main function to add flexibility to packages (#1)
I hope this write up has given you something new to learn as you advance your data science practice.
If you enjoyed this article, follow me on Medium, LinkedIn, YouTube, and Twitter for more ideas to improve your data science skills. Sign up to get notified when “Resources to Supercharge your Data Science in the Last Months of 2020” comes out.
Disclaimer: any hyperlinks to books in this article are affiliate links. Thanks in advance for your support of my Medium writing.
What Pythons skills do you think are underrated? Let me know in the comments.
Projects to advance your Python skills
Named Entity Recognition for Clinical Text
Use pandas to reformat the 2011 i2b2 dataset into CoNLL format for natural language processing (NLP).
12-Hour ML Challenge
How to build & deploy an ML app with Streamlit and DevOps tools
Walkthrough: Mapping GIS Data in Python
Improve your understanding of geospatial information through GeoPandas DataFrames and Google Colab
Getting Started with Spotify’s API & Spotipy
A data scientist’s quick start guide to navigating Spotify’s Web API and accessing data using the Spotipy Python…
Bio: Nicole Janeway Bills is Data Scientist with experience in commercial and federal consulting. She helps organizations leverage their top asset: a simple and robust Data Strategy. Sign up for more of her writing.
Original. Reposted with permission.
Related:
- fastcore: An Underrated Python Library
- Data Science Minimum: 10 Essential Skills You Need to Know to Start Doing Data Science
- How I Levelled Up My Data Science Skills In 8 Months