 How to Find Weaknesses in your Machine Learning Models
 How to Find Weaknesses in your Machine Learning Models
FreaAI: a new method from researchers at IBM.
By Michael Berk, Data Scientist at Tubi
Any time you simplify data using a summary statistic, you lose information. Model accuracy is no different. When simplifying your model’s fit to a summary statistic, you lose the ability to determine where your performance is lowest/highest and why.
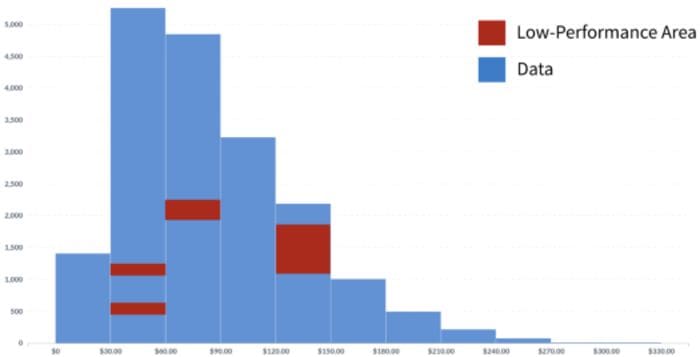
Figure 1: example of areas of the data where model performance is low. Image by author.
To combat this problem, researchers at IBM recently developed a method called FreaAI that identifies interpretable data slices where a given model has poor accuracy. From these slices, the engineer can then take the necessary steps to ensure the model will perform as intended.
FreaAI is unfortunately not open source, but many of the concepts can be easily implemented in your favorite tech stack. Let’s dive in…
Technical TLDR
FreaAI finds slices in testing data with statistically significant low performance. They are returned to the engineer for examination. The method steps are the following:
- Use Highest Prior Density (HPD) methods to find univariate data slices with low accuracy. These univariate data slices reduce the search space and show where our data are more likely to be problematic.
- Use decisions trees to find bivariate data slices with low accuracy. These bivariate data slices reduce the search space for categorical predictors and 2nd-order interactions to show where our data are more likely to be problematic.
- Remove all data slices that don’t meet certain heuristics. The main two are minimal support of the testing set and statistically significant increase in error.
But, what’s actually going on?
That was a lot of jargon, so let’s slow down a bit a really understand what’s going on…
1. The Problem
When developing a model, we often use “accuracy” measures to determine fit. One example is Mean Squared Error, which is used in linear regression and defined in figure 2.
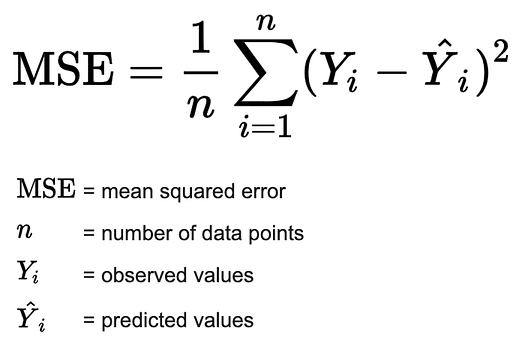
Figure 2: Mean Squared Error formula. Image by author — src.
But this averaged error only tells us how well were doing on average. We don’t know if we’re performing really well on certain areas of our data or really poorly on other areas.
This is a long-standing problem in predictive modeling that has recently gotten lots of attention.
2. The Solution
One solution is FreaAI. The method was developed at IBM and looks to determine where in our data our model underperforms.
There are two main steps. The first involves creating data slices and the second involves determining if the model underperforms in those data slices. The output of FreaAI is a set of “locations” in our data where model performance is low.
2.1. Data Slicing
Combinatorial Testing (CT) is a framework that sequentially looks at all groups of predictors to find areas of poor performance. For example, if we have two categorical predictors, color and shape, we’d look at all possible combinations and see where accuracy drops.
However, leveraging combinatorial testing on large datasets is computationally impossible — with each new column we see an exponential increase in the number of combinations required. So, we need to define a method that helps us search through features to find potential areas of inaccuracy.
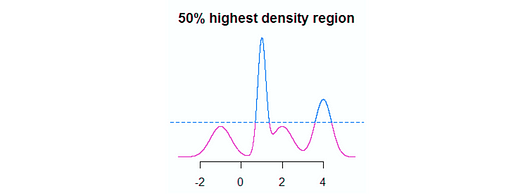
Figure 3: example of a 50% highest density region (HDR) in blue. Image by author — src.
The first method leveraged in FreaAI uses something called Highest Density Regions (HDR) (figure 3). In short, HDR finds the smallest area of a numeric feature where a certain proportion of the data can be found i.e. high-density areas. In figure 3, the area is differentiated by the horizontal blue dotted line — 50% of our data are above that line.
From there we iteratively decrease this range by a value of ε (default to 0.05) and look for increases in accuracy. If the accuracy does increase on a given iteration, we know that the model did not perform well in the area between the prior iteration and current iteration.
To determine areas of poor fit on with numeric predictors, we iteratively run this HDR method for all predictors in our testing set.
Pretty cool, right?
The second method leverages decision trees to handle all non-numeric predictors as well as combinations of two features. In short, we fit a decision tree and look to find what splits of those features minimized accuracy.

Figure 4: example of a decision tree on a continues univariate predictor “age”. Image by author.
In figure 4, each decision node (blue) is a split on our feature(s) and each end node (number) is the accuracy for that split. By fitting these trees, we can really reduce the search space and more quickly find areas of poor performance. Furthermore, because trees are so robust for many different kinds of data, we can run this on categorical predictors or more than one predictors to capture interaction effects.
This is decision tree approach is repeated for all combinations of features, as well as single features that were not numeric.
2.2. Heuristics for Data Slicing
Now up to here, we’ve only concerned ourselves with developing data slices using accuracy, but there are other heuristics that help us find useful data slices:
- Statistically Significant: to ensure that we’re only looking at data slices that have meaningful drops in accuracy, we only only keep slices with performance 4% lower than bottom bound of our error’s confidence interval. By doing so, we can state with probability α that our data slices have higher error.
- Explainable: we also want to ensure that the problematic areas found can be acted upon, so we only look at two or three features when creating combinations. By limiting to low-order interactions, there’s a higher chance that our engineers can develop solutions.
- Minimal Support: finally, the data slice must have enough error to be worth investigating. We required that there must be at least 2 misclassifications or it must cover 5% of the testing error — whichever value is larger is the criteria we go with.
It’s also interesting to note that you can tailor other heuristics to your business needs. Misclassifying some users is worse than others, so you can build that in to your data slicing criteria — think precision/recall tradeoff.
3. Summary and Takeaways
So, there you have it — FreaAI in all its glory.
Again, FreaAI is not open source, but hopefully it will be released to the public in the future. In the meantime, you can apply the frameworks we talked about to your own predictive models and determine where there’s systematic underperformance.
3.1. Summary
To recap, FreeAI uses HDR and decision trees to reduce the search space for our predictors. It then iteratively looks at individual features as well as combinations to determine where there’s low performance. These low-performance areas have some extra heuristics that ensure the findings are actionable.
3.2. Why should you care?
Well, first this framework helps engineers identify model weaknesses. When those weaknesses are found, they can be (hopefully) corrected, thereby improve the forecasts. This gain is especially enticing for black box models, such as neural nets, because there are no model coefficients.
By isolating areas of the data that underperform, we get a window into the black box.
FreaAI also hold interesting potential for other applications. One example is identifying model drift, which is what happens when a trained model becomes less and less effective over time. A hypothesis testing framework to determine model drift was just released by IBM.
Another interesting application would be determining model bias. In this case, bias is the concept of being unfair, such as refusing to give someone a loan based on their gender. By looking at different data splits where model performance is low, you can stumble upon areas of bias.
Thanks for reading! I’ll be writing 37 more posts that bring academic research to the DS industry. Check out my comments for links to the main source for this post as well as some useful resources.
Bio: Michael Berk (https://michaeldberk.com/) is a Data Scientist at Tubi.
Original. Reposted with permission.
Related:
- Antifragility and Machine Learning
- Adventures in MLOps with Github Actions, Iterative.ai, Label Studio and NBDEV
- Math 2.0: The Fundamental Importance of Machine Learning