How to Effectively Use Pandas GroupBy
Split the Pandas DataFrame into groups based on one or more columns and then apply various aggregation functions to each one of them.
Pandas is a powerful and widely-used open-source library for data manipulation and analysis using Python. One of its key features is the ability to group data using the groupby function by splitting a DataFrame into groups based on one or more columns and then applying various aggregation functions to each one of them.

Image from Unsplash
The groupby function is incredibly powerful, as it allows you to quickly summarize and analyze large datasets. For example, you can group a dataset by a specific column and calculate the mean, sum, or count of the remaining columns for each group. You can also group by multiple columns to get a more granular understanding of your data. Additionally, it allows you to apply custom aggregation functions, which can be a very powerful tool for complex data analysis tasks.
In this tutorial, you will learn how to use the groupby function in Pandas to group different types of data and perform different aggregation operations. By the end of this tutorial, you should be able to use this function to analyze and summarize data in various ways.
Hands-On Code Examples
Concepts are internalized when practiced well and this is what we are going to do next i.e. get hands-on with Pandas groupby function. It is recommended to use a Jupyter Notebook for this tutorial as you are able to see the output at each step.
Generate Sample Data
Import the following libraries:
- Pandas: To create a dataframe and apply group by
- Random - To generate random data
- Pprint - To print dictionaries
import pandas as pd
import random
import pprint
Next, we will initialize an empty dataframe and fill in values for each column as shown below:
df = pd.DataFrame()
names = [
    "Sankepally",
    "Astitva",
    "Shagun",
    "SURAJ",
    "Amit",
    "RITAM",
    "Rishav",
    "Chandan",
    "Diganta",
    "Abhishek",
    "Arpit",
    "Salman",
    "Anup",
    "Santosh",
    "Richard",
]

major = [
    "Electrical Engineering",
    "Mechanical Engineering",
    "Electronic Engineering",
    "Computer Engineering",
    "Artificial Intelligence",
    "Biotechnology",
]

yr_adm = random.sample(list(range(2018, 2023)) * 100, 15)
marks = random.sample(range(40, 101), 15)
num_add_sbj = random.sample(list(range(2)) * 100, 15)

df["St_Name"] = names
df["Major"] = random.sample(major * 100, 15)
df["yr_adm"] = yr_adm
df["Marks"] = marks
df["num_add_sbj"] = num_add_sbj
df.head()
Bonus tip – a cleaner way to do the same task is by creating a dictionary of all variables and values and later converting it to a dataframe.
student_dict = {
    "St_Name": [
        "Sankepally",
        "Astitva",
        "Shagun",
        "SURAJ",
        "Amit",
        "RITAM",
        "Rishav",
        "Chandan",
        "Diganta",
        "Abhishek",
        "Arpit",
        "Salman",
        "Anup",
        "Santosh",
        "Richard",
    ],
    "Major": random.sample(
        [
            "Electrical Engineering",
            "Mechanical Engineering",
            "Electronic Engineering",
            "Computer Engineering",
            "Artificial Intelligence",
            "Biotechnology",
        ]
        * 100,
        15,
    ),
    "Year_adm": random.sample(list(range(2018, 2023)) * 100, 15),
    "Marks": random.sample(range(40, 101), 15),
    "num_add_sbj": random.sample(list(range(2)) * 100, 15),
}
df = pd.DataFrame(student_dict)
df.head()
The dataframe looks like the one shown below. When running this code, some of the values won’t match as we are using a random sample.

Making Groups
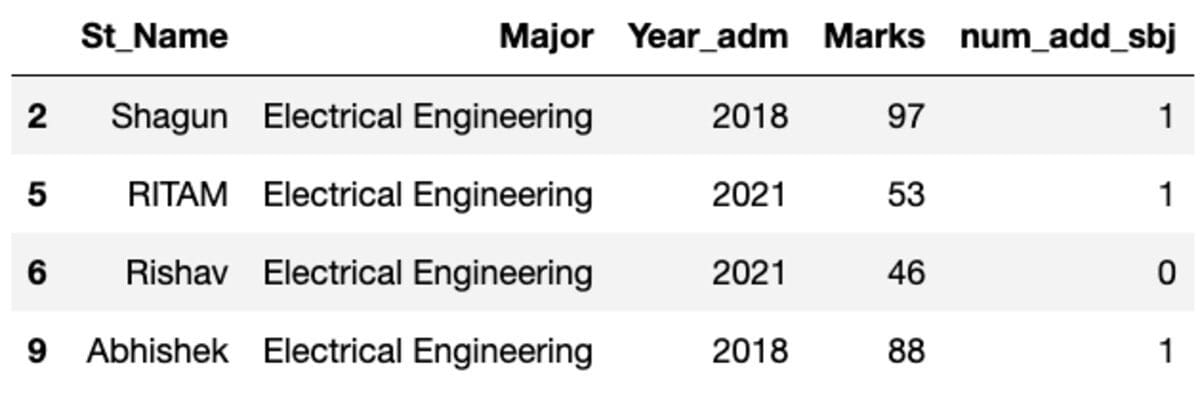
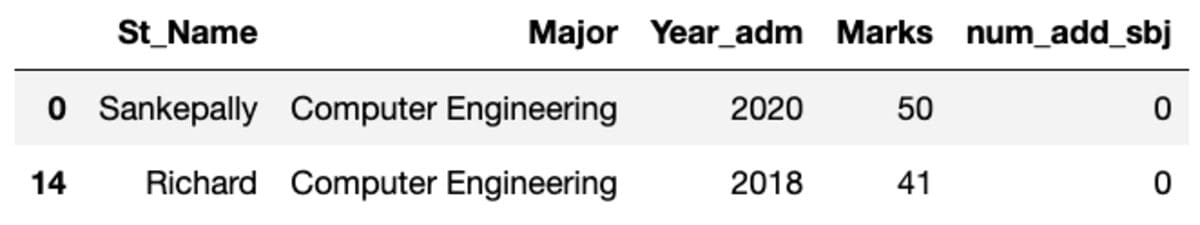
Let’s group the data by the “Major” subject and apply the group filter to see how many records fall into this group.
groups = df.groupby('Major')
groups.get_group('Electrical Engineering')
So, four students belong to the Electrical Engineering major.
You can also group by more than one column (Major and num_add_sbj in this case).
groups = df.groupby(['Major', 'num_add_sbj'])
Note that all the aggregate functions that can be applied to groups with one column can be applied to groups with multiple columns. For the rest of the tutorial, let’s focus on the different types of aggregations using a single column as an example.
Let’s create groups using groupby on the “Major” column.
groups = df.groupby('Major')
Applying Direct Functions
Let’s say you want to find the average marks in each Major. What would you do?
- Choose Marks column
- Apply mean function
- Apply round function to round off marks to two decimal places (optional)
groups['Marks'].mean().round(2)
Major
Artificial Intelligence    63.6
Computer Engineering       45.5
Electrical Engineering     71.0
Electronic Engineering     92.0
Mechanical Engineering     64.5
Name: Marks, dtype: float64
Aggregate
Another way to achieve the same result is by using an aggregate function as shown below:
groups['Marks'].aggregate('mean').round(2)
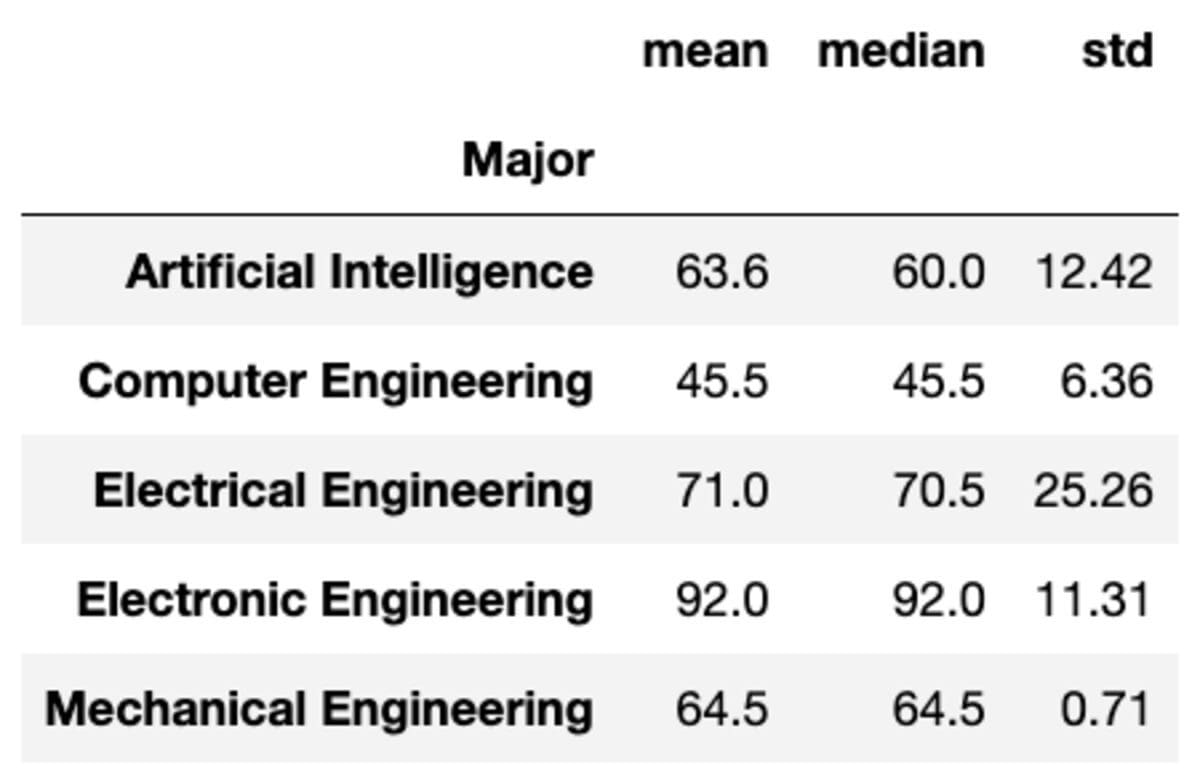
You can also apply multiple aggregations to the groups by passing the functions as a list of strings.
groups['Marks'].aggregate(['mean', 'median', 'std']).round(2)
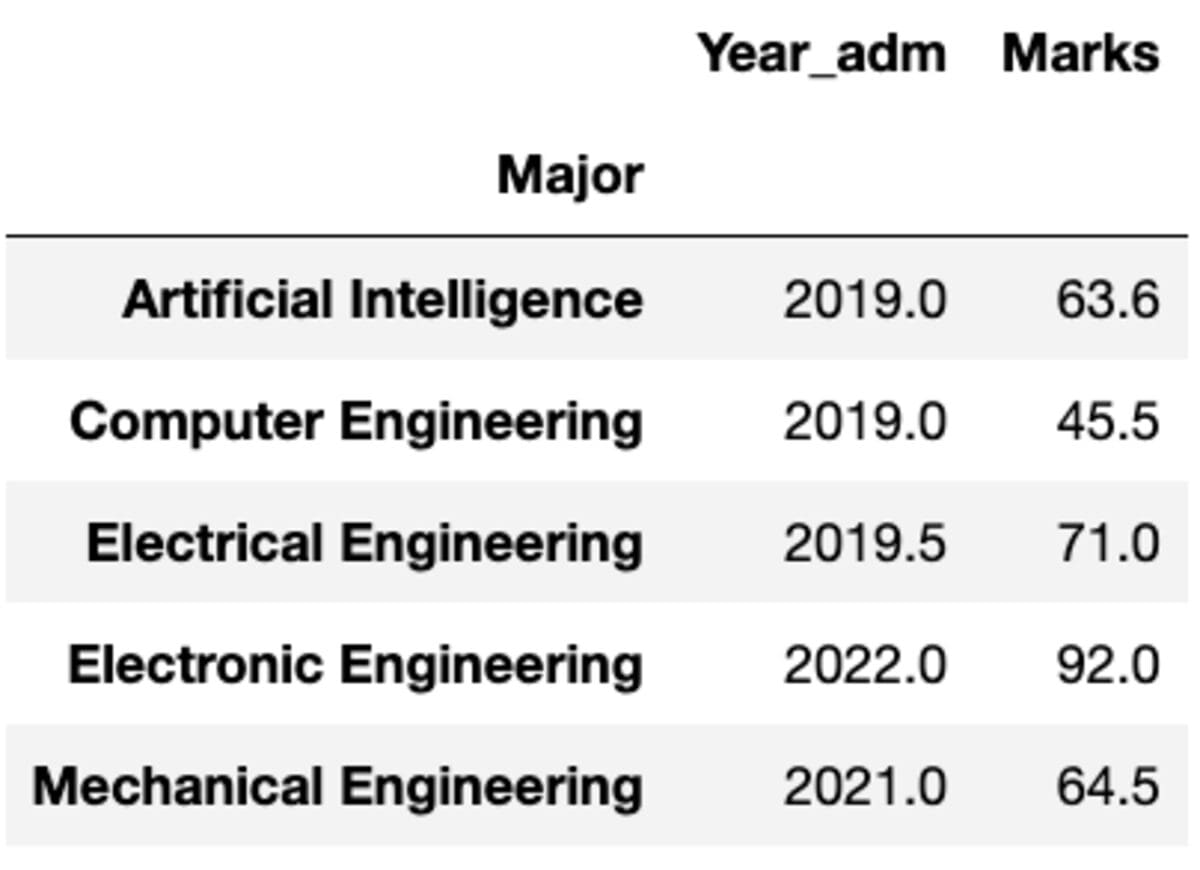
But what if you need to apply a different function to a different column. Don’t worry. You can also do that by passing {column: function} pair.
groups.aggregate({'Year_adm': 'median', 'Marks': 'mean'})
Transforms
You may very well need to perform custom transformations to a particular column which can be easily achieved using groupby(). Let’s define a standard scalar similar to the one available in sklearn’s preprocessing module. You can transform all the columns by calling the transform method and passing the custom function.
def standard_scalar(x):
    return (x - x.mean())/x.std()
groups.transform(standard_scalar)
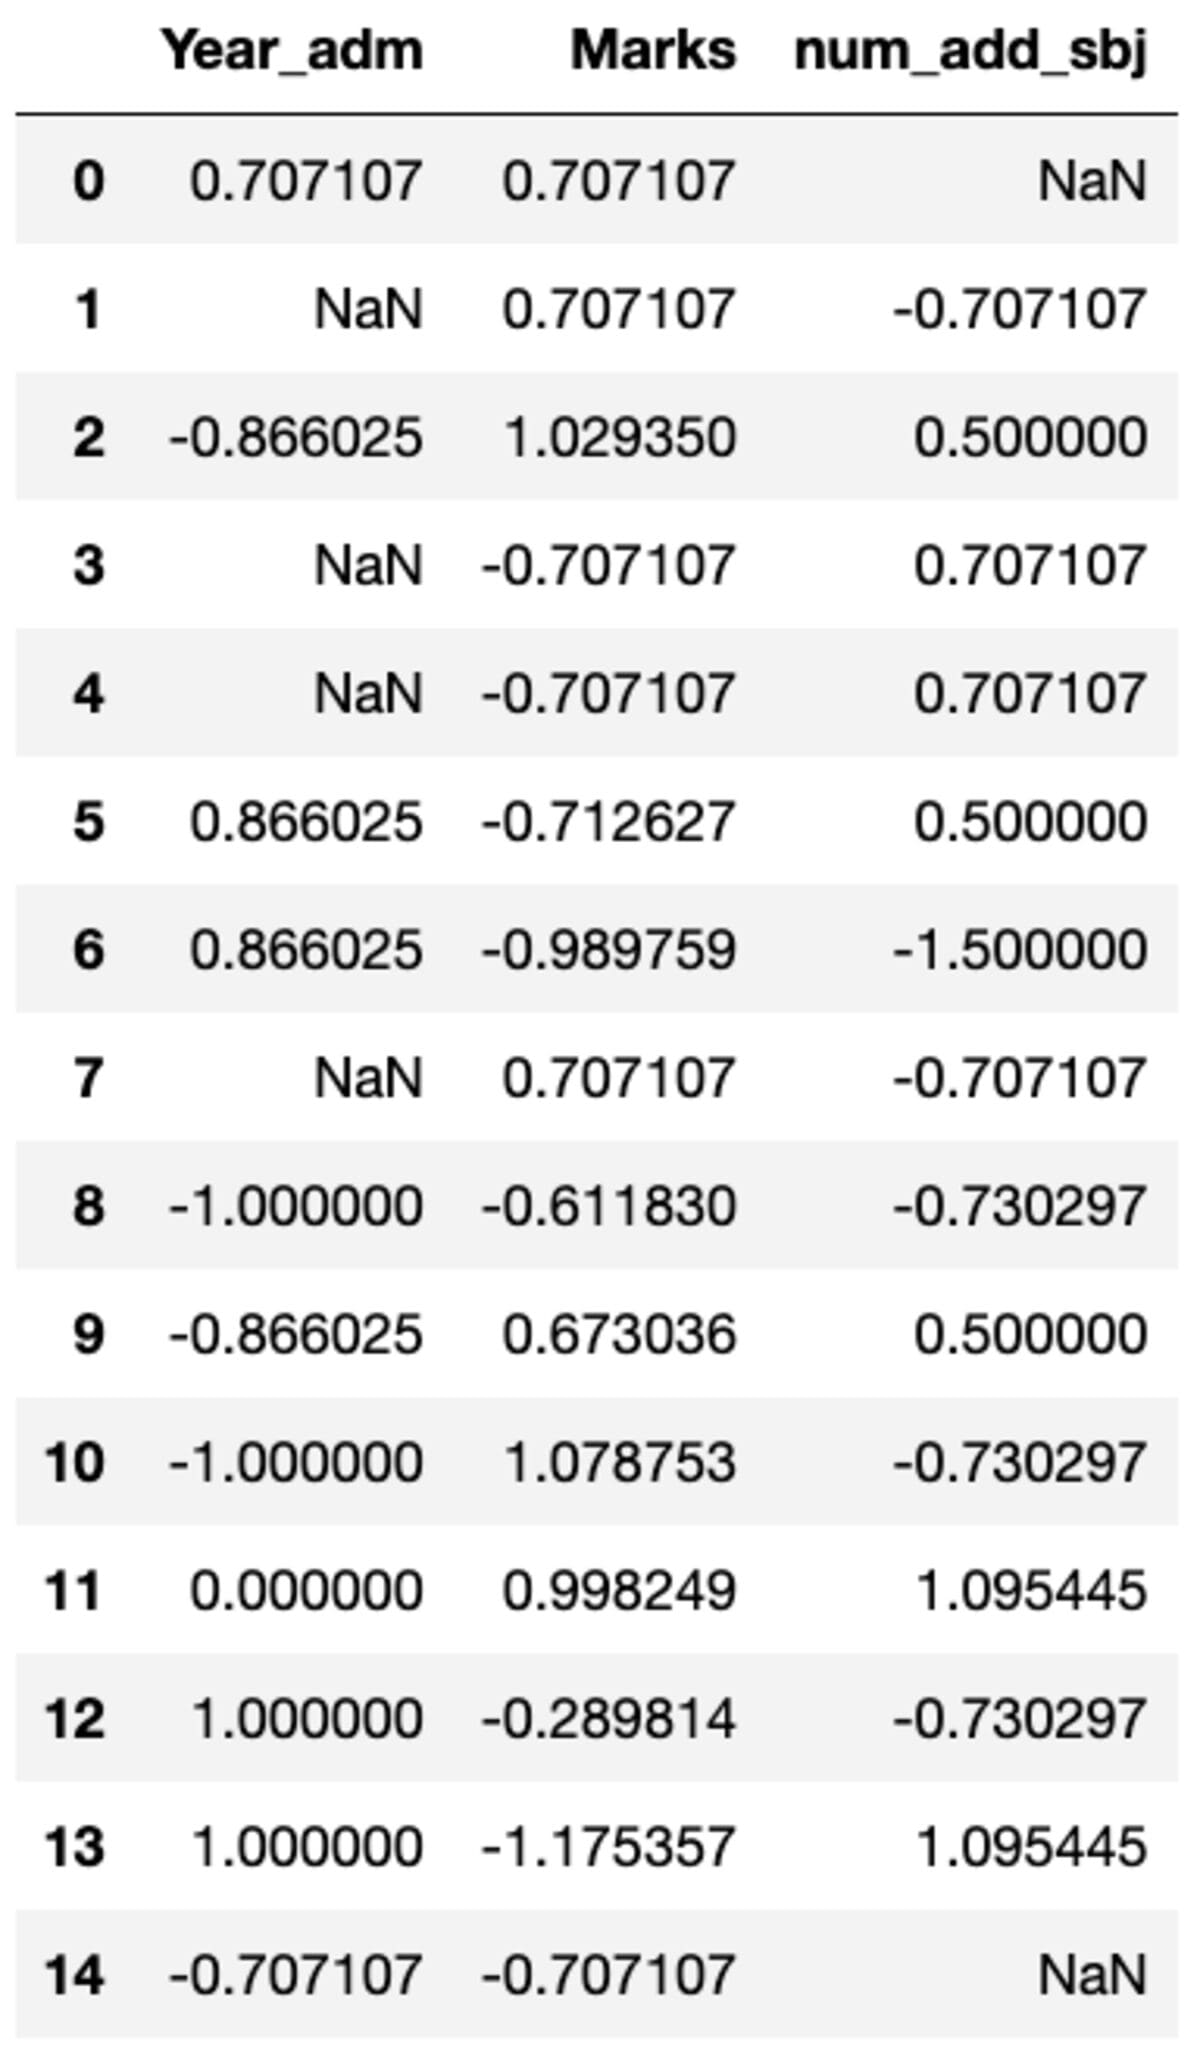
Note that “NaN” represents groups with zero standard deviation.
Filter
You may want to check which “Major” is underperforming i.e. the one where average student “Marks” are less than 60. It requires you to apply a filter method to groups with a function inside it. The below code uses a lambda function to achieve the filtered results.
groups.filter(lambda x: x['Marks'].mean() < 60)
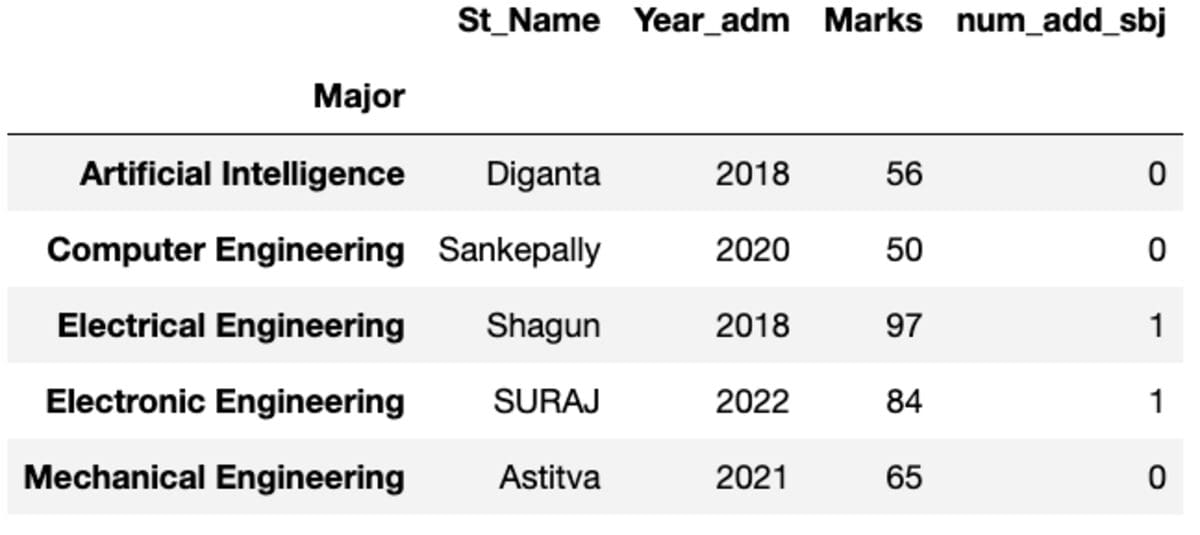
First
It gives you its first instance sorted by index.
groups.first()
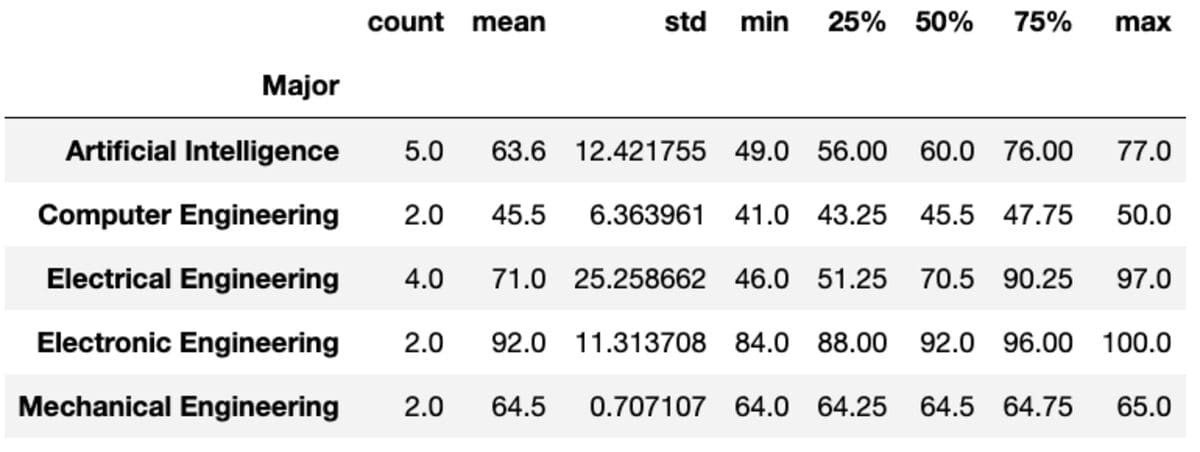
Describe
The “describe” method returns basic statistics like count, mean, std, min, max, etc. for the given columns.
groups['Marks'].describe()
Size
Size, as the name suggests, returns the size of each group in terms of the number of records.
groups.size()
Major
Artificial Intelligence    5
Computer Engineering       2
Electrical Engineering     4
Electronic Engineering     2
Mechanical Engineering     2
dtype: int64
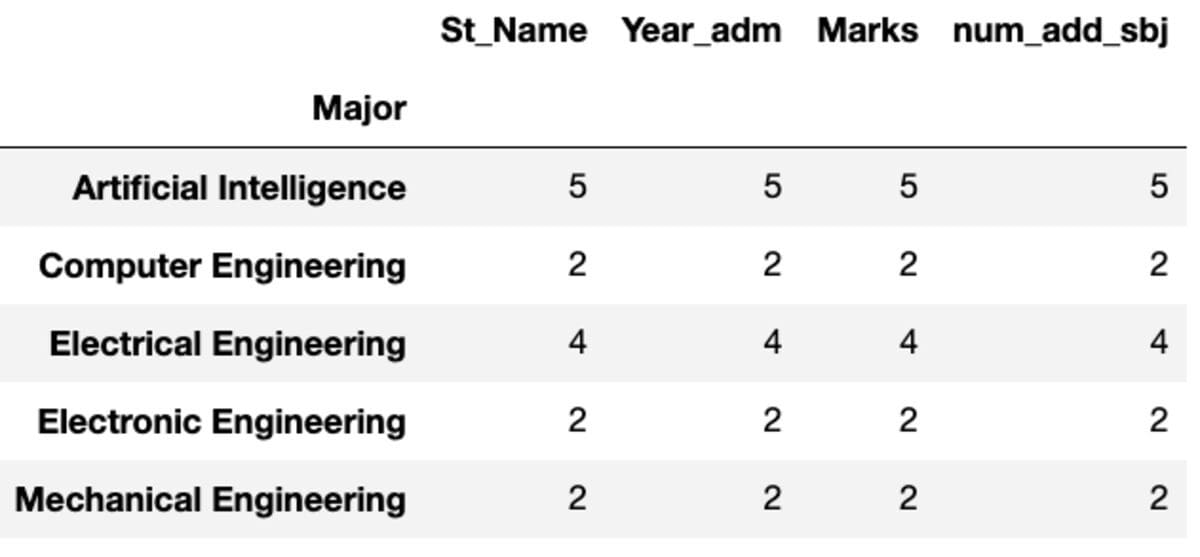
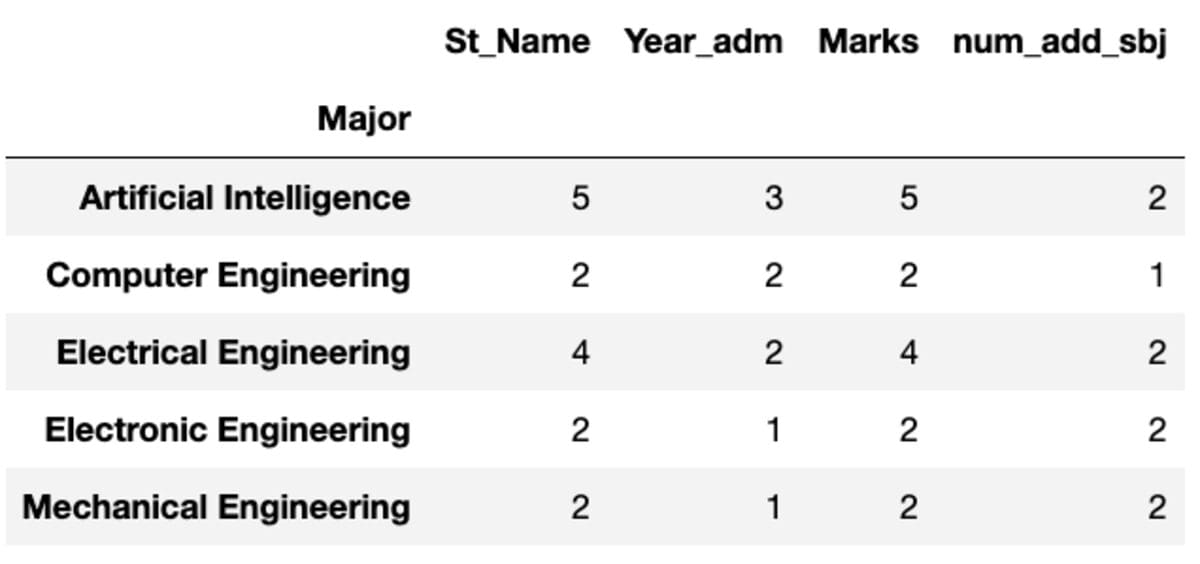
Count and Nunique
“Count” returns all values whereas “Nunique” returns only the unique values in that group.
groups.count()
groups.nunique()
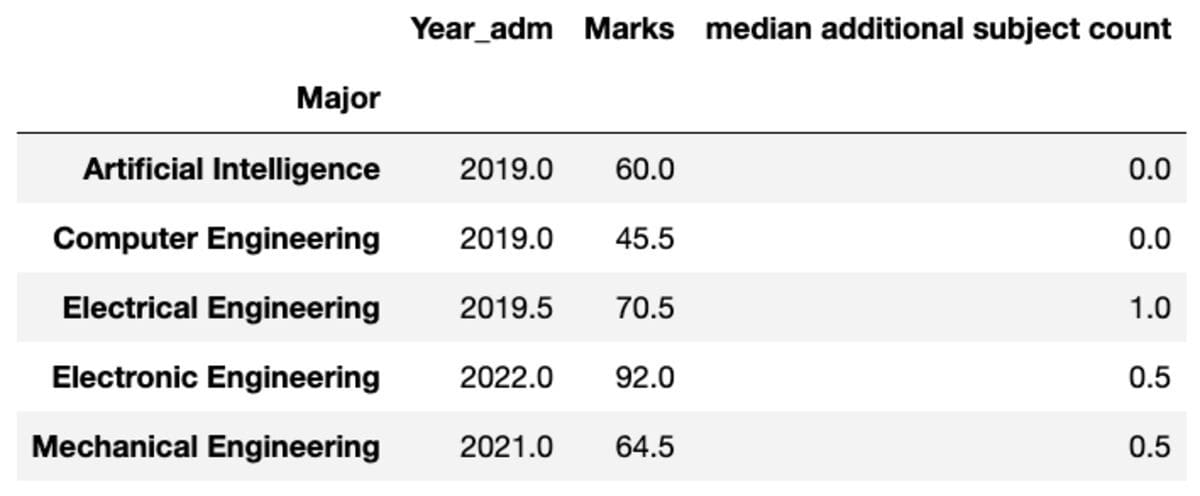
Rename
You can also rename the aggregated columns' name as per your preference.
groups.aggregate("median").rename(
    columns={
        "yr_adm": "median year of admission",
        "num_add_sbj": "median additional subject count",
    }
)
Get most out of the groupby Function
- Be clear on the purpose of the groupby: Are you trying to group the data by one column to get the mean of another column? Or are you trying to group the data by multiple columns to get the count of the rows in each group?
- Understand the indexing of the data frame: The groupby function uses the index to group the data. If you want to group the data by a column, make sure that the column is set as the index or you can use .set_index()
- Use the appropriate aggregate function: It can be used with various aggregation functions like mean(), sum(), count(), min(), max()
- Use the as_index parameter: When set to False, this parameter tells pandas to use the grouped columns as regular columns instead of index.
You can also use groupby() in conjunction with other pandas functions like pivot_table(), crosstab(), and cut() to extract more insights from your data.
Summary
A groupby function is a powerful tool for data analysis and manipulation as it allows you to group rows of data based on one or more columns and then perform aggregate calculations on the groups. The tutorial demonstrated various ways to use the groupby function with the help of code examples. Hope it provides you with an understanding of the different options that come with it and also how they help in the data analysis.
Vidhi Chugh is an AI strategist and a digital transformation leader working at the intersection of product, sciences, and engineering to build scalable machine learning systems. She is an award-winning innovation leader, an author, and an international speaker. She is on a mission to democratize machine learning and break the jargon for everyone to be a part of this transformation.