Automated Machine Learning with Python: A Case Study
How to Automate the Complete Lifecycle of a Data Science Project using AutoML tools, which reduces the programming effort for implementation with H2O.ai.

Image by Author
In today’s world, all organizations want to use Machine learning to analyze the data they generate daily from the users. With the help of a machine or deep learning algorithms, they can analyze the data. Afterwards, they can make the prediction of testing data in the production environment. But suppose we start following the mentioned process. In that case, we may face problems such as building and training machine learning models since this is time-consuming and requires expertise in domains like programming, statistics, data science, etc.
So, to overcome such challenges, Automated Machine Learning (AutoML) comes into the picture, which emerged as one of the most popular solutions that can automate many aspects of the machine learning pipeline. So, in this article, we will discuss AutoML with Python through a real-life case study on the Prediction of heart disease.
Case Study: Prediction of Heart Disease
We can easily observe that problem-related to the heart are the major cause of death worldwide. The only way to reduce such types of impact is to detect the disease early with some of the automated methods so that less time will be consumed there and, after that, take some prevention measures to reduce its effect. So, by keeping this problem in mind, we will explore one of the datasets related to medical patient records to build a machine-learning model from which we can predict the likelihood or probability of a patient with heart disease. This type of solution can easily be applied in hospitals to check so doctors can provide some treatments as soon as possible.
The complete model pipeline we followed in this case study is shown below.
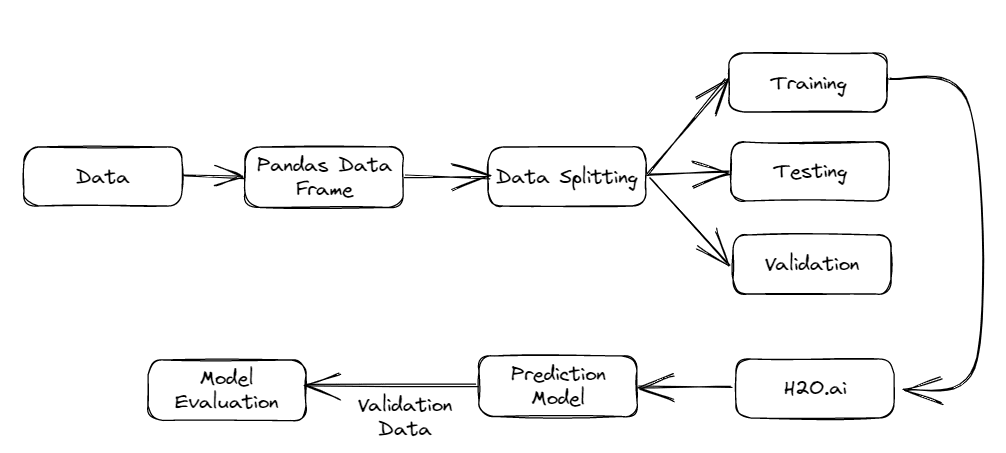
Fig.1 AutoML Model Pipeline | Image by Author
Implementation
Step-1: Before starting to implement, let's import the required libraries, including NumPy for matrix manipulation, Pandas for data analysis, and Matplotlib for Data Visualization.
import numpy as np
import pandas as pd
import matplotlib.pyplot as plt
import h2o
from h2o.automl import H2OAutoML
Step-2: After importing all the required libraries in the above step, we will now try to load our dataset while utilizing the Pandas data frame to store that in an optimized manner, as they are much more efficient in terms of both space and time complexity compared to other data structures like a linked list, arrays, trees, etc.
Further, we can perform Data preprocessing to prepare the data for further modelling and generalization. To download the dataset which we are using here, you can easily refer to the link.
# Initialize H2O
h2o.init()

# Load the dataset
data = pd.read_csv("heart_disease.csv")

# Convert the Pandas data frame to H2OFrame
hf = h2o.H2OFrame(data)
Step-3: After preparing the data for the machine learning model, we will use one of the famous automated machine learning libraries called H2O.ai, which helps us create and train the model.
Image by H2O.ai
The main benefit of this platform is that it provides high-level API from which we can easily automate many aspects of the pipeline, including Feature Engineering, Model selection, Data Cleaning, Hyperparameter Tuning, etc., which drastically the time required to train the machine learning model for any of the data science projects.
Step-4: Now, to build the model, we will use the API of the H2O.ai library, and to use this, we have to specify the type of problem, whether it is a regression problem or a classification problem, or some other type with the target variable mentioned. Then, automatically this library chooses the best model for the given problem statement, including algorithms such as Support Vector Machines, Decision Trees, Deep neural networks, etc.
# Split the data into training and testing sets
train, test, valid = hf.split_frame(ratios=[0.7, 0.15])

# Specify the target variable and the type of problem
y = "target"
problem_type = "binary"
Step-5: After finalizing the best model from a set of algorithms, the most critical task is fine-tuning our model based on the hyperparameters involved. This tuning process involved many techniques, such as Grid-search Cross Validation, etc., which allowed for finding the best set of hyperparameters for the given problem.
# Run AutoML
aml = H2OAutoML(max_models=10, seed=1, balance_classes=True)
aml.train(y=y, training_frame=train, validation_frame=valid)

# View the leaderboard
lb = aml.leaderboard
print(lb)

# Get the best model
best_model = aml.leader
Step-6: Now, the final task is to check the model’s performance, using evaluation metrics such as Confusion matrix, Precision, recall, etc., for classification problems and MSE, MAE, RMSE, and R-square, for regression models so that we can find some inference of our model’s working in the production environment.
# Make predictions on the test data
preds = best_model.predict(test)

# Convert the predictions to a Pandas dataframe
preds_df = preds.as_data_frame()

# Evaluate the model using accuracy, precision, recall, and F1-score
accuracy = best_model.accuracy(test)
precision = best_model.precision(test)
recall = best_model.recall(test)
f1 = best_model.f1(test)

print("Accuracy:", accuracy)
print("Precision:", precision)
print("Recall:", recall)
print("F1-score:", f1)
Step-7: Finally, we will plot the ROC curve which shows the graph between false positive rate (which means that our model is predicting the wrong result compare to the actual and model predicts the positive class, where it belongs to the negative class), and false negative rate(which means that our model is predicting the wrong result compare to the actual and model predicts the negative class, where it belongs to the positive class) and also print the confusion matrix and eventually our model prediction and evaluation on the test data is completed. Then we will shut down our H2O.
# Plot the ROC curve
roc = best_model.roc()
roc.plot()
plt.show()

# Plot the confusion matrix
cm = best_model.confusion_matrix()
cm.plot()
plt.show()

# Shutdown H2O
h2o.shutdown()
You can access the notebook of the mentioned code from here.
Conclusion
To conclude this article, we have explored the different aspects of one of the most popular platforms which automate the whole process of machine learning or data science tasks, through which we can easily create and train machine learning models using the python programming language and also we have covered one of the famous case studies of heart disease prediction, which enhances the understanding on how to use such platforms effectively. Using such platforms, machine learning pipelines can be easily optimized, saving the engineer’s time in the organization and reducing system latency and resource utilization such as GPU and CPU cores, which are easily accessible to a large audience.
Aryan Garg is a B.Tech. Electrical Engineering student, currently in the final year of his undergrad. His interest lies in the field of Web Development and Machine Learning. He have pursued this interest and am eager to work more in these directions.