Using SHAP Values for Model Interpretability in Machine Learning
Discover how SHAP can help you understand the impact of model features on predictions.
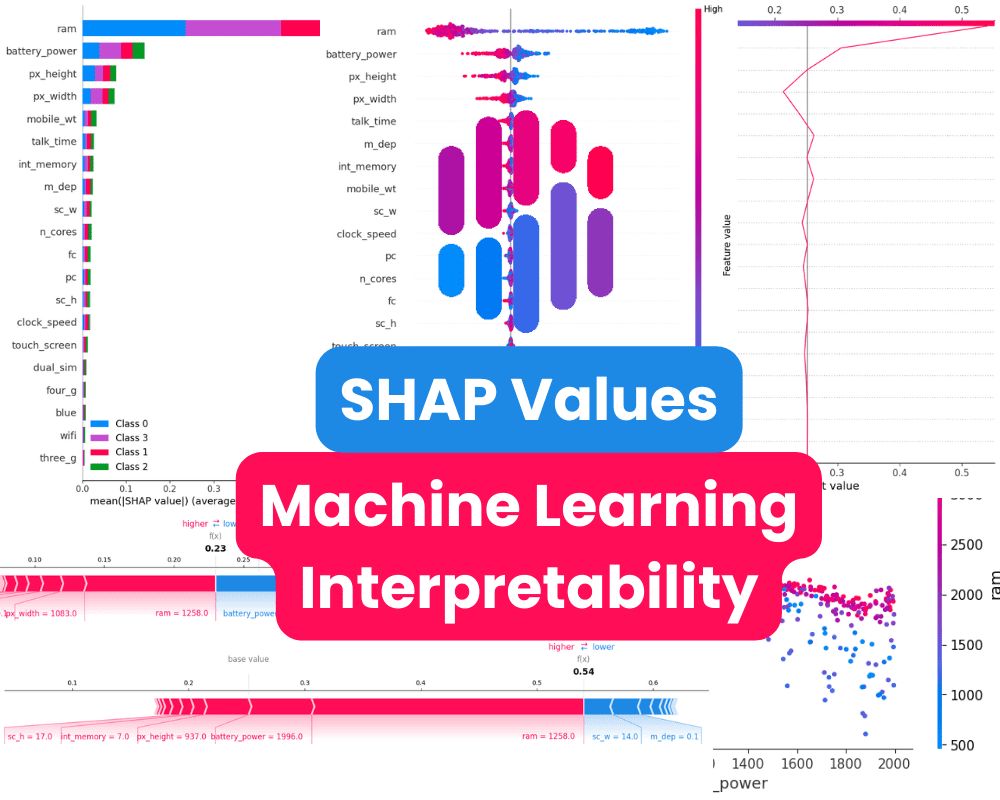
Image by Author
Machine Learning Interpretability
Machine learning interpretability refers to techniques for explaining and understanding how machine learning models make predictions. As models become more complex, it becomes increasingly important to explain their internal logic and gain insights into their behavior.
This is important because machine learning models are often used to make decisions that have real-world consequences, such as in healthcare, finance, and criminal justice. Without interpretability, it can be difficult to know whether a machine learning model is making good decisions or if it is biased.
When it comes to machine learning interpretability, there are various techniques to consider. One popular method is to determine feature importance scores, which reveal the features that have the greatest impact on the model's predictions. SKlearn models offer feature importance scores by default, but you can also utilize tools like SHAP, Lime, and Yellowbrick for better visualization and understanding of your machine learning results.
This tutorial will cover SHAP values and how to interpret machine learning results with the SHAP Python package.
What are SHAP Values?
SHAP values are based on Shapley values from game theory. In game theory, Shapley values help determine how much each player in a collaborative game has contributed to the total payout.
For a machine learning model, each feature is considered a "player". The Shapley value for a feature represents the average magnitude of that feature's contribution across all possible combinations of features.
Specifically, SHAP values are calculated by comparing a model's predictions with and without a particular feature present. This is done iteratively for each feature and each sample in the dataset.
By assigning each feature an importance value for every prediction, SHAP values provide a local, consistent explanation of how the model behaves. They reveal which features have the most impact on a specific prediction, whether positively or negatively. This is valuable for understanding the reasoning behind complex machine learning models such as deep neural networks.
Getting Started with SHAP Values
In this section, we will use the Mobile Price Classification dataset from Kaggle to build and analyze multi classification models. We will be classifying mobile phone prices based on the features, such as ram, size, etc. The target variable is <code>price_range</code> with values of 0(low cost), 1(medium cost), 2(high cost) and 3(very high cost).
Note: Code source with outputs is available at Deepnote workspace.
Installing SHAP
It is quite simple to install <code>shap</code> on your system using <code>pip</code> or <code>conda</code> commands.
pip install shap
or
conda install -c conda-forge shap
Loading the data
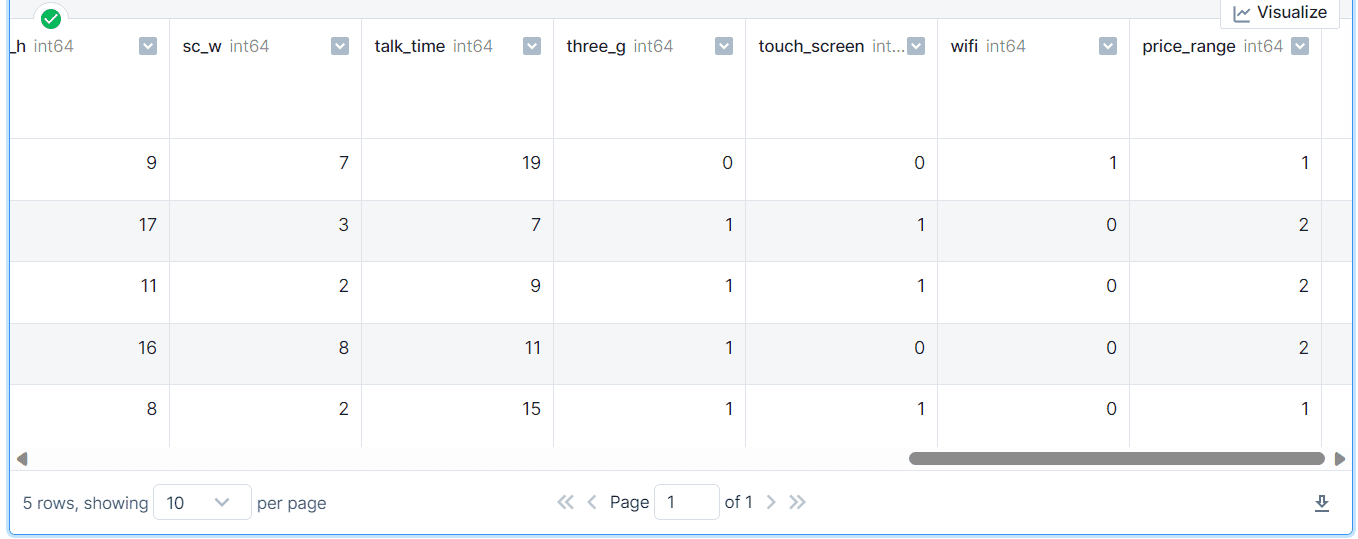
The dataset is clean and well-organized, with categories converted to numerical using label encoders.
import pandas as pd

mobile = pd.read_csv("train.csv")
mobile.head()
Preparing the data
To begin, we will identify the dependent and independent variables and then split them into separate training and testing sets.
from sklearn.model_selection import train_test_split


X = mobile.drop('price_range', axis=1)
y = mobile.pop('price_range')

# Train and test split
X_train, X_test, y_train, y_test = train_test_split(X, y, test_size=0.3, random_state=1)
Training and evaluating the model
After that, we will train our Random Forest classifier model using the training set and evaluate its performance on the testing set. We have obtained an accuracy of 87%, which is quite good, and our model is well-balanced overall.
from sklearn.ensemble import RandomForestClassifier
from sklearn.metrics import classification_report

# Model fitting
rf = RandomForestClassifier()
rf.fit(X_train, y_train)

# Prediction
y_pred = rf.predict(X_test)

# Model evaluation
print(classification_report(y_pred, y_test))
              precision    recall  f1-score   support

           0       0.95      0.91      0.93       141
           1       0.83      0.81      0.82       153
           2       0.80      0.85      0.83       158
           3       0.93      0.93      0.93       148

    accuracy                           0.87       600
   macro avg       0.88      0.87      0.88       600
weighted avg       0.87      0.87      0.87       600
Calculating SHAP Value
In this part, we will create an SHAP tree explainer and use it to calculate SHAP values of the testing set.
import shap
shap.initjs()

# Calculate SHAP values
explainer = shap.TreeExplainer(rf)
shap_values = explainer.shap_values(X_test)
Summary Plot
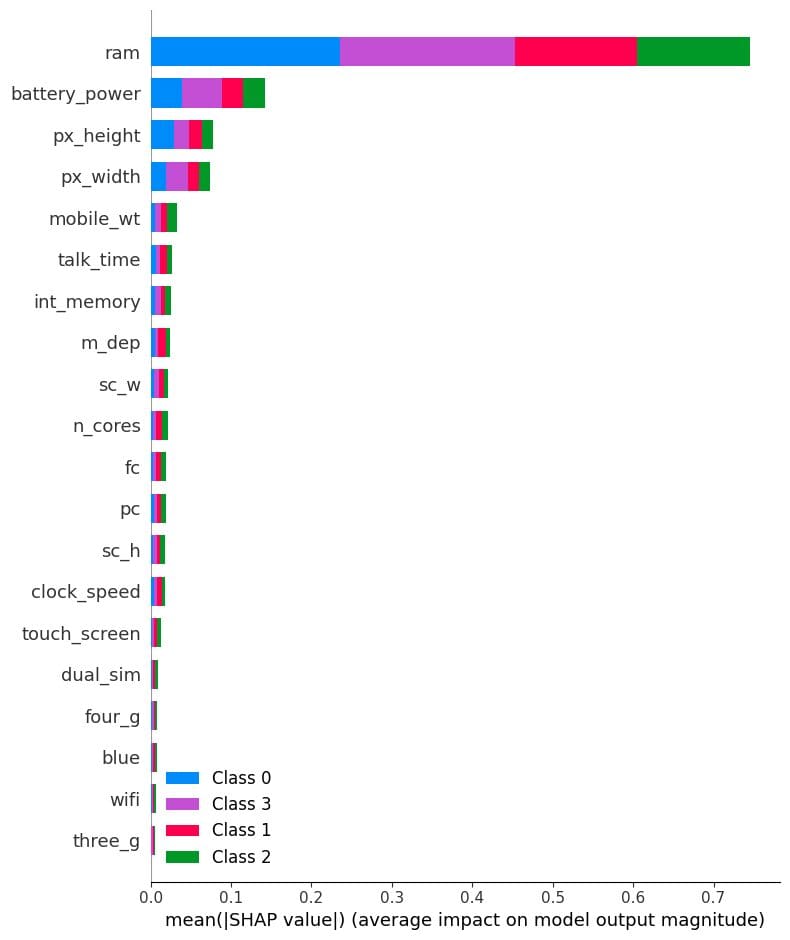
The summary plot is a graphical representation of the feature importance of each feature in the model. It is a useful tool for understanding how the model makes predictions and for identifying the most important features.
In our case, it shows feature importance per target class. It turns out the “ram”, “battery_power”, and size of the phone play an important role in determining the price range.
# Summarize the effects of features
shap.summary_plot(shap_values, X_test)
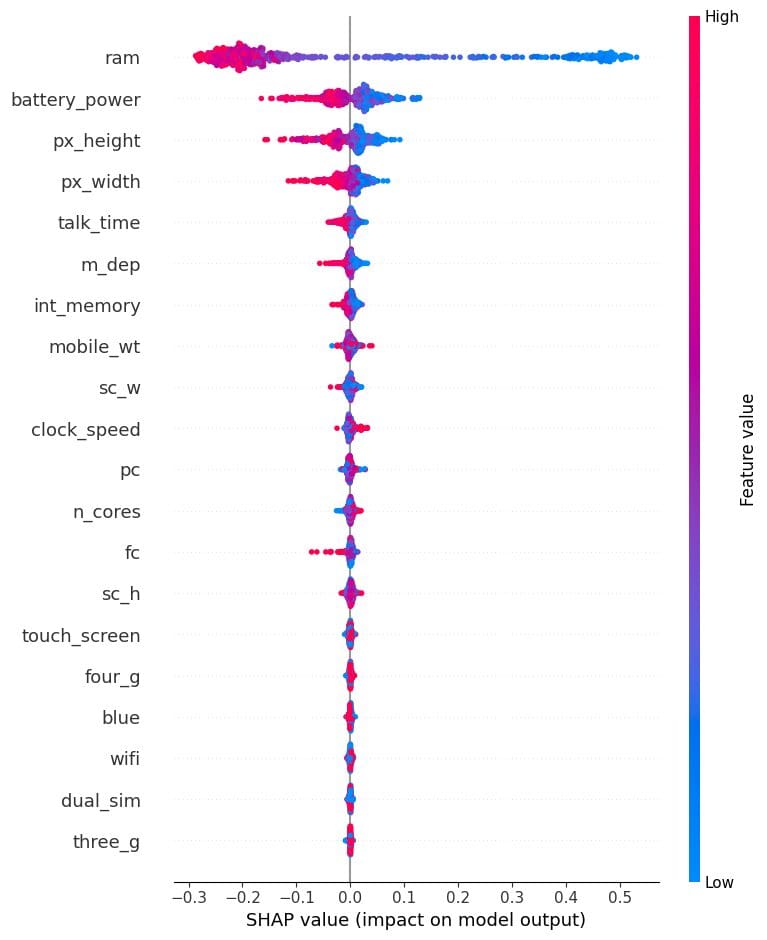
We will now visualize the future importance of the class “0”. We can clearly see that, ram, battery, and size of the phone have negative effects for predicting low cost mobile phones.
shap.summary_plot(shap_values[0], X_test)
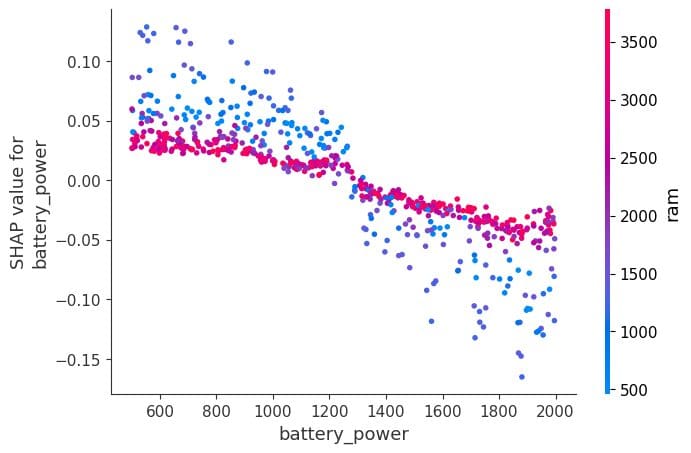
Dependence Plot
A dependence plot is a type of scatter plot that displays how a model's predictions are affected by a specific feature. In this example, the feature is “battery_power”.
The x-axis of the plot shows the values of “battery_power”, and the y-axis shows the shap value. When the battery power exceeds 1200, it begins to negatively affect the classification of lower-end mobile phone models.
shap.dependence_plot("battery_power", shap_values[0], X_test,interaction_index="ram")
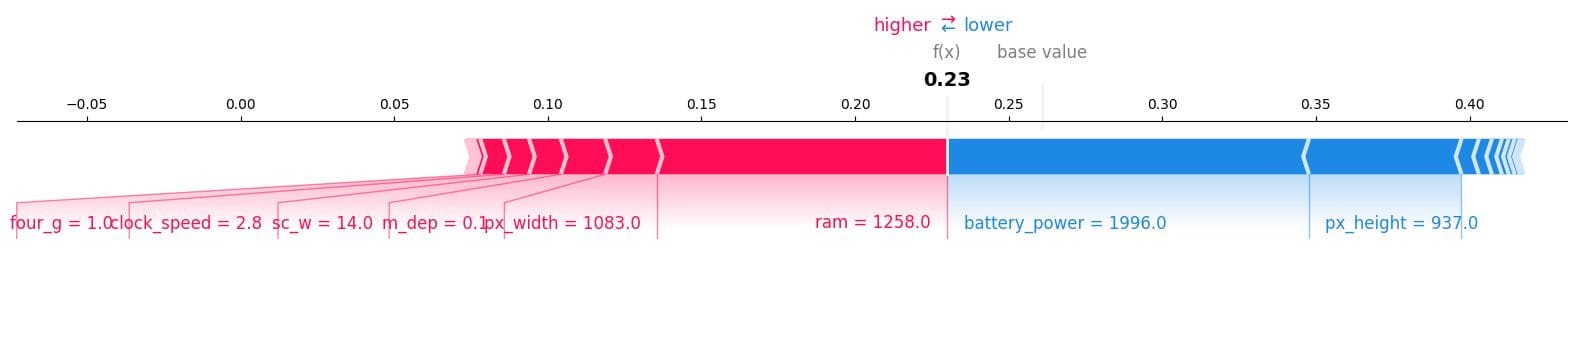
Force Plot
Let's narrow our focus to a single sample. Specifically, we'll take a closer look at the 12th sample to see which features contributed to the "0" result. To accomplish this, we'll use a force plot and input the expected value, SHAP value, and testing sample.
It turns out ram, phone size, and clock speed have a higher influence on models. We have also noticed that the model will not predict “0” class as the f(x) is lower.
shap.plots.force(explainer.expected_value[0], shap_values[0][12,:], X_test.iloc[12, :], matplotlib = True)
We will now visualize the force plot for the class ”1”, and we can see that it is the right class.
shap.plots.force(explainer.expected_value[1], shap_values[1][12, :], X_test.iloc[12, :],matplotlib = True)
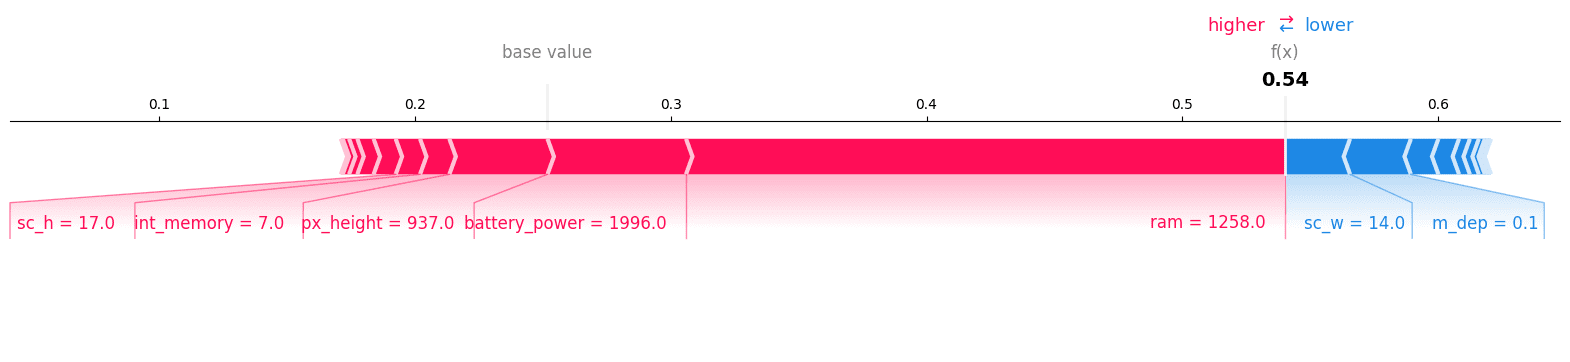
We can confirm our prediction by checking the 12th record of the testing set.
y_test.iloc[12]
>>> 1
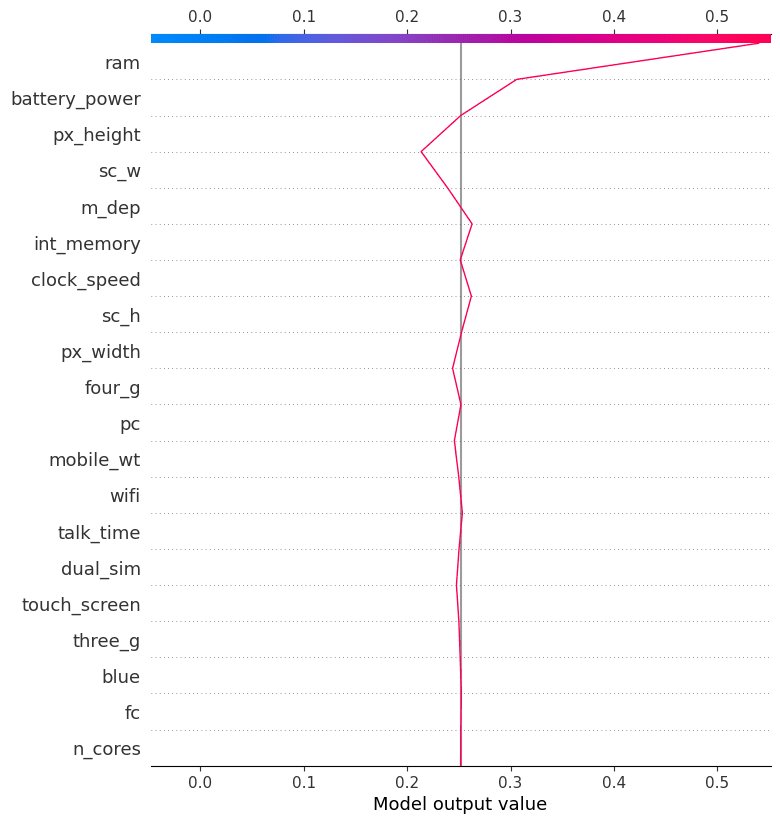
Decision Plot
Decision plots can be a useful tool for understanding the decision-making process of a machine learning model. They can help us to identify the features that are most important to the model's predictions and to identify potential biases.
To better understand the factors that influenced the model's prediction of class "1", we will examine the decision plot. Based on this plot, it appears that phone height had a negative impact on the model, while RAM had a positive impact.
shap.decision_plot(explainer.expected_value[1], shap_values[1][12,:], X_test.columns)
Conclusion
In this blog post, we have introduced SHAP values, a method for explaining the output of machine learning models. We have shown how SHAP values can be used to explain individual predictions and the overall performance of a model. We have also provided examples of how SHAP values can be used in practice.
As machine learning expands into sensitive domains like healthcare, finance, and autonomous vehicles, interpretability and explainability will only grow in importance. SHAP values offer a flexible, consistent approach to explaining predictions and model behavior. It can be used to gain insights into how the models make predictions, identify potential biases, and improve the models' performance.
Abid Ali Awan (@1abidaliawan) is a certified data scientist professional who loves building machine learning models. Currently, he is focusing on content creation and writing technical blogs on machine learning and data science technologies. Abid holds a Master's degree in Technology Management and a bachelor's degree in Telecommunication Engineering. His vision is to build an AI product using a graph neural network for students struggling with mental illness.