Getting Started With Go Programing For Data Science
Learn how to perform data analysis, data visualization, and model training in GoLang, just like Python.
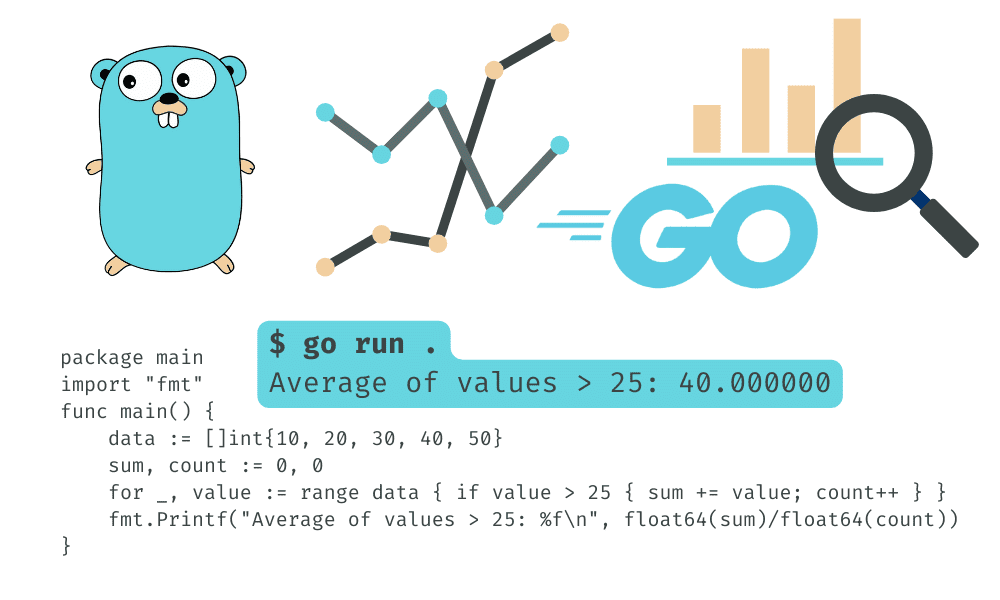
Image by Author
Go programming language has exploded in popularity among developers as a general-purpose language. It's fast, simple, and powerful, perfect for building Web applications, Mobile applications, and System programming. Recently, Go has begun sneaking into the realm of machine learning and data analysis, making it a compelling choice for data science projects.
If you're looking to learn a new language that will help you with data analysis and visualization tasks more efficiently, Go might be the perfect choice for you. In this tutorial, you'll learn the basics of setting up Go, performing data analysis and visualization, and building a simple KNN classifier.
Setting up
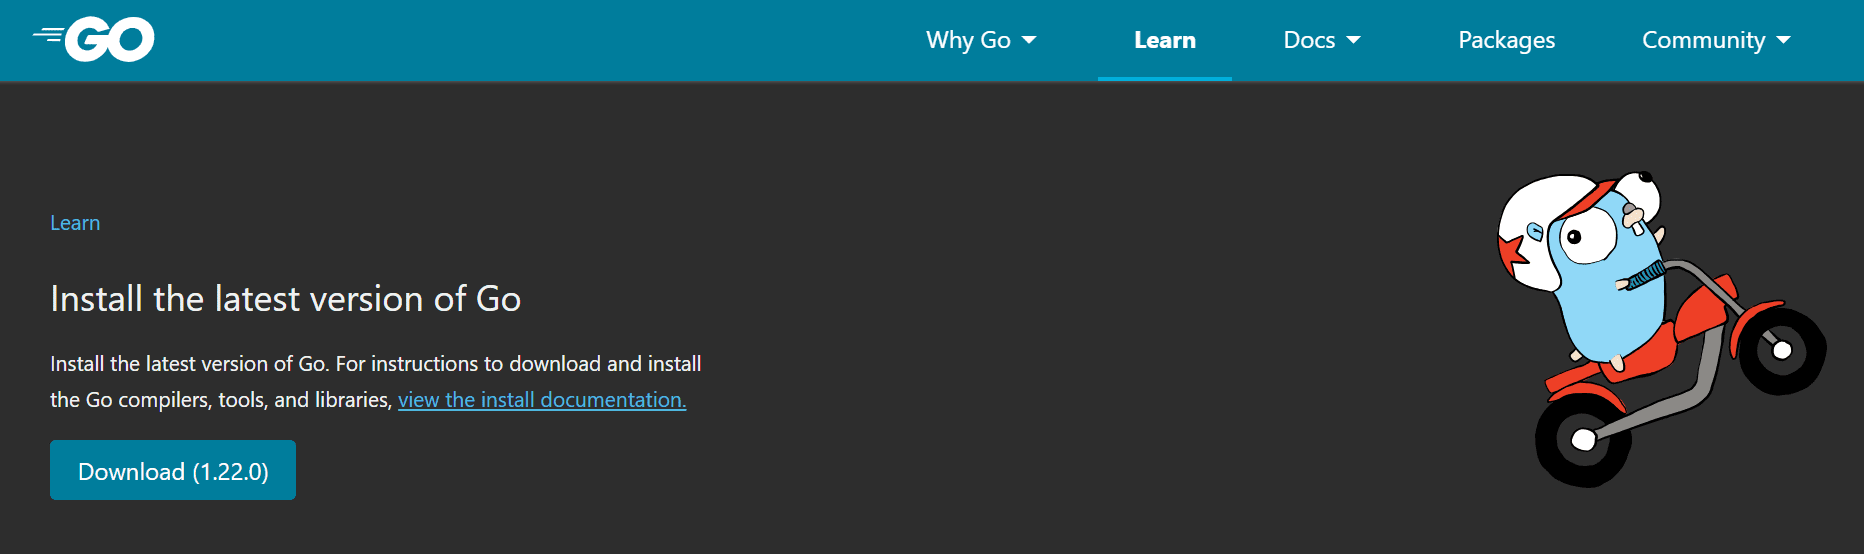
Download and install the latest version of Go by going to go.dev. It is that simple.
To check if it is successfully install, run the below command:
$ go version
go version go1.22.0 windows/amd64
Next, we will create a project folder and change the directory to the folder.
$ mkdir go-example
$ cd go-example
Initialize the Go module. This command creates a `go.mod file` to track your code's dependencies.
$ go mod init example/kdnuggets
go: creating new go.mod: module example/kdnuggets
Start the IDE or code editor. In our case, we are using VSCode.
code .
Write a simple print command in the main function.
package main

import "fmt"

func main() {
    // Print to the console
    fmt.Println("Welcome to KDnuggets")
}
Run the go run command in the terminal.
$ go run .
Welcome to KDnuggets
It is quite similar to Python but offers so many features compared to Python. Especially effective package management.
Simple Data Analysis with Go
In this data analysis example, we will download and load the Adult Census Income dataset from Kaggle.
First, import all of the Go packages that we are going to use for analysis. Then, load the CSV file using the `os` command. Convert the raw data into a dataframe using the `gota` data frame package. Finally, we will print the first 2 rows.
package main

import (
    "fmt"
    "os"
    "github.com/go-gota/gota/dataframe"
    "github.com/go-gota/gota/series"
)

func main() {

    f, err := os.Open("adult.csv")
    if err != nil {
        fmt.Println(err)
        return
    }
    defer f.Close()

    df := dataframe.ReadCSV(f)

    fmt.Println(df.Subset([]int{0, 1}))

}
Before running the code, we have to install all the packages used in the above code. For that, we will run:
$ go mod tidy

go: finding module for package github.com/go-gota/gota/series
go: finding module for package github.com/go-gota/gota/dataframe
go: downloading github.com/go-gota/gota v0.12.0
go: found github.com/go-gota/gota/dataframe in github.com/go-gota/gota v0.12.0
go: found github.com/go-gota/gota/series in github.com/go-gota/gota v0.12.0
go: downloading golang.org/x/net v0.0.0-20210423184538-5f58ad60dda6
go: downloading gonum.org/v1/gonum v0.9.1
go: downloading golang.org/x/exp v0.0.0-20191002040644-a1355ae1e2c3
go: downloading gonum.org/v1/netlib v0.0.0-20190313105609-8cb42192e0e0
After installing all packages, run the code by providing the file name.
The `gota` dataframe is not as easy to read as the `pandas` dataframe, but it allows for reading huge datasets in seconds.
$ go run simple-analysis.go

[2x15] DataFrame

    age   workclass fnlwgt education education.num marital.status ...
 0: 90    ?         77053  HS-grad   9             Widowed        ...
 1: 82    Private   132870 HS-grad   9             Widowed        ...
                           ...

Not Showing: occupation , relationship , race , sex ,
capital.gain , capital.loss , hours.per.week , native.country ,
income
Now, we will write the full code for filtering, calculating the mean, and generating the summary. The code is quite similar to pandas, but you have to read the documentation to understand how each function interacts.
package main

import (
	"fmt"
	"github.com/go-gota/gota/dataframe"
	"github.com/go-gota/gota/series"
	"os"
)

func main() {
	// Loading the CSV file
	f, err := os.Open("adult.csv")
	if err != nil {
		fmt.Println(err)
		return
	}
	defer f.Close()

	df := dataframe.ReadCSV(f)

	// Filter the data: individuals with education level "HS-grad"
	hsGrad := df.Filter(dataframe.F{Colname: "education", Comparator: series.Eq, Comparando: "HS-grad"})
	fmt.Println("\nFiltered DataFrame (HS-grad):")
	fmt.Println(hsGrad)

	// calculating the average age of individuals in the dataset
	avgAge := df.Col("age").Mean()
	fmt.Printf("\nAverage age: %.2f\n", avgAge)

	// Describing the data
	fmt.Println("\nGenerate descriptive statistics:")
	description := df.Describe()
	fmt.Println(description)

}
We displayed the filtered dataset, average age, and a summary of numerical columns.
Filtered DataFrame (HS-grad):
[10501x15] DataFrame

    age   workclass        fnlwgt education education.num marital.status     ...
 0: 90    ?                77053  HS-grad   9             Widowed            ...
 1: 82    Private          132870 HS-grad   9             Widowed            ...
 2: 34    Private          216864 HS-grad   9             Divorced           ...
 3: 68    Federal-gov      422013 HS-grad   9             Divorced           ...
 4: 61    Private          29059  HS-grad   9             Divorced           ...
 5: 61    ?                135285 HS-grad   9             Married-civ-spouse ...
 6: 60    Self-emp-not-inc 205246 HS-grad   9             Never-married      ...
 7: 53    Private          149650 HS-grad   9             Never-married      ...
 8: 71    ?                100820 HS-grad   9             Married-civ-spouse ...
 9: 71    Private          110380 HS-grad   9             Married-civ-spouse ...
    ...   ...              ...    ...       ...           ...                ...
                                      ...

Not Showing: occupation , relationship , race , sex ,
capital.gain , capital.loss , hours.per.week , native.country ,
income


Average age: 38.58

Generate descriptive statistics:
[8x16] DataFrame

    column   age       workclass   fnlwgt         education    education.num ...
 0: mean     38.581647 -           189778.366512  -            10.080679     ...
 1: median   37.000000 -           178356.000000  -            10.000000     ...
 2: stddev   13.640433 -           105549.977697  -            2.572720      ...
 3: min      17.000000 ?           12285.000000   10th         1.000000      ...
 4: 25%      28.000000 -           117827.000000  -            9.000000      ...
 5: 50%      37.000000 -           178356.000000  -            10.000000     ...
 6: 75%      48.000000 -           237051.000000  -            12.000000     ...
 7: max      90.000000 Without-pay 1484705.000000 Some-college 16.000000     ...
                                ...

Not Showing: marital.status , occupation , relationship ,
race , sex , capital.gain , capital.loss ,
hours.per.week , native.country , income
Simple Data Visualization with Go
Python is quite compatible with Jupyter Notebook, so visualizing the graphs and charts is quite easy. You can also set up Go in the Jupyter Notebook, but it won't be as smooth as Python.
In this example, we are
- Loading the dataset
- Converting it into dataframe
- Extracting the `age` column
- Creating the plot object
- Adding text to the title and x and y labels
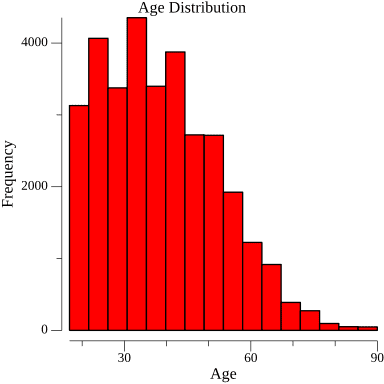
- Plotting the histogram of `age` columns
- Changing the fill color
- Saving the plot as a PNG file in the local directory
package main

import (
    "fmt"
    "image/color"
    "log"
    "os"
    "gonum.org/v1/plot"
    "gonum.org/v1/plot/plotter"
    "gonum.org/v1/plot/vg"
    "github.com/go-gota/gota/dataframe"
)

func main() {
    // Sample data: replace this CSV string with the path to your actual data file or another data source.
    f, err := os.Open("adult.csv")
    if err != nil {
        fmt.Println(err)
        return
    }
    defer f.Close()

    // Read the data into a DataFrame.
    df := dataframe.ReadCSV(f)

    // Extract the 'age' column and convert it to a slice of float64s for plotting.
    ages := df.Col("age").Float()

    // Create a new plot.
    p:= plot.New()

    p.Title.Text = "Age Distribution"
    p.X.Label.Text = "Age"
    p.Y.Label.Text = "Frequency"

    // Create a histogram of the 'age' column.
    h, err := plotter.NewHist(plotter.Values(ages), 16) // 16 bins.
    if err != nil {
        log.Fatal(err)
    }
    h.FillColor = color.RGBA{R: 255, A: 255}

    p.Add(h)

    // Save the plot to a PNG file.
    if err := p.Save(4*vg.Inch, 4*vg.Inch, "age_distribution.png"); err != nil {
        log.Fatal(err)
    }

    fmt.Println("Histogram saved as age_distribution.png")
}
Again, before running the code. We have to install the code dependencies.
$ go mod tidy
After running the code, we will generate the image file, which you can view by going into your project folder.
$ go run simple-viz.go
Histogram saved as age_distribution.png
Simple Model Training with Go
For training machine learning models, we will download and load Iris Species dataset from Kaggle.
We will be using `golearn` package similar to scikit-learn for:
- Loading the CSV dataset
- Building the KNN Classification model
- Splitting the dataset into training and testing
- Fitting the model
- Predicting the test dataset value and displaying them
- Calculating and printing confusion matrix, accuracy, recall, precision, and f1 score
package main

import (
    "fmt"

    "github.com/sjwhitworth/golearn/base"
    "github.com/sjwhitworth/golearn/evaluation"
    "github.com/sjwhitworth/golearn/knn"
)

func main() {
    // Load in a dataset, with headers. Header attributes will be stored.
    rawData, err := base.ParseCSVToInstances("iris.csv", true)
    if err != nil {
        panic(err)
    }

    //Initialises a new KNN classifier
    cls := knn.NewKnnClassifier("euclidean", "linear", 2)

    //Do a training-test split
    trainData, testData := base.InstancesTrainTestSplit(rawData, 0.50)
    cls.Fit(trainData)

    //Calculates the Euclidean distance and returns the most popular label
    predictions, err := cls.Predict(testData)
    if err != nil {
        panic(err)
    }
    fmt.Println(predictions)

    // Prints precision/recall metrics
    confusionMat, err := evaluation.GetConfusionMatrix(testData, predictions)
    if err != nil {
        panic(fmt.Sprintf("Unable to get confusion matrix: %s", err.Error()))
    }
    fmt.Println(evaluation.GetSummary(confusionMat))
}
Before running the code, make sure you have a G++ compiler by running the command:
gcc -v
If it is not installed then follow the guide Get Started with C++ and MinGW-w64 in Visual Studio Code.
Install the code dependency by running the tidy command in the terminal.
$ go mod tidy
Running the code will give you the predictions, confusion matrix, and model evaluation.
$ go run simple-ml.go

Instances with 68 row(s) 1 attribute(s)
Attributes:
*       CategoricalAttribute("Species", [Iris-setosa Iris-versicolor Iris-virginica])

Data:
        Iris-setosa
        Iris-setosa
        Iris-versicolor
        Iris-virginica
        Iris-virginica
        Iris-setosa
        Iris-virginica
        Iris-setosa
        Iris-setosa
        Iris-setosa
        Iris-virginica
        Iris-virginica
        Iris-setosa
        Iris-setosa
        Iris-versicolor
        Iris-versicolor
        Iris-setosa
        Iris-versicolor
        Iris-virginica
        Iris-setosa
        Iris-setosa
        Iris-virginica
        Iris-virginica
        Iris-virginica
        Iris-virginica
        Iris-versicolor
        Iris-virginica
        Iris-virginica
        Iris-virginica
        Iris-versicolor
        ...
38 row(s) undisplayed
Reference Class True Positives  False Positives True Negatives  Precision       Recall  F1 Score
--------------- --------------  --------------- --------------  ---------       ------  --------
Iris-setosa     24              0               44              1.0000          1.0000  1.0000
Iris-versicolor 22              0               43              1.0000          0.8800  0.9362
Iris-virginica  19              3               46              0.8636          1.0000  0.9268
Overall accuracy: 0.9559
If you are facing issues running the code, check out my code at GitHub: kingabzpro/go-example-kdn.
Conclusion
The data science packages in the Go language are not maintained well and do not have a large community of developers building tools for data scientists. But, the main advantage of the Go language is its speed and ease of use. There are many other benefits of using the Go language, which may convince people to switch their workflow to it.
In this beginner's tutorial, we have learned how to load a dataset as a dataframe, perform data analysis and visualization, and train a machine learning model.
Abid Ali Awan (@1abidaliawan) is a certified data scientist professional who loves building machine learning models. Currently, he is focusing on content creation and writing technical blogs on machine learning and data science technologies. Abid holds a Master's degree in technology management and a bachelor's degree in telecommunication engineering. His vision is to build an AI product using a graph neural network for students struggling with mental illness.