Job Trends in Data Analytics: NLP for Job Trend Analysis
Perform job trend analysis and check the results using NLP.
By Mahantesh Pattadkal & Andrea De Mauro
Data analytics has experienced remarkable growth in recent years, driven by advancements in how data is utilized in key decision-making processes. The collection, storage, and analysis of data have also progressed significantly due to these developments. Moreover, the demand for talent in data analytics has skyrocketed, turning the job market into a highly competitive arena for individuals possessing the necessary skills and experience.
The rapid expansion of data-driven technologies has correspondingly led to an increased demand for specialized roles, such as "data engineer." This surge in demand extends beyond data engineering alone and encompasses related positions like data scientist and data analyst.
Recognizing the significance of these professions, our series of blog posts aims to collect real-world data from online job postings and analyze it to understand the nature of the demand for these jobs, as well as the diverse skill sets required within each of these categories.
In this blog, we introduce a browser-based “Data Analytics Job Trends” application for the visualization and analysis of job trends in the data analytics market. After scraping data from online job agencies, it uses NLP techniques to identify key skill sets required in the job posts. Figure 1 shows a snapshot of the data app, exploring trends in the data analytics job market.
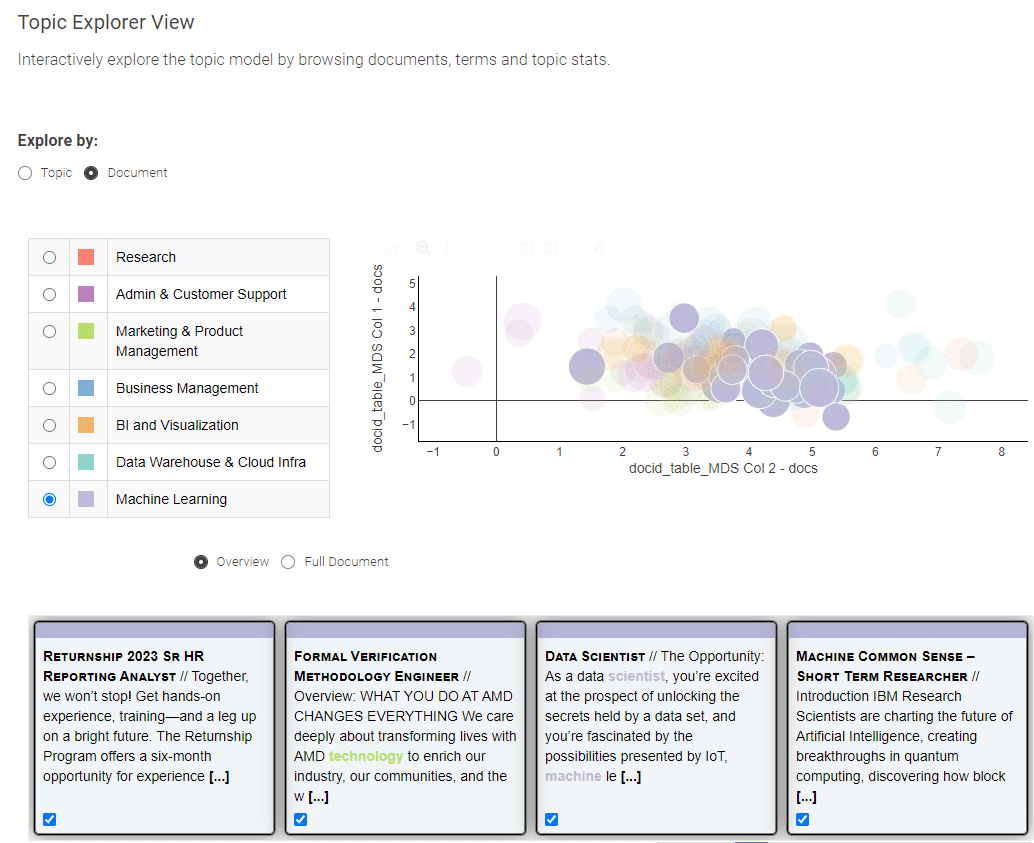
Figure 1: Snapshot of the KNIME Data App “Data Analytics Job Trends”
For the implementation, we adopted the low-code data science platform: KNIME Analytics Platform. This open-source and free platform for end-to-end data science is based on visual programming and offers an extensive range of functionalities, from pure ETL operations and a wide array of data source connectors for data blending through to machine learning algorithms, including deep learning.
The set of workflows underlying the application is available for free download from the KNIME Community Hub at “Data Analytics Job Trends”. A browser-based instance can be evaluated at “Data Analytics Job Trends”.
“Data Analytics Job Trends” Application
This application is generated by four workflows shown in Figure 2 to be executed sequentially for the following sequence of steps:
- Web scraping for data collection
- NLP parsing and data cleaning
- Topic modeling
- Analysis of attribution of job role - skills
The workflows are available on the KNIME Community Hub Public Space - Data Analytics Job Trends.

Figure 2: KNIME Community Hub Space - Data Analytics Job Trends contains a set of four workflows used for building the application “Data Analytics Job Trends”
- “01_Web Scraping for data collection” workflow crawls through the online job postings and extracts the textual information into a structured format
- “02_NLP Parsing and cleaning” workflow performs the necessary cleaning steps and then parses the long texts into smaller sentences
- “03_Topic Modeling and Exploration Data App” uses clean data to build a topic model and then to visualize its results within a data app
- “04_Job Skill Attribution” workflow evaluates the association of skills across job roles, like Data Scientist, Data Engineer, and Data Analyst, based on the LDA results.
Web scraping for data collection
In order to have an up-to-date understanding of the skills required in the job market, we opted for the analysis of web scraping job posts from online job agencies. Given the regional variations and the diversity of languages, we focused on job postings in the United States. This ensures that a significant proportion of the job postings are presented in the English language. We also focused on job postings from February 2023 to April 2023.
The KNIME workflow ”01_Web Scraping for Data Collection” in Figure 3 crawls through a list of URLs of searches on job agencies’ websites.
To extract the relevant job postings pertaining to Data Analytics, we used searches with six keywords that collectively cover the field of data analytics, namely: “big data”, “data science”, “business intelligence”, “data mining”, “machine learning” and “data analytics”. Search keywords are stored in an Excel file and read via the Excel Reader node.
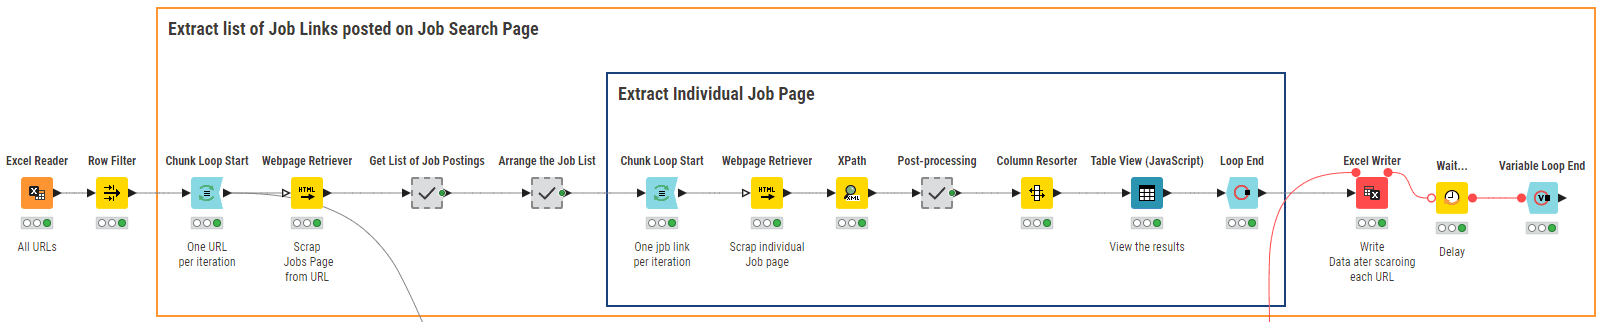
Figure 3: KNIME Workflow “01_Web Scraping for Data Collection” scraps job postings according to a number of search URLs
The core node of this workflow is the Webpage Retriever node. It is used twice. The first time (outer loop), the node crawls the site according to the keyword provided as input and produces the related list of URLs for job postings published in the US within the last 24 hours. The second time (inner loop), the node retrieves the text content from each job posting URL. The Xpath nodes following the Webpage Retriever nodes parse the extracted texts to reach the desired information, such as job title, required qualifications, job description, salary, and company ratings. Finally, the results are written to a local file for further analysis. Figure 4 shows a sample of the job postings scraped for February 2023.

Figure 4: Sample of the Web Scraping Results for February 2023
NLP parsing and data cleaning
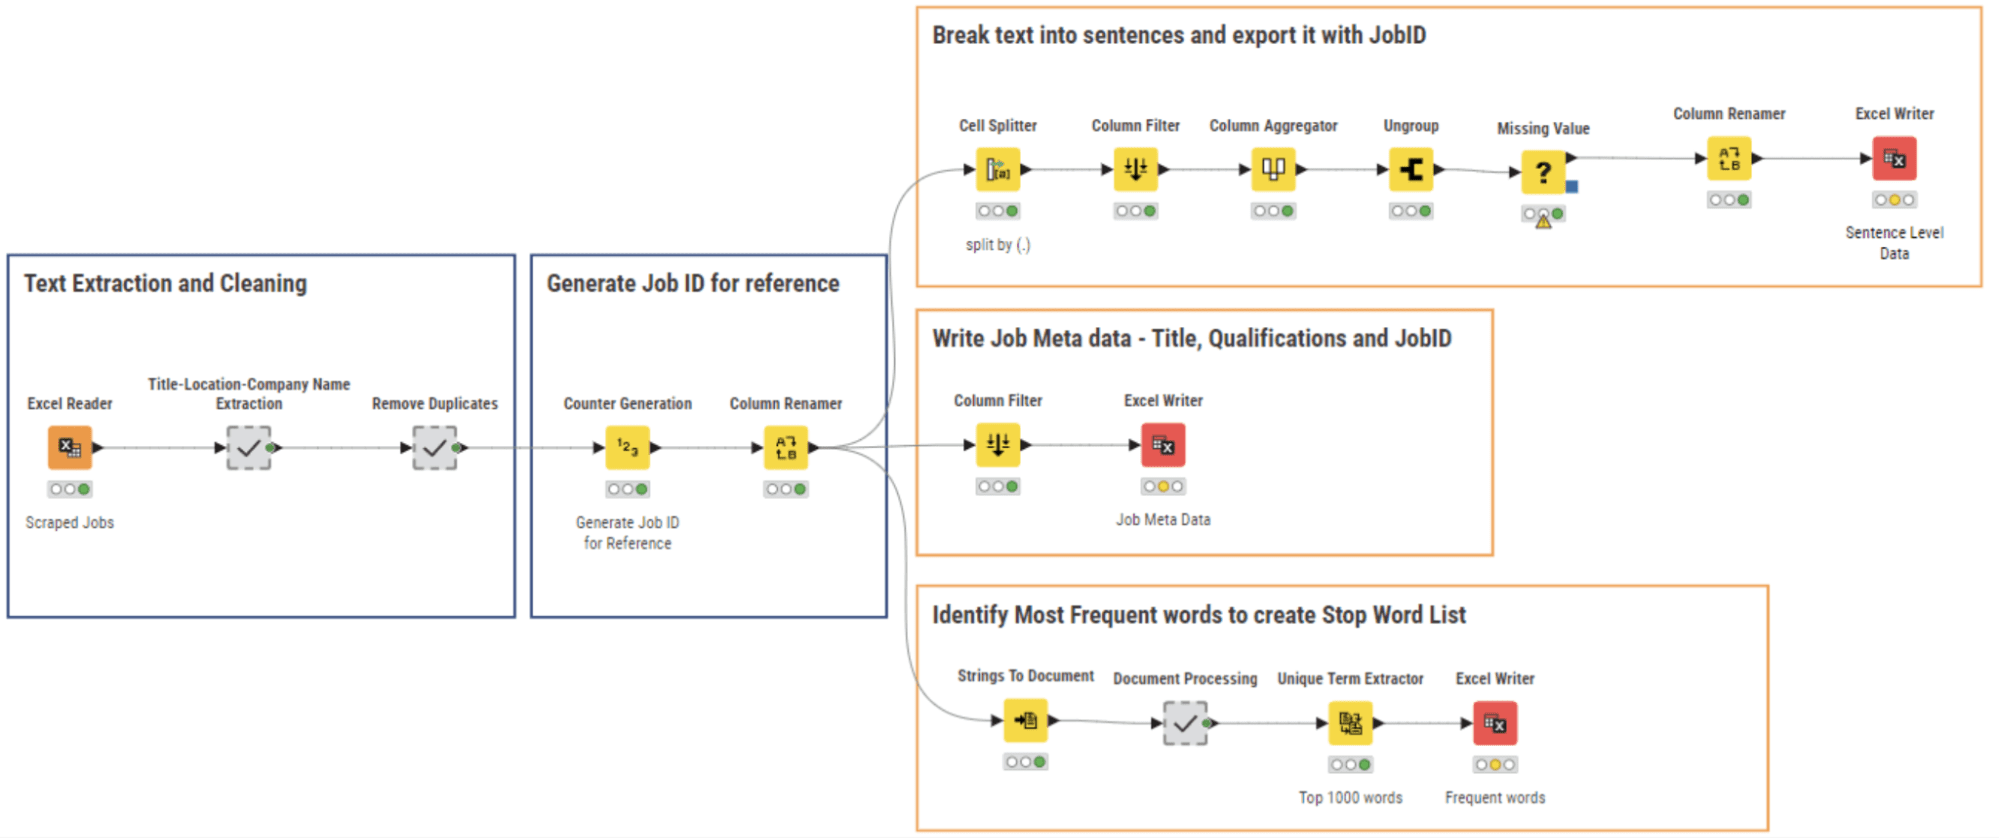
Figure 5: 02_NLP Parsing and cleaning Workflow for Text Extraction and Data Cleaning
Like all freshly collected data, our web scraping results needed some cleaning. We perform NLP parsing along with data cleaning and write the respective data files using the workflow 02_NLP Parsing and cleaning shown in Figure 5.
Multiple fields from the scraped data have been saved in the form of a concatenation of string values. Here, we extracted the individual sections using a series of String Manipulation nodes within the meta node ”Title-Location-Company Name Extraction” and then we removed unnecessary columns and got rid of duplicate rows.
We then assigned a unique ID to each job posting text and fragmented the whole document into sentences via the Cell Splitter node. The meta information for each job - title, location, and company - was also extracted and saved along with the Job ID.
The list of the most frequent 1000 words was extracted from all documents, so as to generate a stop-word list, including words like “applicant”, “collaboration”, “employment” etc … These words are present in every job posting and therefore do not add any information for the next NLP tasks.
The result of this cleaning phase is a set of three files:
- A table containing the documents’ sentences;
- A table containing the job description metadata;
- A table containing the stopword list.
Topic modeling and results exploration
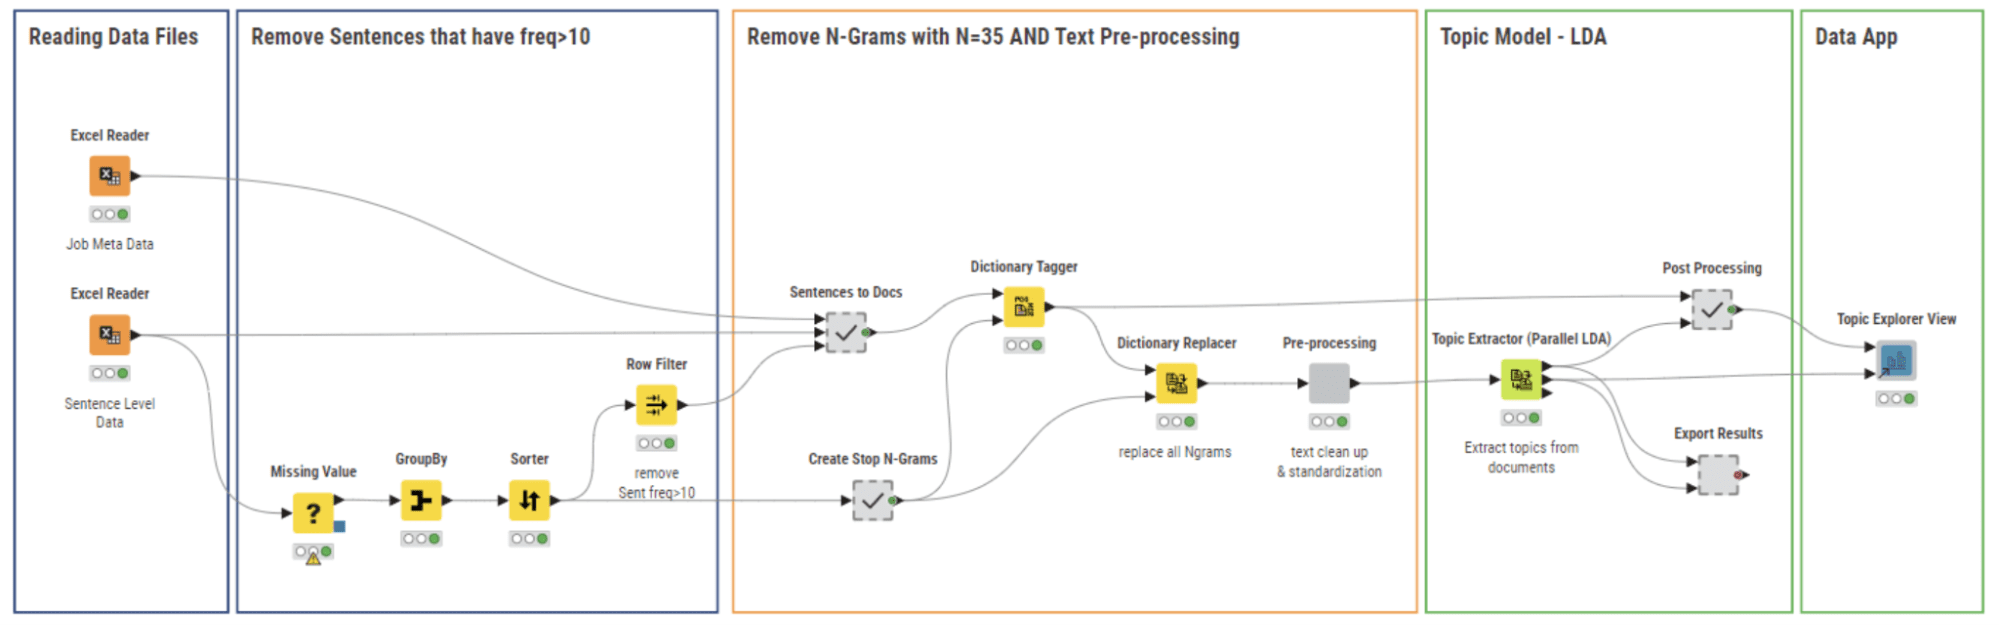
Figure 6: 03_Topic Modeling and Exploration Data App workflow builds a topic model and allows the user to explore the results visually with the Topic Explorer View Component
The workflow 03_Topic Modeling and Exploration Data App (Figure 6) uses the cleaned data files from the previous workflow. In this stage, we aim to:
- Detect and remove common sentences (Stop Phrases) appearing in many job postings
- Perform standard text processing steps to prepare the data for topic modeling
- Build the Topic Model and Visualize the Results.
We discuss the above tasks in detail in the following subsections.
3.1 Remove stop phrases with N-grams
Many job postings include sentences that are commonly found in company policies or general agreements, such as "Non-Discrimination policy" or "Non-Disclosure Agreements." Figure 7 provides an example where job postings 1 and 2 mention the "Non-Discrimination" policy. These sentences are not relevant to our analysis and therefore need to be removed from our text corpus. We refer to them as "Stop Phrases" and employ two methods to identify and filter them.
The first method is straightforward: we calculate the frequency of each sentence in our corpus and eliminate any sentences with a frequency greater than 10.
The second method involves an N-gram approach, where N can be in the range of values from 20 to 40. We select a value for N and assess the relevance of N-grams derived from the corpus by counting the number of N-grams that classify as stop phrases. We repeat this process for each value of N within the range. We chose N=35 as the best value for N to identify the highest number of Stop Phrases.
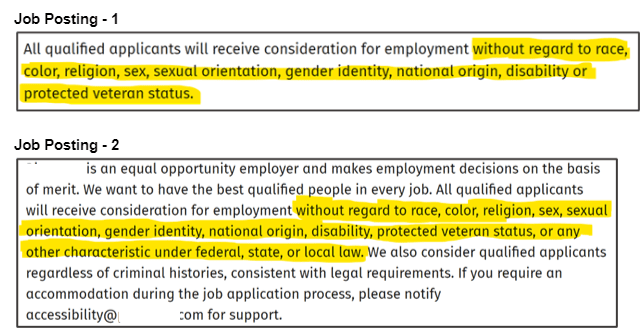
Figure 7: Example of Common Sentences in Job Postings that can be regarded as “Stop Phrases”
We used both methods to remove the “Stop Phrases” as shown by the workflow depicted in Figure 7. At first, we removed the most frequent sentences, then we created N-grams with N=35 and tagged them in every document with the Dictionary Tagger node, and, at last, we removed these N-grams using the Dictionary Replacer node.
3.2 Prepare data for topic modeling with text preprocessing techniques
After removing the Stop Phrases, we perform the standard text preprocessing in order to prepare the data for topic modeling.
First, we eliminate numeric and alphanumeric values from the corpus. Then, we remove punctuation marks and common English stop words. Additionally, we use the custom stop word list that we created earlier to filter out job domain-specific stop words. Finally, we convert all characters to lowercase.
We decided to focus on the words that carry significance, which is why we filtered the documents to carry only nouns and verbs. This can be done by assigning a Parts of Speech (POS) tag to each word in the document. We utilize the POS Tagger node to assign these tags and filter them based on their value, specifically keeping words with POS = Noun and POS = Verb.
Lastly, we apply Stanford lemmatization to ensure the corpus is ready for topic modeling. All of these preprocessing steps are carried out by the "Pre-processing" component shown in Figure 6.
3.3 Build topic model and visualize it
In the final stage of our implementation, we applied the Latent Dirichlet Allocation (LDA) algorithm to construct a topic model using the Topic Extractor (Parallel LDA) node shown in Figure 6. The LDA algorithm produces a number of topics (k), each topic described through a (m) number of keywords. Parameters (k,m) must be defined.
As a side note, k and m cannot be too large, since we want to visualize and interpret the topics (skill sets) by reviewing the keywords (skills) and their respective weights. We explored a range [1, 10] for k and fixed the value of m=15. After careful analysis, we found that k=7 led to the most diverse and distinct topics with a minimum overlap in keywords. Thus, we determined k=7 to be the optimal value for our analysis.
Explore Topic Modeling Results with an Interactive Data App
To enable everyone to access the topic modeling results and have their own go at it, we deployed the workflow (in Figure 6) as a Data App on KNIME Business Hub and made it public, for everyone to access it. You can check it out at: Data Analytics Job Trends.
The visual part of this data app comes from the Topic Explorer View component by Francesco Tuscolano and Paolo Tamagnini, available for free download from the KNIME Community Hub, and provides a number of interactive visualizations of topics by topic and document.
Figure 8: Data Analytics Job Trends for exploration of the topic modeling results
Presented in Figure 8, this Data App offers you a choice between two distinct views: the “Topic” and the “Document” view.
The “Topic” view employs a Multi-Dimensional Scaling algorithm to portray topics on a 2-dimensional plot, effectively illustrating the semantic relationships between them. On the left panel, you can conveniently select a topic of interest, prompting the display of its corresponding top keywords.
To venture into the exploration of individual job postings, simply opt for the “Document” view. The “Document” view presents a condensed portrayal of all documents across two dimensions. Utilize the box selection method to pinpoint documents of significance, and at the bottom, an overview of your selected documents awaits
Exploring Data Analytics job market using NLP
We have provided here a summary of the “Data Analytics Job Trends” application, that was implemented and used to explore the most recent skill requirements and job roles in the data science job market. For this blog, we restricted our area of action to job descriptions for the US, written in English, from February to April 2023.
To understand the job trends and provide a review, the “Data Analytics Job Trends” crawls job agency sites, extracts text from online job postings, extracts topics and keywords after performing a series of NLP tasks, and finally visualizes the results by topic and by document to discern the patterns in the data.
The application consists of a set of four KNIME workflows to run sequentially for web scraping, data processing, topic modeling, and then interactive visualizations to allow the user to spot the job trends.
We deployed the workflow on KNIME Business Hub and made it public, so everyone can access it. You can check it out at: Data Analytics Job Trends.
The full set of workflows is available and free to download from KNIME Community Hub at Data Analytics Job Trends. The workflows can easily be changed and adapted to discover trends in other fields of the job market. It is enough to change the list of search keywords in the Excel file, the website, and the time range for the search.
What about the results? Which are the skills and the professional roles most sought after in today’s data science job market? In our next blog post, we will guide you through the exploration of the outcomes of this topic modeling. Together, we'll closely examine the intriguing interplay between job roles and skills, gaining valuable insights about the data science job market along the way. Stay tuned for an enlightening exploration!
Resources
- A Systematic Review of Data Analytics Job Requirements and Online Courses by A. Mauro et al.
Mahantesh Pattadkal brings more than 6 years of experience in consulting on data science projects and products. With a Master's Degree in Data Science, his expertise shines in Deep Learning, Natural Language Processing, and Explainable Machine Learning. Additionally, he actively engages with the KNIME Community for collaboration on data science-based projects.
Andrea De Mauro has over 15 years of experience building business analytics and data science teams at multinational companies such as P&G and Vodafone. Apart from his corporate role, he enjoys teaching Marketing Analytics and Applied Machine Learning at several universities in Italy and Switzerland. Through his research and writing, he has explored the business and societal impact of Data and AI, convinced that a broader analytics literacy will make the world better. His latest book is 'Data Analytics Made Easy', published by Packt. He appeared in CDO magazine's 2022 global 'Forty Under 40' list.