Road Lane Line Detection using Computer Vision models
A tutorial on how to implement a computer vision data pipeline for road lane detection used by self-driving cars.
By Vijay Ramakrishnan.
Detecting lane lines is a fundamental task for autonomous vehicles while driving on the road. It is the building block to other path planning and control actions like breaking and steering. Lets get started implementing them!

Fig 1. Final output of this project
Note: This project was derived from Udacity blog. All media generated used custom CV configurations explained in this article.
Step 0: Introduction
Before we work with videos, lets work with static images since it is much easier to debug with. Here is the image we will be working with.

Fig. Input image
I am running python 3 with the following imports in a jupyter notebook:
---------------------------------------------------------------------------
#importing some useful packages
import matplotlib.pyplot as plt
import matplotlib.image as mpimg
import numpy as np
import cv2
import math
import sys
%matplotlib inline
---------------------------------------------------------------------------
The lane detection pipeline follows these steps:
- Pre-process image using grayscale and gaussian blur
- Apply canny edge detection to the image
- Apply masking region to the image
- Apply Hough transform to the image
- Extrapolate the lines found in the hough transform to construct the left and right lane lines
- Add the extrapolated lines to the input image
Step 1: Pre-processing of image
We grayscale the input image which is needed for canny edge detection.
---------------------------------------------------------------------------
def grayscale(img):
    """Applies the Grayscale transform
    This will return an image with only one color channel
    but NOTE: to see the returned image as grayscale
    you should call plt.imshow(gray, cmap='gray')"""
    return cv2.cvtColor(img, cv2.COLOR_BGR2GRAY)

image = mpimg.imread('test_images/solidYellowCurve2.jpg')
# grayscale the image
grayscaled = grayscale(image)
plt.imshow(grayscaled, cmap='gray')
---------------------------------------------------------------------------
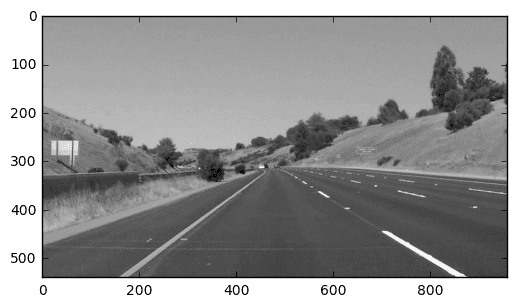
Fig. Gray-scaled image
We then apply a gaussian smoothing function to the image. Again, this is needed for the canny edge detection to average out anomalous gradients in the image.
---------------------------------------------------------------------------
def gaussian_blur(img, kernel_size):
    """Applies a Gaussian Noise kernel"""
    return cv2.GaussianBlur(img, (kernel_size, kernel_size), 0)

# apply gaussian blur
kernelSize = 5
gaussianBlur = gaussian_blur(grayscaled, kernelSize)
---------------------------------------------------------------------------
Step 2: Canny Edge Detection
We need to detect edges for lane detection since the contrast between the lane and the surrounding road surface provides us with useful information on detecting the lane lines.
Canny edge detection is an operator that uses the horizontal and vertical gradients of the pixel values of an image to detect edges. A more deeper understanding of the algorithm can be found here.
---------------------------------------------------------------------------
def canny(img, low_threshold, high_threshold):
    """Applies the Canny transform"""
    return cv2.Canny(img, low_threshold, high_threshold)

# canny
minThreshold = 100
maxThreshold = 200
edgeDetectedImage = canny(gaussianBlur, minThreshold, maxThreshold)
---------------------------------------------------------------------------
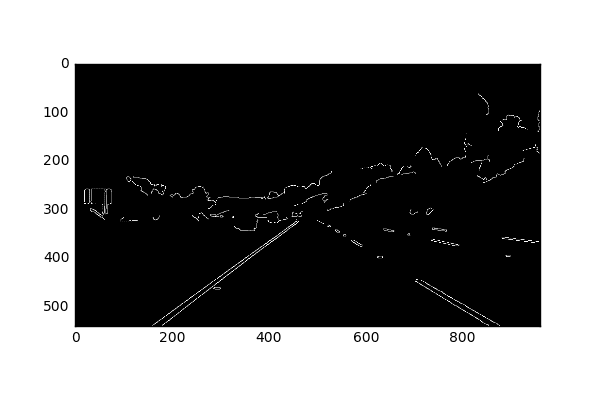
Notice the edge detector captures all the lane lines, along with surrounding edges like trees
Step 3: Mask out points that are not in the region of interest
The region of interest for the car’s camera is only the two lanes immediately in it’s field of view and not anything extraneous. We can filter out the extraneous pixels by making a polygon region of interest and removing all other pixels that are not in the polygon.
---------------------------------------------------------------------------
def region_of_interest(img, vertices):
    """
    Applies an image mask.

    Only keeps the region of the image defined by the polygon
    formed from `vertices`. The rest of the image is set to black.
    """
    #defining a blank mask to start with
    mask = np.zeros_like(img)

    #defining a 3 channel or 1 channel color to fill the mask with
    #depending on the input image
    if len(img.shape) > 2:
        channel_count = img.shape[2]  # i.e. 3 or 4 depending on your image
        ignore_mask_color = (255,) * channel_count
    else:
        ignore_mask_color = 255

    #filling pixels inside the polygon defined by "vertices" with the fill color
    cv2.fillPoly(mask, vertices, ignore_mask_color)

    #returning the image only where mask pixels are nonzero
    masked_image = cv2.bitwise_and(img, mask)
    return masked_image

#apply mask
lowerLeftPoint = [130, 540]
upperLeftPoint = [410, 350]
upperRightPoint = [570, 350]
lowerRightPoint = [915, 540]

pts = np.array([[lowerLeftPoint, upperLeftPoint, upperRightPoint,
lowerRightPoint]], dtype=np.int32)
masked_image = region_of_interest(edgeDetectedImage, pts)
---------------------------------------------------------------------------
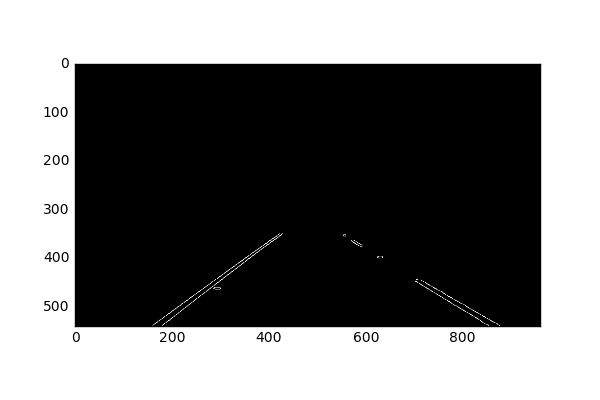
Fig. Removed all pixels not in the region of interest
Step 4: Hough Transform
Now that we have detected edges in the region of interest, we want to identify lines which indicate lane lines. This is where the hough transform comes in handy.
The Hough transformation converts a “x vs. y” line to a point in “gradient vs. intercept” space. Points in the image will correspond to lines in hough space. An intersection of lines in hough space will thus correspond to a line in Cartesian space. Using this technique, we can find lines from the pixel outputs of the canny edge detection output. A detailed explanation of the Hough transformation can be found here.
---------------------------------------------------------------------------
def hough_lines(img, rho, theta, threshold, min_line_len, max_line_gap):
    """
    `img` should be the output of a Canny transform.

    Returns an image with hough lines drawn.
    """
    lines = cv2.HoughLinesP(img, rho, theta, threshold, np.array([]),
              minLineLength=min_line_len, maxLineGap=max_line_gap)
    line_img = np.zeros((*img.shape, 3), dtype=np.uint8)

    draw_lines(line_img, lines)
    return line_img

def draw_lines(img, lines, color=[255, 0, 0], thickness=2):
    """
    This function draws `lines` with `color` and `thickness`.
    """
    for line in lines:
        for x1,y1,x2,y2 in line:
            cv2.line(img, (x1, y1), (x2, y2), color, thickness)


#hough lines
rho = 1
theta = np.pi/180
threshold = 30
min_line_len = 20
max_line_gap = 20

houged = hough_lines(masked_image, rho, theta,
                  threshold, min_line_len, max_line_gap)
---------------------------------------------------------------------------