10 Essential Pandas Functions Every Data Scientist Should Know
This article contains ten Pandas functions that are important as well as handy for every data scientist.

Image by Author
In today's data-driven world, data analysis and insights help you get the most out of it and help you make better decisions. From a company's perspective, it gives a Competitive Advantage and personaliz?s the whole process.
This tutorial will explore the most potent Python library pandas, and we will discuss the most important functions of this library that are important for data analysis. Beginners can also follow this tutorial due to its simplicity and efficiency. If you don’t have python installed in your system, you can use Google Colaboratory.
Importing Data
You can download the dataset from that link.
import pandas as pd
df = pd.read_csv("kaggle_sales_data.csv", encoding="Latin-1") # Load the data
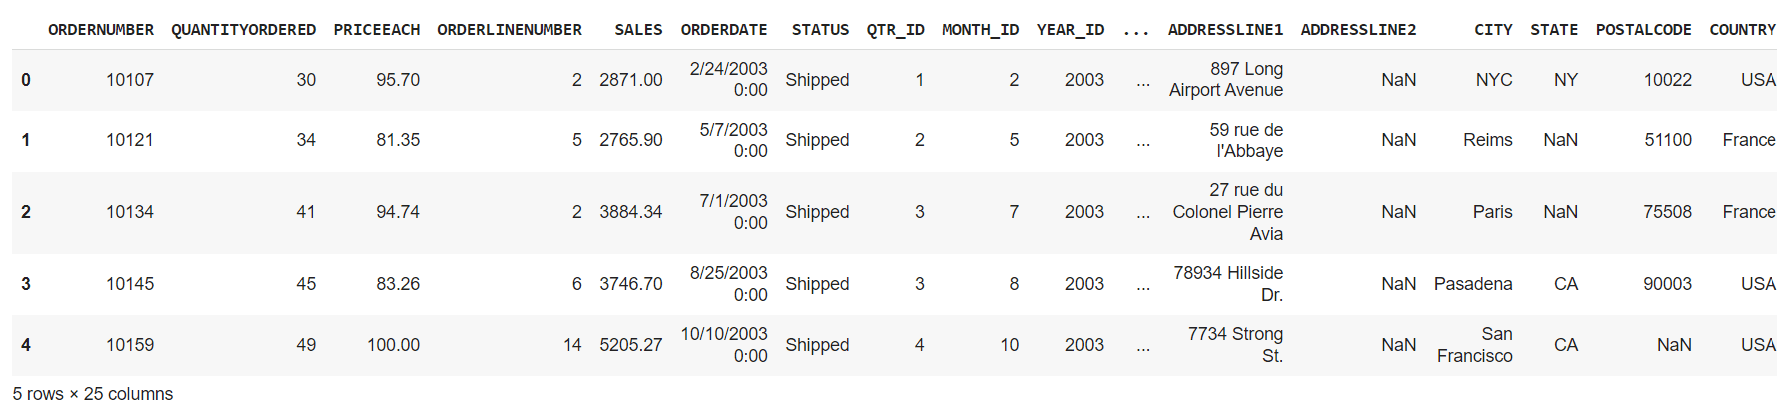
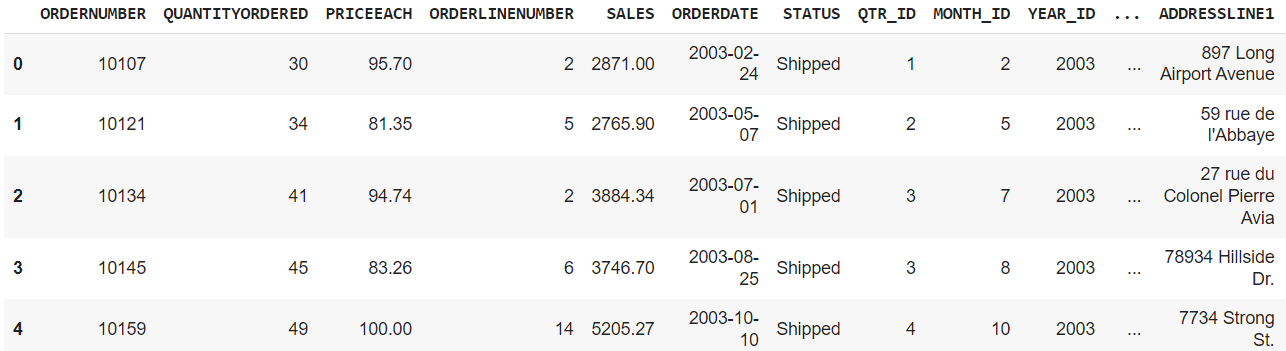
df.head() # Show first five rows
Output:
Data Exploration
In this section, we will discuss various functions that help you to get more about your data. Like viewing it or getting the mean, average, min/max, or getting information about the dataframe.
1. Data Viewing
-
df.head(): It displays the first five rows of the sample data
-
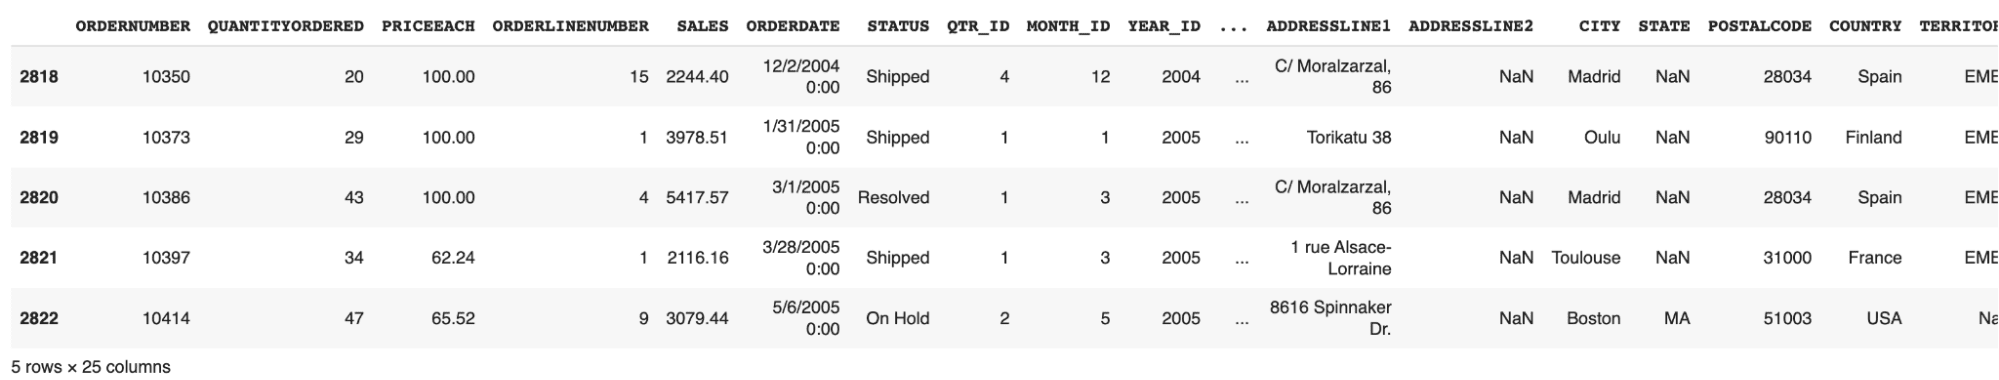
df.tail(): It displays the last five rows of the sample data
-
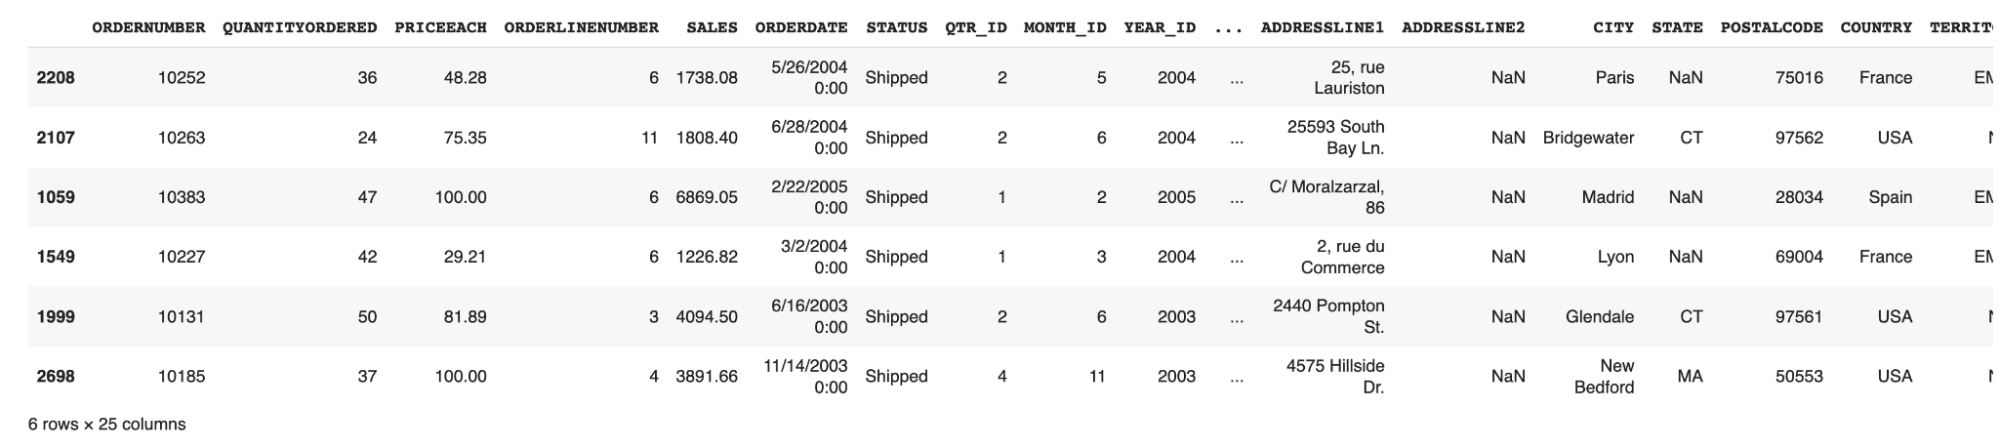
df.sample(n): It displays the random n number of rows in the sample data
df.sample(6)
-
df.shape: It displays the sample data's rows and columns (dimensions).
(2823, 25)
It signifies that our dataset has 2823 rows, each containing 25 columns.
2. Statistics
This section contains the functions that help you perform statistics like average, min/max, and quartiles on your data.
-
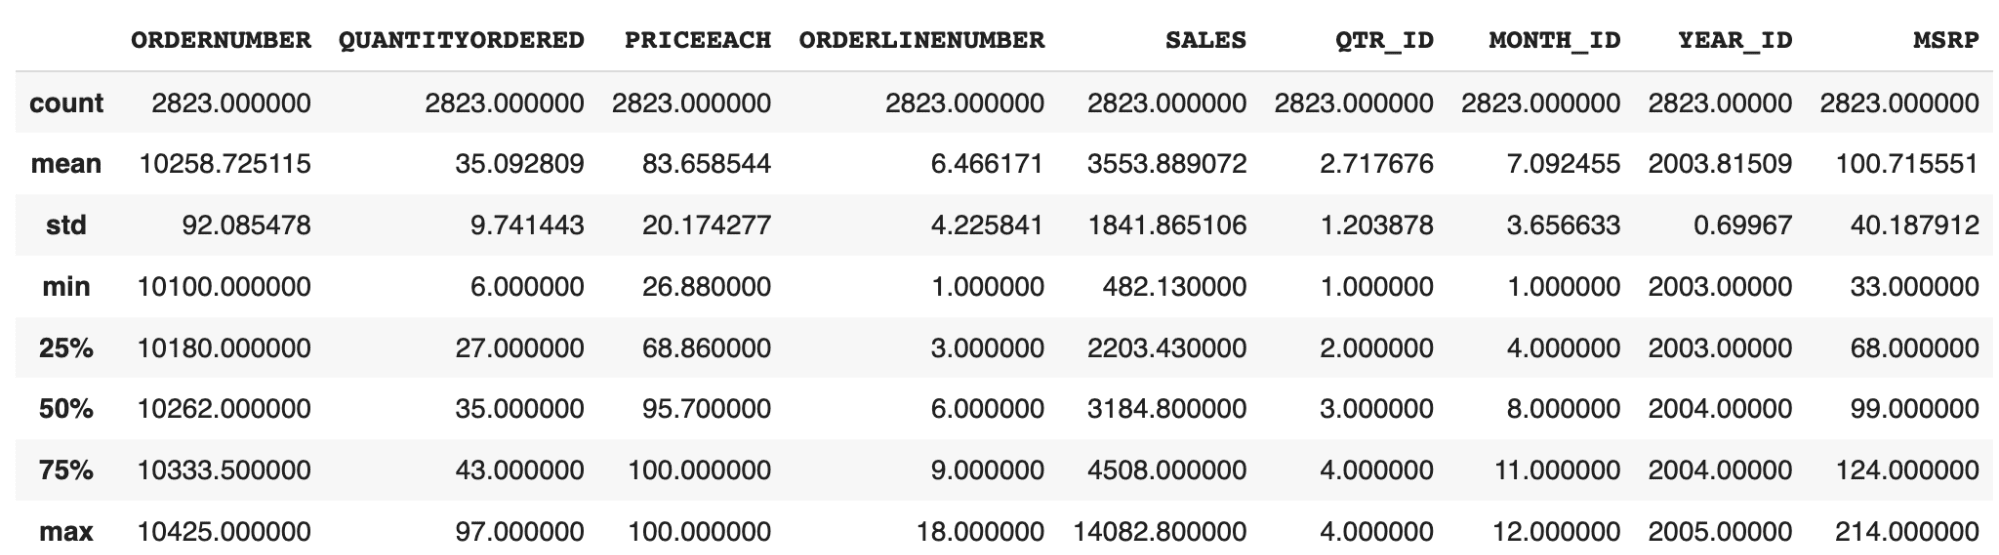
df.describe(): Get the basic statistics of each column of the sample data
-
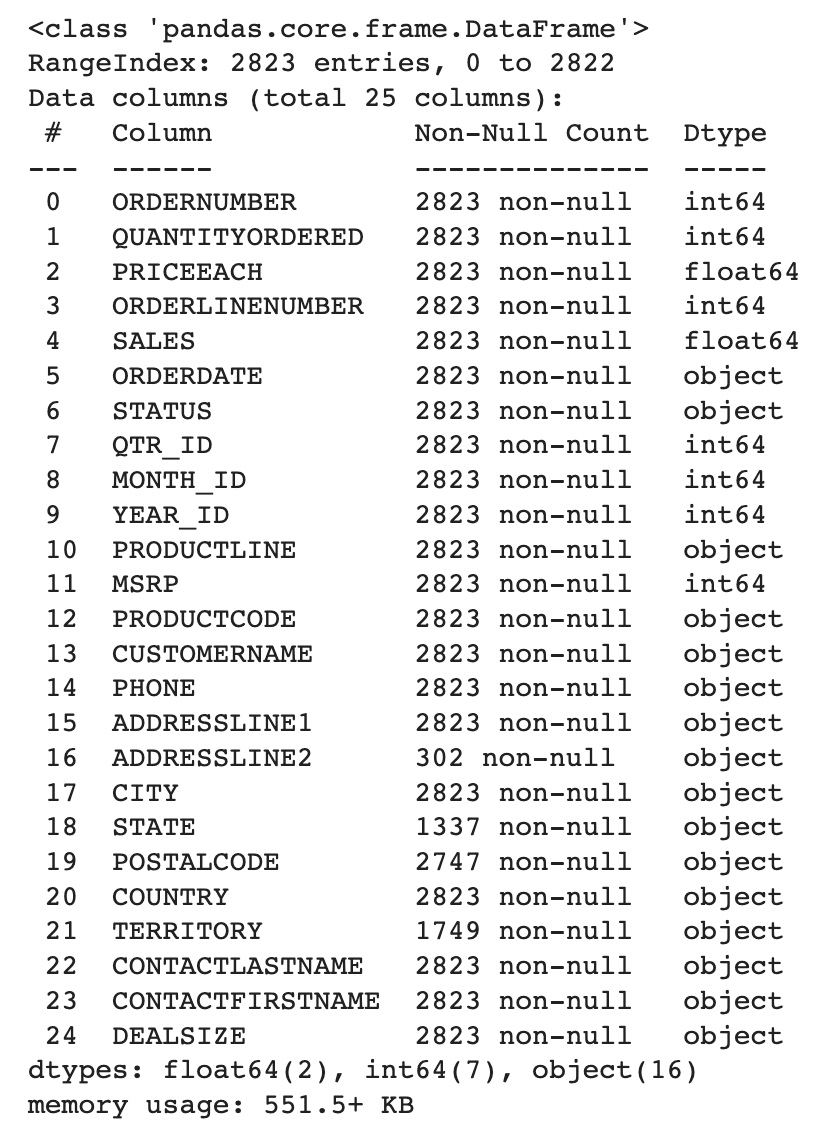
df.info(): Get the information about the various data types used and the non-null count of each column.

-
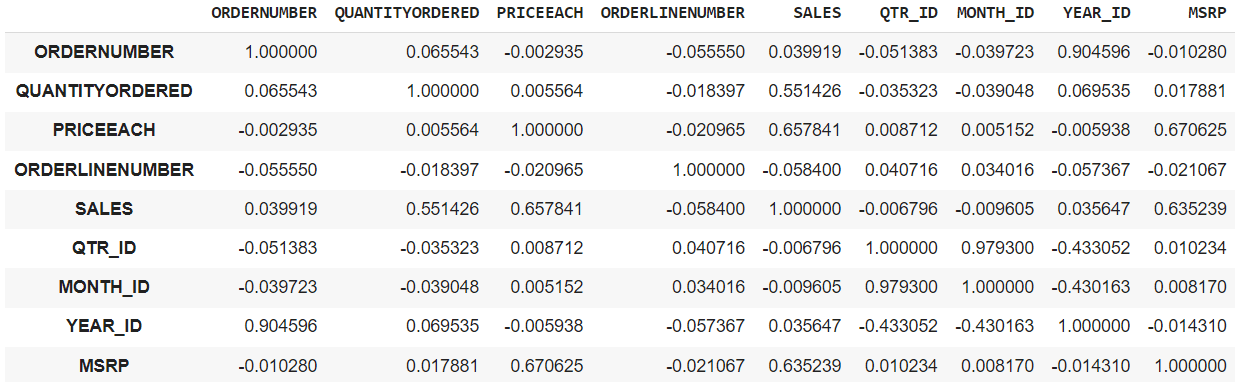
df.corr(): This can give you the correlation matrix between all the integer columns in the data frame.
-
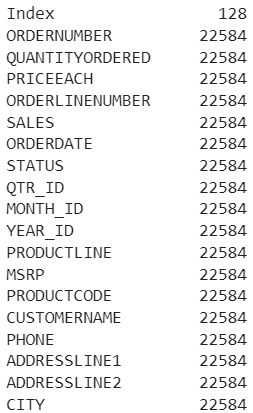
df.memory_usage(): It will tell you how much memory is being consumed by each column.
3. Data Selection
You can also select the data of any specific row, column, or even multiple columns.
-
df.iloc[row_num]: It will select a particular row based on its index
For ex-,
df.iloc[0]
-
df[col_name]: It will select the particular column
For ex-,
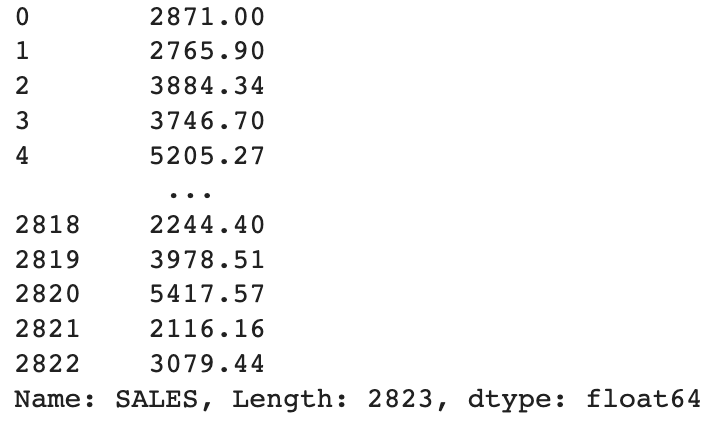
df["SALES"]
Output:
-
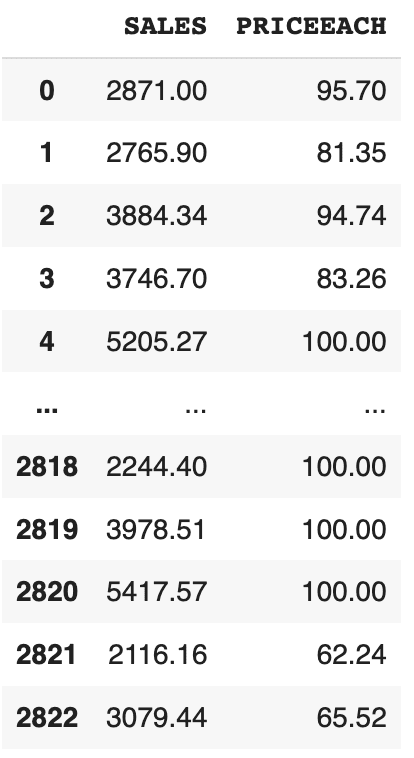
df[[‘col1’, ‘col2’]]: It will select multiple columns given
For ex-,
df[["SALES", "PRICEEACH"]]
Output:
4. Data Cleaning
These functions are used to handle the missing data. Some rows in the data contain some null and garbage values, which can hamper the performance of our trained model. So, it is always better to correct or remove these missing values.
-
df.isnull(): This will identify the missing values in your dataframe. -
df.dropna(): This will remove the rows containing missing values in any column. -
df.fillna(val): This will fill the missing values withvalgiven in the argument. -
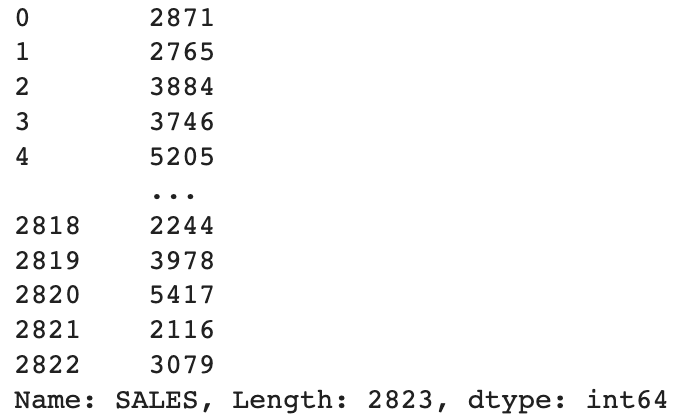
df[‘col’].astype(new_data_type): It can convert the data type of the selected columns to a different data type.
For ex-,
df["SALES"].astype(int)
We are converting the data type of the SALES column from float to int.
5. Data Analysis
Here, we will use some helpful functions in data analysis, like grouping, sorting, and filtering.
- Aggregation Functions:
You can group a column by its name and then apply some aggregation functions like sum, min/max, mean, etc.
df.groupby("col_name_1").agg({"col_name_2": "sum"})
For ex-,
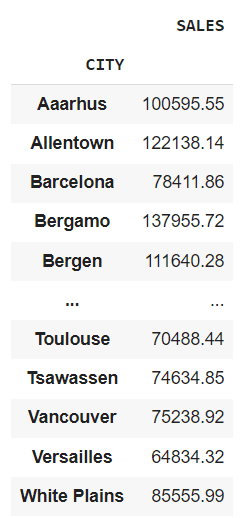
df.groupby("CITY").agg({"SALES": "sum"})
It will give you the total sales of each city.
If you want to apply multiple aggregations at a single time, you can write them like that.
For ex-,
aggregation = df.agg({"SALES": "sum", "QUANTITYORDERED": "mean"})
Output:
SALES              1.003263e+07

QUANTITYORDERED    3.509281e+01

dtype: float64
- Filtering Data:
We can filter the data in rows based on a specific value or a condition.
For ex-,
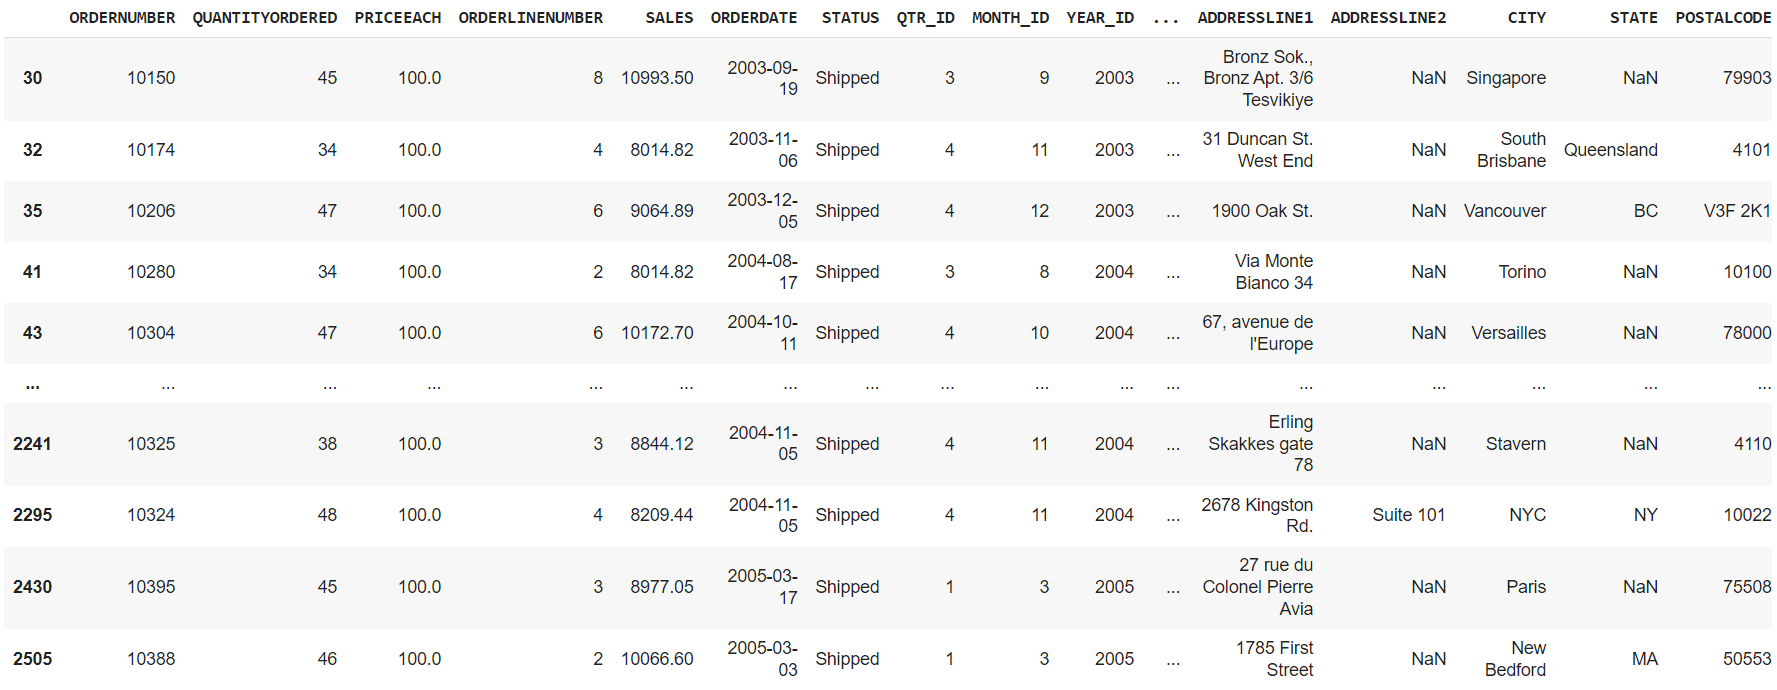
df[df["SALES"] > 5000]
Displays the rows where the value of sales is greater than 5000
You can also filter the dataframe using the query() function. It will also generate a similar output as above.
For ex,
df.query("SALES" > 5000)
- Sorting Data:
You can sort the data based on a specific column, either in the ascending order or in the descending order.
For ex-,
df.sort_values("SALES", ascending=False) # Sorts the data in descending order
- Pivot Tables:
We can create pivot tables that summarize the data using specific columns. This is very useful in analyzing the data when you only want to consider the effect of particular columns.
For ex-,
pd.pivot_table(df, values="SALES", index="CITY", columns="YEAR_ID", aggfunc="sum")
Let me break this for you.
-
values: It contains the column for which you want to populate the table's cells. -
index: The column used in it will become the row index of the pivot table, and each unique category of this column will become a row in the pivot table. -
columns: It contains the headers of the pivot table, and each unique element will become the column in the pivot table. -
aggfunc: This is the same aggregator function we discussed earlier.
Output:
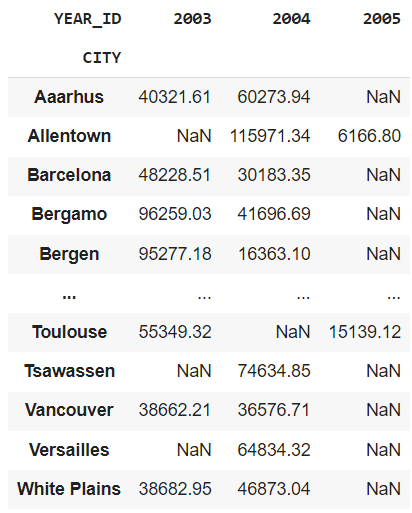
This output shows a chart which depicts the total sales in a particular city for a specific year.
6. Combining Data Frames
We can combine and merge several data frames either horizontally or vertically. It will concatenate two data frames and return a single merged data frame.
For ex-,
combined_df = pd.concat([df1, df2])
You can merge two data frames based on a common column. It is useful when you want to combine two data frames that share a common identifier.
For ex,
merged_df = pd.merge(df1, df2, on="common_col")
7. Applying Custom Functions
You can apply custom functions according to your needs in either a row or a column.
For ex-,
def cus_fun(x):
    return x * 3

df["Sales_Tripled"] = df["SALES"].apply(cus_fun, axis=0)
We have written a custom function that will triple the sales value for each row. axis=0 means that we want to apply the custom function on a column, and axis=1 implies that we want to apply the function on a row.
In the earlier method you have to write a separate function and then to call it from the apply() method. Lambda function helps you to use the custom function inside the apply() method itself. Let’s see how we can do that.
df["Sales_Tripled"] = df["SALES"].apply(lambda x: x * 3)
Applymap:
We can also apply a custom function to every element of the dataframe in a single line of code. But a point to remember is that it is applicable to all the elements in the dataframe.
For ex-,
df = df.applymap(lambda x: str(x))
It will convert the data type to a string of all the elements in the dataframe.
8. Time Series Analysis
In mathematics, time series analysis means analyzing the data collected over a specific time interval, and pandas have functions to perform this type of analysis.
Conversion to DateTime Object Model:
We can convert the date column into a datetime format for easier data manipulation.
For ex-,
df["ORDERDATE"] = pd.to_datetime(df["ORDERDATE"])
Output:
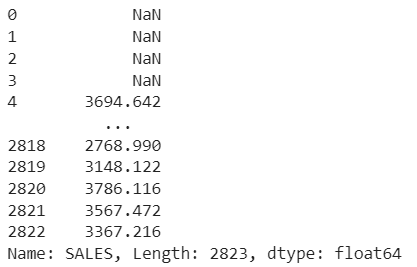
Calculate Rolling Average:
Using this method, we can create a rolling window to view data. We can specify a rolling window of any size. If the window size is 5, then it means a 5-day data window at that time. It can help you remove fluctuations in your data and help identify patterns over time.
For ex-
rolling_avg = df["SALES"].rolling(window=5).mean()
Output:
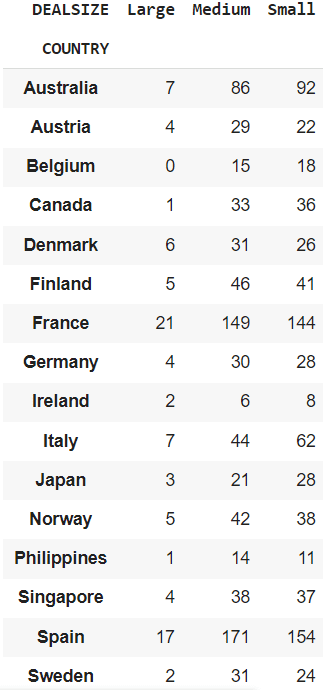
9. Cross Tabulation
We can perform cross-tabulation between two columns of a table. It is generally a frequency table that shows the frequency of occurrences of various categories. It can help you to understand the distribution of categories across different regions.
For ex-,
Getting a cross-tabulation between the COUNTRY and DEALSIZE.
cross_tab = pd.crosstab(df["COUNTRY"], df["DEALSIZE"])
It can show you the order size (‘DEALSIZE’) ordered by different countries.
10. Handling Outliers
Outliers in data means that a particular point goes far beyond the average range. Let’s understand it through an example. Suppose you have 5 points, say 3, 5, 6, 46, 8. Then we can clearly say that the number 46 is an outlier because it is far beyond the average of the rest of the points. These outliers can lead to wrong statistics and should be removed from the dataset.
Here pandas come to the rescue to find these potential outliers. We can use a method called Interquartile Range(IQR), which is a common method for finding and handling these outliers. You can also read about this method if you want information on it. You can read more about them here.
Let’s see how we can do that using pandas.
Q1 = df["SALES"].quantile(0.25)
Q3 = df["SALES"].quantile(0.75)
IQR = Q3 - Q1
lower_bound = Q1 - 1.5 * IQR
upper_bound = Q3 + 1.5 * IQR

outliers = df[(df["SALES"] < lower_bound) | (df["SALES"] > upper_bound)]
Q1 is the first quartile representing the 25th percentile of the data and Q3 is the third quartile representing the 75th percentile of the data.
lower_bound variable stores the lower bound that is used for finding potential outliers. Its value is set to 1.5 times the IQR below Q1. Similarly, upper_bound calculates the upper bound, 1.5 times the IQR above Q3.
After which, you filter out the outliers that are less than the lower or greater than the upper bound.
Wrapping it Up
Python pandas library enables us to perform advanced data analysis and manipulations. These are only a few of them. You can find some more tools in this pandas documentation. One important thing to remember is that the selection of techniques can be specific which caters to your needs and the dataset you are using.
Aryan Garg is a B.Tech. Electrical Engineering student, currently in the final year of his undergrad. His interest lies in the field of Web Development and Machine Learning. He have pursued this interest and am eager to work more in these directions.