Association Rules and the Apriori Algorithm: A Tutorial
A great and clearly-presented tutorial on the concepts of association rules and the Apriori algorithm, and their roles in market basket analysis.
The Problem
When we go grocery shopping, we often have a standard list of things to buy. Each shopper has a distinctive list, depending on one’s needs and preferences. A housewife might buy healthy ingredients for a family dinner, while a bachelor might buy beer and chips. Understanding these buying patterns can help to increase sales in several ways. If there is a pair of items, X and Y, that are frequently bought together:
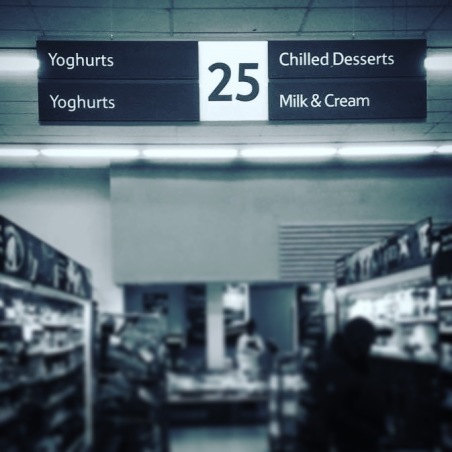
Product placement in Tesco, UK.
- Both X and Y can be placed on the same shelf, so that buyers of one item would be prompted to buy the other.
- Promotional discounts could be applied to just one out of the two items.
- Advertisements on X could be targeted at buyers who purchase Y.
- X and Y could be combined into a new product, such as having Y in flavors of X.
While we may know that certain items are frequently bought together, the question is, how do we uncover these associations?
Besides increasing sales profits, association rules can also be used in other fields. In medical diagnosis for instance, understanding which symptoms tend to co-morbid can help to improve patient care and medicine prescription.
Definition
Association rules analysis is a technique to uncover how items are associated to each other. There are three common ways to measure association.
Measure 1: Support. This says how popular an itemset is, as measured by the proportion of transactions in which an itemset appears. In Table 1 below, the support of {apple} is 4 out of 8, or 50%. Itemsets can also contain multiple items. For instance, the support of {apple, beer, rice} is 2 out of 8, or 25%.
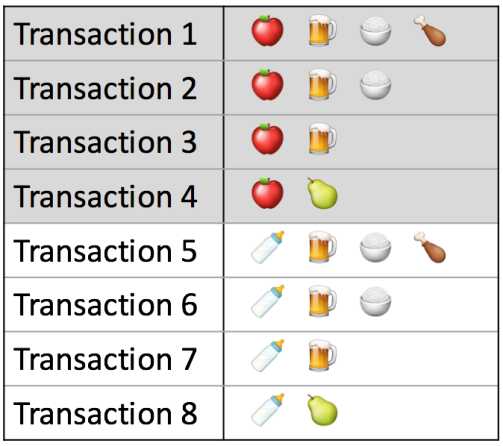
Table 1. Example Transactions
If you discover that sales of items beyond a certain proportion tend to have a significant impact on your profits, you might consider using that proportion as your support threshold. You may then identify itemsets with support values above this threshold as significant itemsets.
Measure 2: Confidence. This says how likely item Y is purchased when item X is purchased, expressed as {X -> Y}. This is measured by the proportion of transactions with item X, in which item Y also appears. In Table 1, the confidence of {apple -> beer} is 3 out of 4, or 75%.

One drawback of the confidence measure is that it might misrepresent the importance of an association. This is because it only accounts for how popular apples are, but not beers. If beers are also very popular in general, there will be a higher chance that a transaction containing apples will also contain beers, thus inflating the confidence measure. To account for the base popularity of both constituent items, we use a third measure called lift.
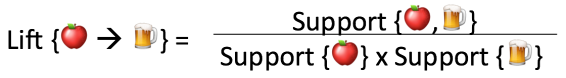
Measure 3: Lift. This says how likely item Y is purchased when item X is purchased, while controlling for how popular item Y is. In Table 1, the lift of {apple -> beer} is 1,which implies no association between items. A lift value greater than 1 means that item Y is likely to be bought if item X is bought, while a value less than 1 means that item Y is unlikely to be bought if item X is bought.
An Illustration
We use a dataset on grocery transactions from the arules R library. It contains actual transactions at a grocery outlet over 30 days. The network graph below shows associations between selected items. Larger circles imply higher support, while red circles imply higher lift:

Associations between selected items. Visualized using the arulesViz R library.
Several purchase patterns can be observed. For example:
- The most popular transaction was of pip and tropical fruits
- Another popular transaction was of onions and other vegetables
- If someone buys meat spreads, he is likely to have bought yogurt as well
- Relatively many people buy sausage along with sliced cheese
- If someone buys tea, he is likely to have bought fruit as well, possibly inspiring the production of fruit-flavored tea
Recall that one drawback of the confidence measure is that it tends to misrepresent the importance of an association. To demonstrate this, we go back to the main dataset to pick 3 association rules containing beer:
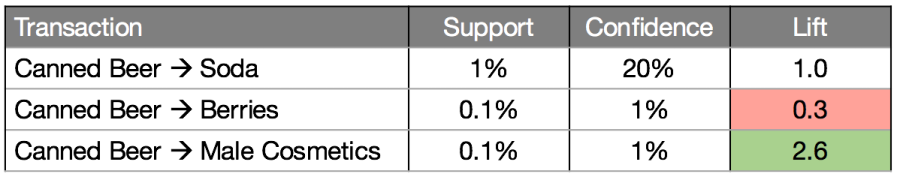
Table 2. Association measures for beer-related rules
The {beer -> soda} rule has the highest confidence at 20%. However, both beer and soda appear frequently across all transactions (see Table 3), so their association could simply be a fluke. This is confirmed by the lift value of {beer -> soda}, which is 1, implying no association between beer and soda.
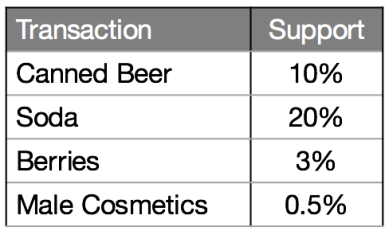
Table 3. Support of individual items
On the other hand, the {beer -> male cosmetics} rule has a low confidence, due to few purchases of male cosmetics in general. However, whenever someone does buy male cosmetics, he is very likely to buy beer as well, as inferred from a high lift value of 2.6. The converse is true for {beer -> berries}. With a lift value below 1, we may conclude that if someone buys berries, he would likely be averse to beer.
It is easy to calculate the popularity of a single itemset, like {beer, soda}. However, a business owner would not typically ask about individual itemsets. Rather, the owner would be more interested in having a complete list of popular itemsets. To get this list, one needs to calculate the support values for every possible configuration of items, and then shortlist the itemsets that meet the minimum support threshold.
In a store with just 10 items, the total number of possible configurations to examine would be a whopping 1023. This number increases exponentially in a store with hundreds of items.
Is there a way to reduce the number of item configurations to consider?