 Interpreting Machine Learning Models: An Overview
 Interpreting Machine Learning Models: An Overview
This post summarizes the contents of a recent O'Reilly article outlining a number of methods for interpreting machine learning models, beyond the usual go-to measures.
An article on machine learning interpretation appeared on O'Reilly's blog back in March, written by Patrick Hall, Wen Phan, and SriSatish Ambati, which outlined a number of methods beyond the usual go-to measures. By chance I happened back upon the article again over the weekend, and with a fresh read decided to share some of the ideas contained within. The article is a great (if lengthy) read, and recommend it to anyone who has the time.
The article is organized as follows:
- Overview of the differing complexities of (machine learning) functions to be explained
- Overview of the scope of interpretability, local (small regions of conditional distributions) vs. global (entire conditional distributions)
- A discussion of understanding and trust, and how traditional measures of understanding -- such as cross-validation and assessment plots -- often don't do enough to inspire trust in a model
- A breakdown into 3 sections of interpretation techniques (the real meat of the article)
Part 1 includes approaches for seeing and understanding your data in the context of training and interpreting machine learning algorithms, Part 2 introduces techniques for combining linear models and machine learning algorithms for situations where interpretability is of paramount importance, and Part 3 describes approaches for understanding and validating the most complex types of predictive models.
The deconstruction of the interpretability of each technique and group of techniques is the focus of the article, while this post is a summary of the techniques.
Part 1: Seeing your data
This section starts the article off slowly, and points out some methods to perform visual data exploration beyond the more traditional.
[T]here are many, many ways to visualize data sets. Most of the techniques highlighted below help illustrate all of a data set in just two dimensions, not just univariate or bivariate slices of a data set (meaning one or two variables at a time). This is important in machine learning because most machine learning algorithms automatically model high-degree interactions between variables (meaning the effect of combining many i.e., more than two or three variables together).
Visualization techniques presented in this section include:
- Glyphs
- Correlation graphs
- 2D projections, such as PCA, MDS, and t-SNE
- Partial dependence plots
- Residual analysis
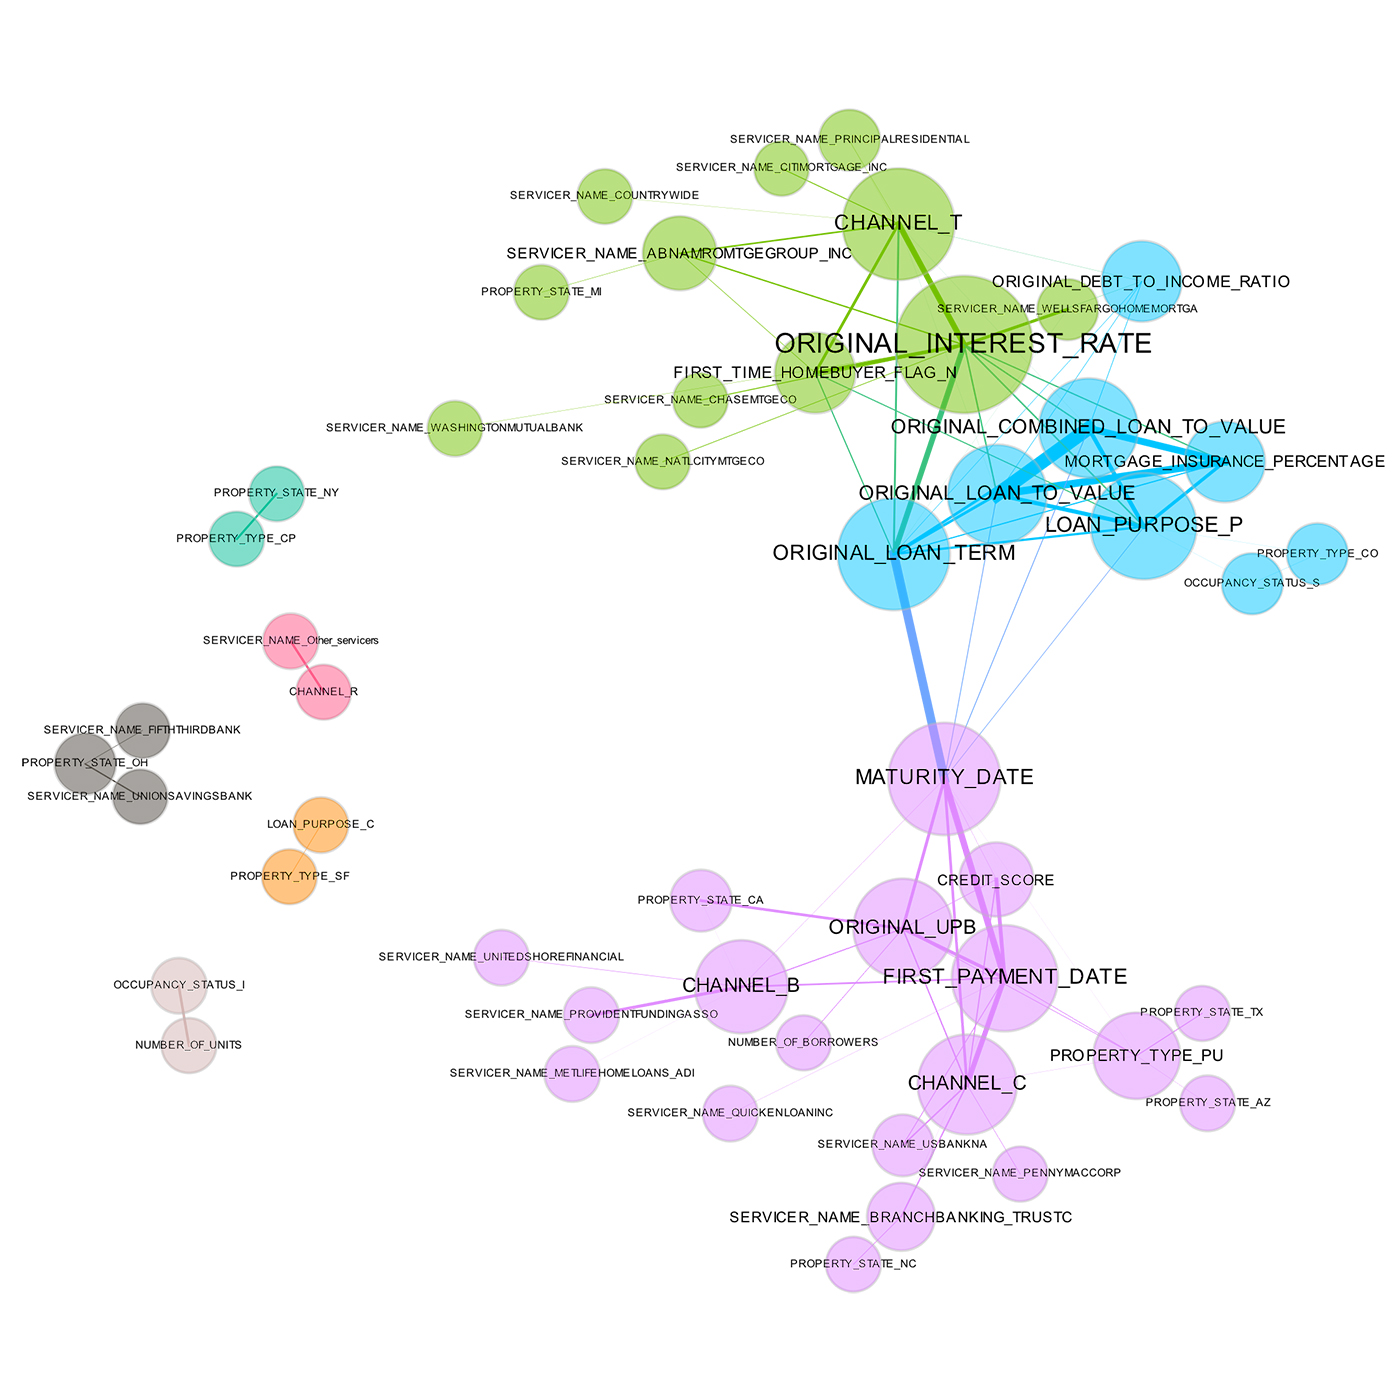
A correlation graph representing loans made by a large financial firm. Figure courtesy of Patrick Hall and the H2O.ai team.
Recommended questions to be asked to help determine the value of these visualization techniques (which are similarly asked of techniques in subsequent parts) include:
- What complexity of functions can visualizations help interpret?
- How do visualizations enhance understanding?
- How do visualizations enhance trust?
Part 2: Using machine learning in regulated industry
Things get a bit more interesting here.
The techniques presented in this section are newer types of linear models or models that use machine learning to augment traditional, linear modeling methods. These techniques are meant for practitioners who just can't use machine learning algorithms to build predictive models because of interpretability concerns.
Techniques outlined in this section include:
- Generalized Additive Models (GAMs)
- Quantile regression
- Building toward machine learning model benchmarks -- that is, employ a deliberate process when moving from traditional linear models toward machine learning algorithms, taking baby steps, and comparing performance and outcomes along the way, as opposed to jumping from a simple regression model into the deep end with black boxes
- Machine learning in traditional analytics processes -- this is the suggestion to use ML algorithms to augment analytical lifecycle processes for more accurate predictions, such as predicting linear model degredation
- Small, interpretable ensembles -- it's a foregone conclusion at this point that there is massive value in ensemble methods, in general, but employing simple such methods can potentially help boost both accuracy as well as interpretability.
- Monotonicity constraints -- such constraints can possibly transform complex models into interpretable, nonlinear, montonic models
Monotonicity is very important for at least two reasons:
- Monotonicity is often expected by regulators
- Monotonicity enables consistent reason code generation
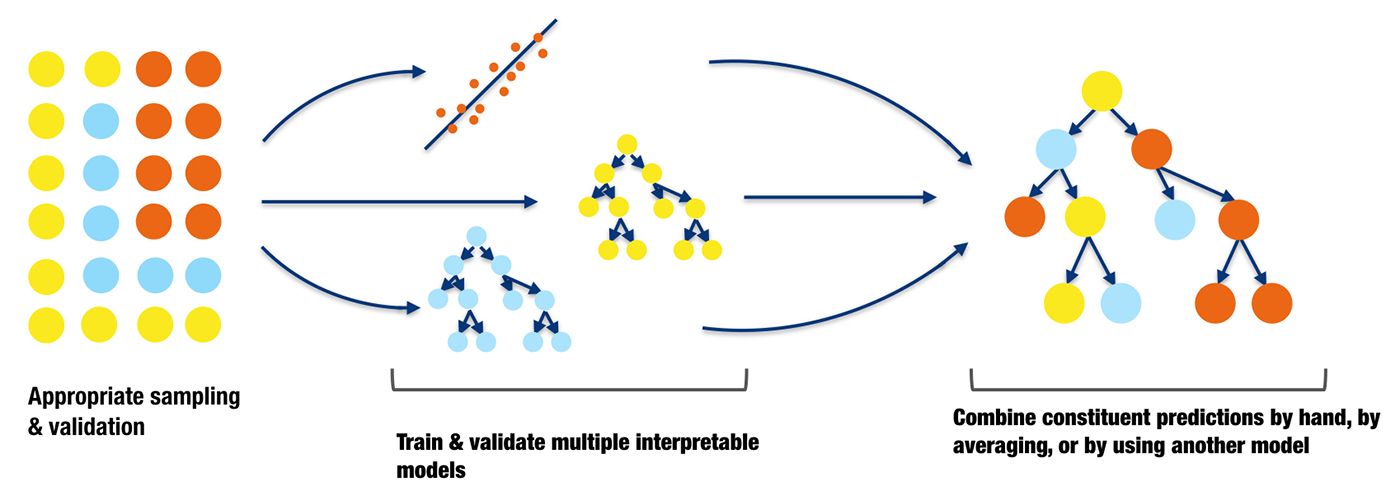
A diagram of a small, stacked ensemble. Figure courtesy of Vinod Iyengar and the H2O.ai team.
Part 3: Understanding complex machine learning models
In my opinion, this is where things get especially interesting. I approach complex machine learning model interpretability as an advocate of automated machine learning, since I feel the two techniques are flipsides of the same coin: if we are going to be using automated techniques to generate models on the front-end, then devising and employing appropriate ways to simplify and understand these models on the back-end becomes of utmost importance.
Here are the approaches outlined for helping understand complex ML models within this article.
Surrogate models -- simply, a surrogate is a simple model which can be used to explain a more complex model. If the surrogate model is created by training, say, a simple linear regression or a decision tree with original input data and predictions from the more complex model, the characteristics of the simple model can then be assumed to be an accurately descriptive stand-in of the more complex model. And it may not not be accurate at all.
Why, then, employ a surrogate model?
Surrogate models enhance trust when their coefficients, variable importance, trends, and interactions are in line with human domain knowledge and reasonable expectations of modeled phenomena. Surrogate models can increase trust when used in conjunction with sensitivity analysis to test that explanations remain stable and in line with human domain knowledge, and reasonable expectations when data is lightly and purposefully perturbed, when interesting scenarios are simulated, or as data changes over time.
Local Interpretable Model-agnostic Explanations (LIME) -- LIME is for building surrogate models based on a single observation
An implementation of LIME may proceed as follows. First, the set of explainable records are scored using the complex model. Then, to interpret a decision about another record, the explanatory records are weighted by their closeness to that record, and an L1 regularized linear model is trained on this weighted explanatory set. The parameters of the linear model then help explain the prediction for the selected record.
Maximum activation analysis -- a technique which looks to isolate particular instances which elicit a maximum response of some model hyperparameter
In maximum activation analysis, examples are found or simulated that maximally activate certain neurons, layers, or filters in a neural network or certain trees in decision tree ensembles. For the purposes of maximum activation analysis, low residuals for a certain tree are analogous to high-magnitude neuron output in a neural network.
So... LIME, or maximum activation analysis, or both?
LIME, discussed above, helps explain the predictions of a model in local regions of the conditional distribution. Maximum activation analysis helps enhance trust in localized, internal mechanisms of a model. The two make a great pair for creating detailed, local explanations of complex response functions.
Sensitivity analysis -- this technique helps to determine whether intentionally perturbed data, or similar data changes, modify model behavior and destabilizes the outputs; it is also useful for investigating model behavior for particular scenarios of interest or corner cases
Global variable importance measures -- typically the domain of tree-based models; a heuristic for determining varibale importance relates to the depth and frequency of a given variable's split point; higher and more frequent variables are decidedly more important
For example:
For a single decision tree, a variable's importance is quantitatively determined by the cumulative change in the splitting criterion for every node in which that variable was chosen as the best splitting candidate.
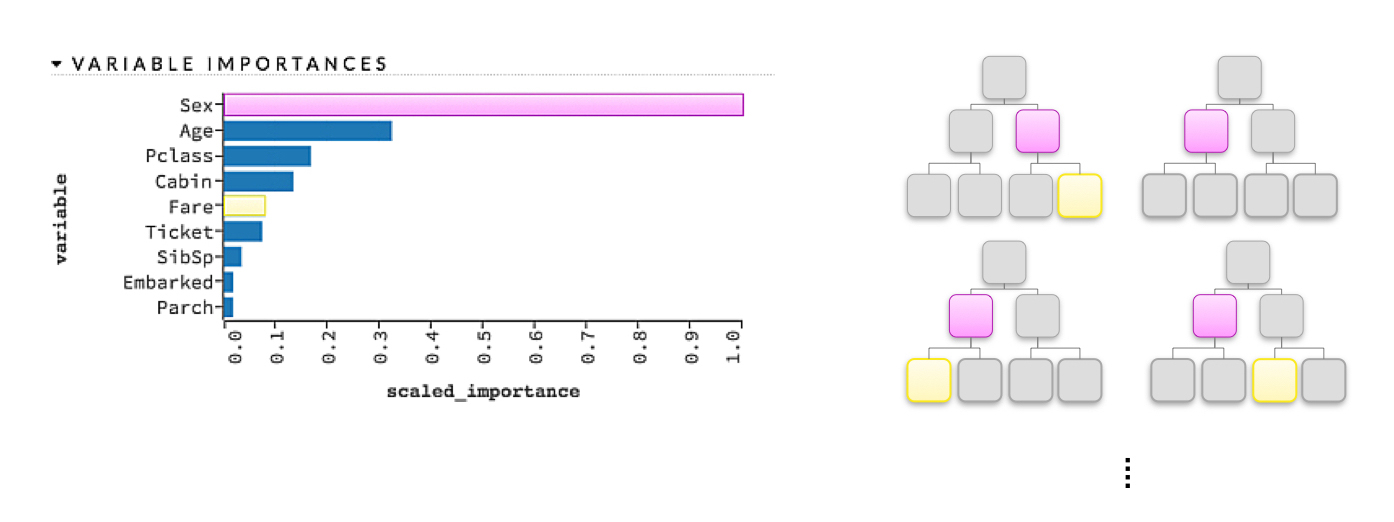
An illustration of variable importance in a decision tree ensemble model. Figure courtesy of Patrick Hall and the H2O.ai team.
Leave-One-Covariate-Out (LOCO) -- "model-agnostic generalization of mean accuracy decrease variable importance measures"; originally developed for regression models, but applicable more generally; the technique's goal is to determine the variable with the largest absolute impact on a given row -- by iteratively zeroing out variable values -- which is determined to be the most important for that row's prediction
How do variable importance measures enhance understanding?
Variable importance measures increase understanding because they tell us the most influential variables in a model and their relative rank.
Treeinterpreter -- strictly a tree-based model (decision trees, random forest, etc.) interpretation approach
Treeinterpreter simply outputs a list of the bias and individual contributions for a variable in a given model or the contributions the input variables in a single record make to a single prediction.
I am currently experimenting with Treeinterpreter and hope to soon share my experience.
To reiterate, this O'Reilly article which I have superficially summarized merits a full reading if you have time, wherein it fleshes out the techniques of which I have only scratched the surface, and does a much better job than did I of weaving together how useful each technique is and what one should expect as a resultof its utilization.
A thanks to Patrick Hall, Wen Phan, and SriSatish Ambati, the authors of this informative article.
Related: