 5 Data Science Projects That Will Get You Hired in 2018
 5 Data Science Projects That Will Get You Hired in 2018
A portfolio of real-world projects is the best way to break into data science. This article highlights the 5 types of projects that will help land you a job and improve your career.
By John Sullivan, DataOptimal
You’ve been taking MOOCs and reading a bunch of textbooks, but now what do you do? Getting a job in data science can seem daunting. The best way to showcase your skills is with a portfolio. This shows employers that you can use the skills you’ve been learning.
To showcase these skills, here’s 5 types of data science projects for your portfolio:
- Data Cleaning
Data scientists can expect to spend up to 80% of the time on a new project cleaning data. This is a huge pain point for teams. If you can show that you’re experienced at cleaning data, you’ll immediately be more valuable. To create a data cleaning project, find some messy data sets, and start cleaning.
If you’re working with Python, Pandas is a great library to use, and if you’re working with R, you can use the dplyr package. Make sure to showcase the following skills:
- Importing data
- Joining multiple datasets
- Detecting missing values
- Detecting anomalies
- Imputing for missing values
- Data quality assurance
- Exploratory Data Analysis
Another important aspect of data science is exploratory data analysis (EDA). This is the process of generating questions, and investigating them with visualizations. EDA allows an analyst to draw conclusions from data to drive business impact. It might include interesting insights based on customer segments, or sales trends based on seasonal effects. Often you can make interesting discoveries that weren’t initial considerations.

Some useful Python libraries for exploratory analysis are Pandas and Matplotlib. For R users, the ggplot2 package will be useful. An EDA project should show the following skills:
- Ability to formulate relevant questions for investigation
- Identifying trends
- Identifying covariation between variables
- Communicating results effectively using visualizations (scatterplots, histograms, box and whisker, etc.)
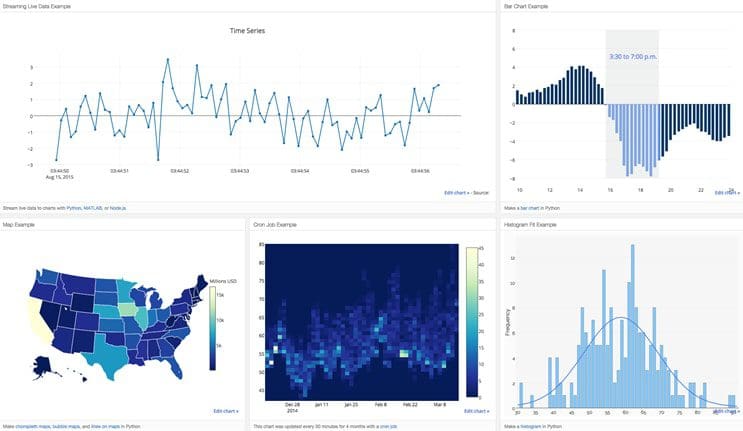
- Interactive Data Visualizations
Interactive data visualizations include tools such as dashboards. These tools are useful for both data science teams, as well as more business-oriented end users. Dashboards allow data science teams to collaborate, and draw insights together. Even more important, they provide an interactive tool for business-oriented customers. These individuals focus on strategic goals rather than technical details. Often the deliverable for a data science project to a client will be in the form of a dashboard.
For Python users, the Bokeh and Plotly libraries are great for creating dashboards. For R users, be sure to check out RStudio’s Shiny package. Your dashboard project should highlight these important skills:
- Including metrics relevant to your customer’s needs
- Creating useful features
- A logical layout (“F-pattern” for easy scanning)
- Creating an optimum refresh rate
- Generating reports or other automated actions
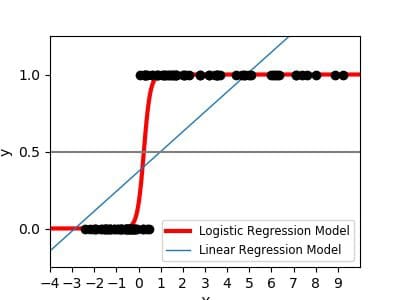
- Machine Learning
A machine learning project is another important piece of your data science portfolio. Now before you run off and start building some deep learning project, take a step back for a minute. Rather than building a complex machine learning model, stick with the basics. Linear regression and logistic regression are great to start with. These models are easier to interpret and communicate to upper level management. I’d also recommend focusing on a project that has a business impact, such as predicting customer churn, fraud detection, or loan default. These are more real-world than predicting flower type.
If you’re a Python user, use the Scikit-learn library. For R users, use the Caret package. Your machine learning project should convey the following skills:
- Reason why you chose to use a specific machine learning model
- Splitting data into training/test sets (k-fold cross validation) to avoid overfitting
- Selecting the right evaluation metrics (AUC, adj-R^2, confusion matrix, etc.)
- Feature engineering and selection
- Hyperparameter tuning
- Communication
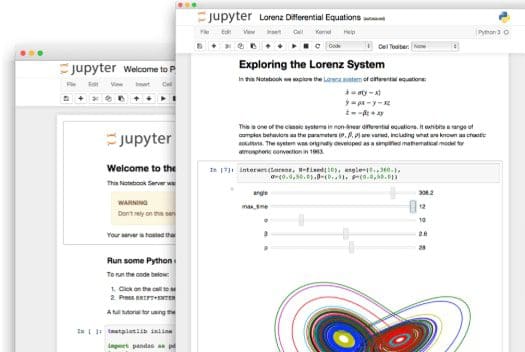
Communication is an important aspect of data science. Effectively communicating results is what separates the good data scientists from the great ones. It doesn’t matter how fancy your model is, if you can’t explain it to teammates or customers, you won’t get their buy-in. Slides and notebooks are both great communication tools. Use one of your machine learning projects and put it into slide format. You could also use a Jupyter Notebook or RMarkdown file for a communication project.
Make sure to understand who your intended audience is. Presenting to executives is very different than presenting to machine learning experts. Make sure to hit on these skills:
- Know your intended audience
- Present relevant visualizations
- Don’t crowd your slides with too much information
- Make sure your presentation flows well
- Tie results to a business impact (reduced cost, increased revenue)
Make sure to document your projects in Jupyter Notebooks or RMarkdown files. You can then convert these markdown files to static websites for free using Github Pages. This is a great way to showcase your portfolio to potential employers.
Stay positive, continue to build projects, and you’ll be on your way to landing a job in data science. Happy job hunting!
Bio: John Sullivan is the founder of the data science learning blog, DataOptimal. You can follow him on Twitter @DataOptimal.
Related:
- Data Science Predicting The Future
- Stagraph – a general purpose R GUI, for data import, wrangling, and visualization
- 7 Simple Data Visualizations You Should Know in R