Customer Churn Prediction Using Machine Learning: Main Approaches and Models
We reach out to experts from HubSpot and ScienceSoft to discuss how SaaS companies handle the problem of customer churn prediction using Machine Learning.
By Altexsoft.
Customer retention is one of the primary growth pillars for products with a subscription-based business model. Competition is tough in the SaaS market where customers are free to choose from plenty of providers even within one product category. Several bad experiences – or even one – and a customer may quit. And if droves of unsatisfied customers churn at a clip, both material losses and damage to reputation would be enormous.
For this article, we reached out to experts from HubSpot and ScienceSoft to discuss how SaaS companies handle the problem of customer churn with predictive modeling. You will discover approaches and best practices for solving this problem. We’ll discuss collecting data about client relationship with a brand, characteristics of customer behavior that correlate the most with churn and explore the logic behind selecting the best-performing machine learning models.
What is customer churn?
Customer churn (or customer attrition) is a tendency of customers to abandon a brand and stop being a paying client of a particular business. The percentage of customers that discontinue using a company’s products or services during a particular time period is called a customer churn (attrition) rate. One of the ways to calculate a churn rate is to divide the number of customers lost during a given time interval by the number of acquired customers, and then multiply that number by 100 percent. For example, if you got 150 customers and lost three last month, then your monthly churn rate is 2 percent.
Churn rate is a health indicator for businesses whose customers are subscribers and paying for services on a recurring basis, notes head of data analytics department at ScienceSoft Alex Bekker, “Customers [of subscription-driven businesses] opt for a product or a service for a particular period, which can be rather short – say, a month. Thus, a customer stays open for more interesting or advantageous offers. Plus, each time their current commitment ends, customers have a chance to reconsider and choose not to continue with the company. Of course, some natural churn is inevitable, and the figure differs from industry to industry. But having a higher churn figure than that is a definite sign that a business is doing something wrong.”
There are many things brands may do wrong, from complicated onboarding when customers aren’t given easy-to-understand information about product usage and its capabilities to poor communication, e.g. the lack of feedback or delayed answers to queries. Another situation: Longtime clients may feel unappreciated because they don’t get as many bonuses as the new ones.
In general, it’s the overall customer experience that defines brand perception and influences how customers recognize value for money of products or services they use.
The reality is that even loyal customers won’t tolerate a brand if they’ve had one or several issues with it. For instance, 59 percent of US respondents to the survey by PricewaterhouseCoopers (PwC) noted that they will say goodbye to a brand after several bad experiences, and 17 percent of them after just one bad experience.
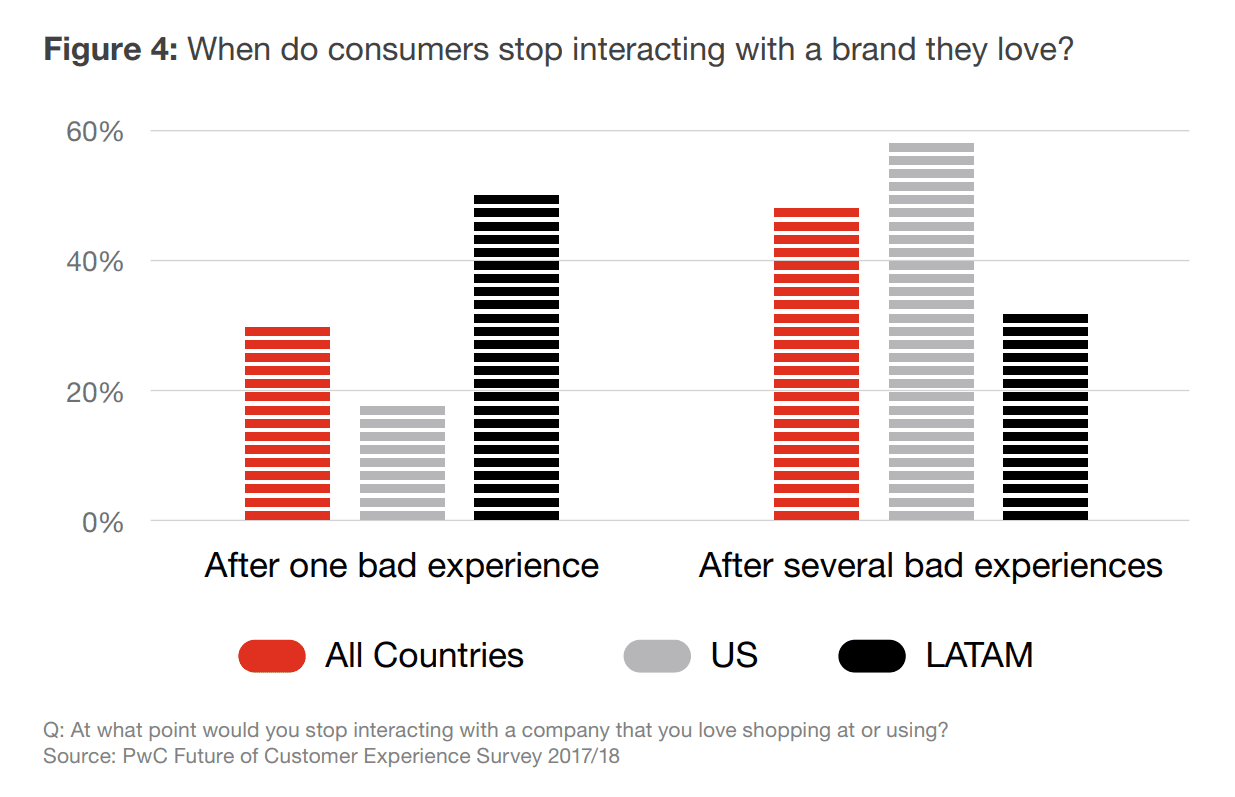
Bad experiences may alienate even loyal customers. Source: PwC
Impact of customer churn on businesses
Well, churn is bad. But how exactly does it affect company performance in the long run?
Don’t underestimate the impact of even a tiny percentage of churn, says Michael Redbord, general manager of Service Hub at HubSpot. “In a subscription-based business, even a small rate of monthly/quarterly churn will compound quickly over time. Just 1 percent monthly churn translates to almost 12 percent yearly churn. Given that it’s far more expensive to acquire a new customer than to retain an existing one, businesses with high churn rates will quickly find themselves in a financial hole as they have to devote more and more resources to new customer acquisition.”
Many surveys focusing on customer acquisition and retention costs are available online. According to this one by Invesp, conversion rate optimization company, getting a new customer may cost up to five times more than retaining an existing customer.
Churn rates do correlate with lost revenue and increased acquisition spend. In addition, they play a more nuanced role in a company’s growth potential, continues Michael,“Today’s buyers aren’t shy about sharing their experiences with vendors through channels like review sites and social media, as well as peer-to-peer networks. HubSpot Research found that 49 percent of buyers reported sharing an experience they had with a company on social media. In a world of eroding trust in businesses, word of mouth plays a more critical role in the buying process than ever before. From the same HubSpot Research study, 55 percent of buyers no longer trust the companies they buy from as much as they used to, 65 percent don’t trust company press releases, 69 percent don’t trust advertisements, and 71 percent don’t trust sponsored ads on social networks.”
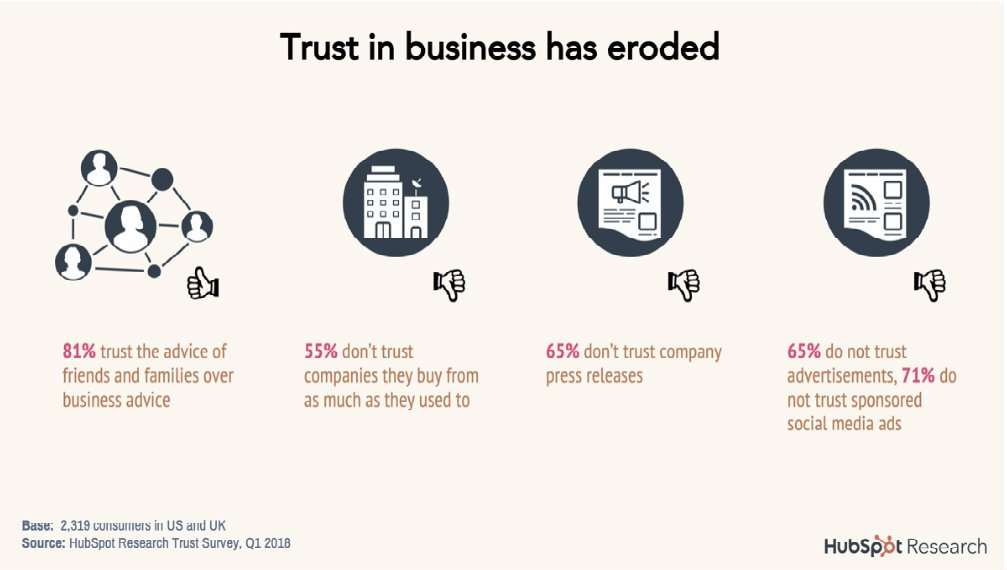
A glance at the state of customer trust towards businesses. Source: HubSpot Research Trust Survey
The expert concludes that companies with high churn rates aren’t only failing to deliver in their relationships with ex-customers but also damage their future acquisition efforts by creating negative word-of-mouth around their products.
CallMiner conversational analytics solutions provider interviewed 1000 adults to learn why and how they interact with companies. The survey revealed that US businesses lose about $136 billion a year due to customer attrition. What’s more, the company behaviors that caused customers to cut ties with brands could have been corrected.
Use cases for customer churn prediction
As we mentioned before, churn rate is one of the critical performance indicators for subscription businesses. The subscription business model – pioneered by English book publishers in the 17th century – is very popular among modern service providers. Let’s take a quick look at these companies:
Music and video streaming services are probably the most commonly associated with the subscription business model (Netflix, YouTube, Apple Music, Google Play, Spotify, Hulu, Amazon Video, Deezer, etc.).
Media. Digital presence is a must among the press, so news companies offer readers digital subscriptions besides print ones (Bloomberg, The Guardian, Financial Times, The New York Times, Medium etc.).
Telecom companies (cable or wireless). These companies may provide a full range of products and services, including wireless network, internet, TV, cell phone, and home phone services (AT&T, Sprint, Verizon, Cox Communications, etc.). Some specialize in mobile telecommunications (China Mobile, Vodafone, T-Mobile, etc.).
Software as a service providers. The adoption of cloud-hosted software is growing. According to Gartner, the SaaS market remains the largest segment of the cloud market. Its revenue is expected to grow 17.8 percent and reach $85.1 billion in 2019. The product range of SaaS providers is extensive: graphic and video editing (Adobe Creative Cloud, Canva), accounting (Sage 50cloud, FreshBooks), eCommerce (BigCommerce, Shopify), email marketing (MailChimp, Zoho Campaigns), and many others.
These company types may use churn rate to measure the effectiveness of cross-department operations and product management.
Identifying at-risk customers with machine learning: problem-solving at a glance
Companies that constantly monitor how people engage with products, encourage clients to share opinions, and solve their issues promptly have greater opportunities to maintain mutually beneficial client relationships.
And now imagine a company that has been gathering customer data for a while, so it can use it to identify behavior patterns of potential churners, segment these at-risk customers, and take appropriate actions to gain back their trust. Those following a proactive approach to customer churn management use predictive analytics. That’s one of four analytics types that entails forecasting the probability of future outcomes, events, or values by analyzing current and historical data. Predictive analytics utilizes various statistical techniques, such as data mining (pattern recognition) and machine learning (ML).
“The one weakness of tracking just real churn is that it serves only as a lagging indicator of poor customer experience, which is where a predictive churn model becomes extremely valuable,” notes Michael Redbord from HubSpot.
The main trait of machine learning is building systems capable of finding patterns in data, learning from it without explicit programming. In the context of customer churn prediction, these are online behavior characteristics that indicate decreasing customer satisfaction from using company services/products.
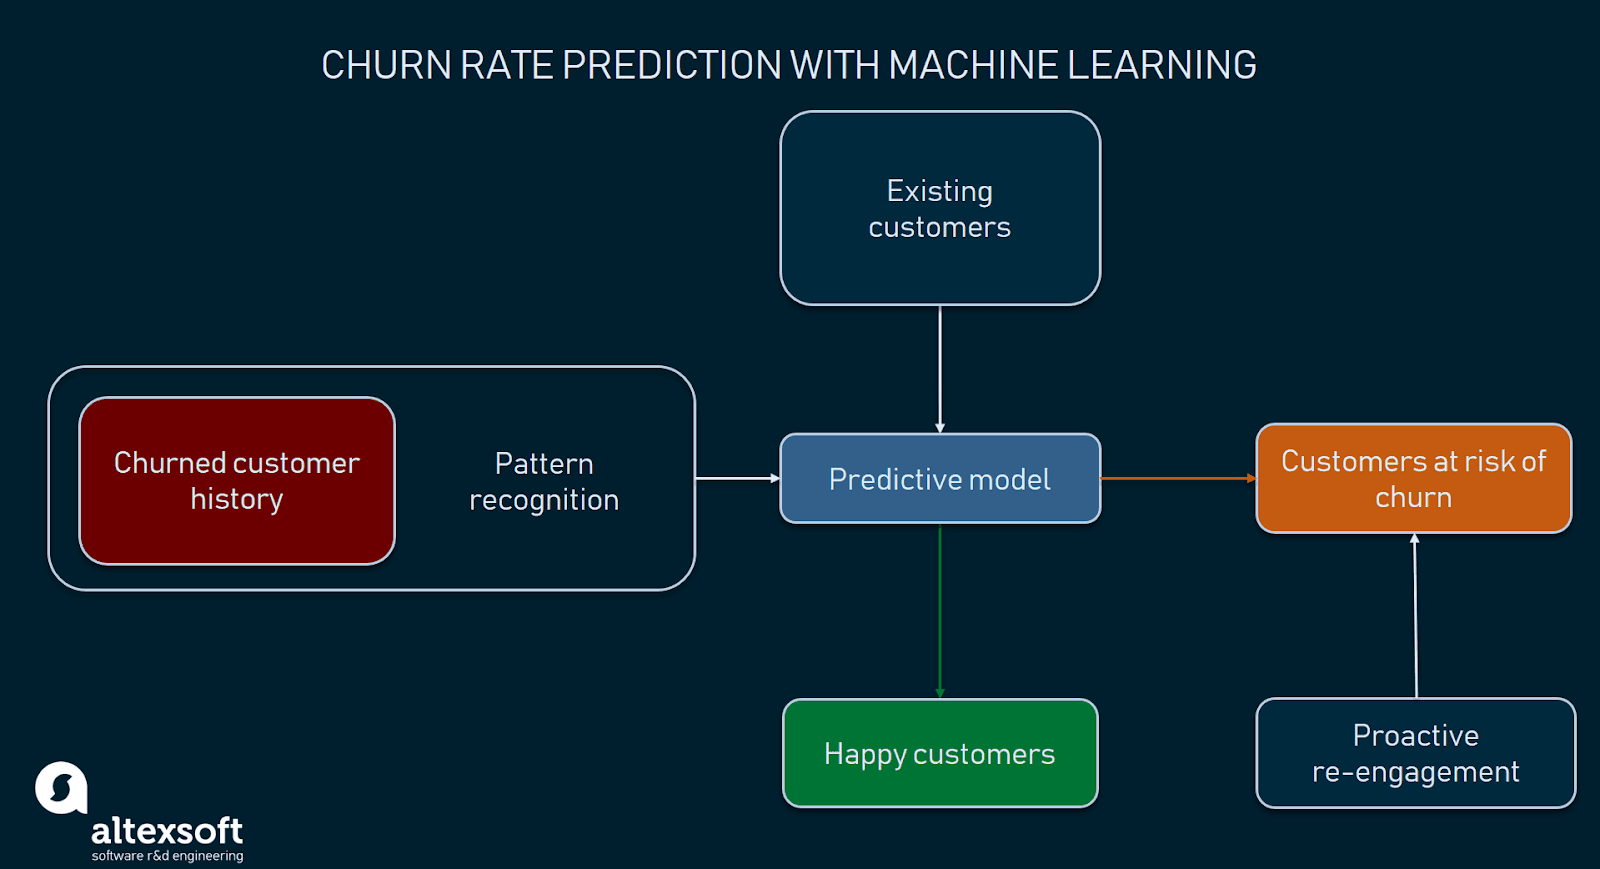
Detecting customers at risk of churn helps take measures in advance
ScienceSoft’s Alex Bekker also stresses the importance of machine learning for proactive churn management: “As to identifying potential churners, machine learning algorithms can do a great job here. They reveal some shared behavior patterns of those customers who have already left the company. Then, ML algorithms check the behavior of current customers against such patterns and signal if they discover potential churners.”
Subscription-based businesses leverage ML for predictive analytics to find out which current users aren’t fully satisfied with their services and address their issues when it’s not too late: “Identifying customers at risk of churn as many as 11 months before their renewal enables our customer success team to engage these customers, understand their pain points, and with them, put together a long term plan focused on helping the customer realize value from the service they bought,” explains Michael.
Use cases for predictive churn modeling go beyond proactive engagement with prospective churning customers and selecting effective retention actions. According to Redbord, ML-based software allows customer success managers to define which customers they should contact. In other words, employees can be sure they’re speaking with the right customers at the right time.
Sales, customer success, and marketing teams can also use the knowledge from the data analysis to align their actions. “For example, if a customer is showing signs of churn risk, that’s probably not a great time for sales to reach out with information about additional services the customer might be interested in. Rather, that engagement should be with the CSM so they can help the customer become re-engaged and see value in the products they currently have. Like sales, marketing can engage with customers differently depending on their current indication of churn risk: For example, non-churn risk customers are better candidates to participate in a case study than a customer who is currently a churn risk,” the expert of HubSpot explains. Generally speaking, the strategy of customer interaction should be based on ethics and sense of timing. And using machine learning for customer data analysis can bring insights to power this strategy.
Predicting customer churn with machine learning
But how to start working with churn rate prediction? Which data is needed? And what are the steps to implementation?
As with any machine learning task, data science specialists first need data to work with. Depending on the goal, researchers define what data they must collect. Next, selected data is prepared, preprocessed, and transformed in a form suitable for building machine learning models. Finding the right methods to training machines, fine-tuning the models, and selecting the best performers is another significant part of the work. Once a model that makes predictions with the highest accuracy is chosen, it can be put into production.
The overall scope of work data scientists carry out to build ML-powered systems capable to forecast customer attrition may look like the following:
- Understanding a problem and final goal
- Data collection
- Data preparation and preprocessing
- Modeling and testing
- Model deployment and monitoring
If you want to learn what happens during these steps, read our article about the machine learning project structure. Now let’s find out how to complete each of these stages in the context of churn prediction.
Understanding a problem and a final goal
It’s important to understand what insights one needs to get from the analysis. In short, you must decide what question to ask and consequently what type of machine learning problem to solve: classification or regression. Sounds complicated, but bear with us.
Classification. The goal of classification is to determine to which class or category a data point (customer in our case) belongs to. For classification problems, data scientists would use historical data with predefined target variables AKA labels (churner/non-churner) – answers that need to be predicted – to train an algorithm. With classification, businesses can answer the following questions:
- Will this customer churn or not?
- Will a customer renew their subscription?
- Will a user downgrade a pricing plan?
- Are there any signs of unusual customer behavior?
The fourth question about atypical behavior signs represents a type of a classification problem called anomaly detection. Anomaly detection is about identifying outliers – data points that significantly deviate from the rest of the data.
Regression. Customer churn prediction can be also formulated as a regression task. Regression analysis is a statistical technique to estimate the relationship between a target variable and other data values that influence the target variable, expressed in continuous values. If that’s too hard – the result of regression is always some number, while classification always suggests a category. In addition, regression analysis allows for estimating how many different variables in data influence a target variable. With regression, businesses can forecast in what period of time a specific customer is likely to churn or receive some probability estimate of churn per customer.
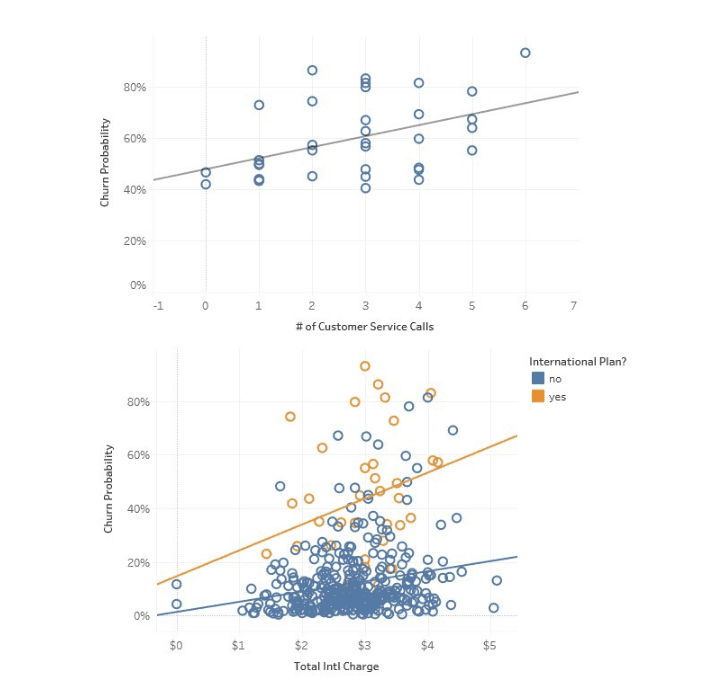
This is the example of logistic regression used to predict churn probability in telecom by Towards Data Science. Here, the visualization depicts how the number of service calls and the use of international plans correlate with churn
Data collection
Identifying data sources. Once you’ve identified which kinds of insights to look for, you can decide what data sources are necessary for further predictive modeling. Let’s assume the most common sources of data you can use for predicting churn:
- CRM systems (including sales and customer support records)
- Analytics services (e.g., Google Analytics, AWStats, CrazyEgg)
- Feedback on social media and review platforms
- Feedback provided on request for your organization, etc.
Obviously, the list may be longer or shorter depending on the industry.
Data preparation and preprocessing
Historical data that was selected for solving the problem must be transformed into a format suitable for machine learning. Since model performance and therefore the quality of received insights depend on the quality of data, the primary aim is to make sure all data points are presented using the same logic, and the overall dataset is free of inconsistencies. Previously we wrote an article about basic techniques for dataset preparation, so feel free to check it out if you want to know more on the topic.
Feature engineering, extraction, and selection. Feature engineering is a very important part of dataset preparation. During the process, data scientists create a set of attributes (input features) that represent various behavior patterns related to customer engagement level with a service or product. In a broad sense, features are measurable characteristics of observations that an ML model takes into account to predict outcomes (in our case the decision relates to churn probability.)
Although behavior characteristics are specific to each industry, approaches to identifying at-risk customers are universal, notes Alex: “A business looks for specific behavior patterns that reveal potential churners.”
Digital marketer and entrepreneur Neil Patel classifies features into four groups. Customer demographics and support features work for any industry. User behavior and contextual features, in turn, are typical for the SaaS business model:
- customer demographic features that contain basic information about a customer (e.g., age, education level, location, income)
- user behavior features describing how a person uses a service or product (e.g., lifecycle stage, number of times they log in into their accounts, active session length, time of the day when a product is used actively, features or modules used, actions, monetary value)
- support features that characterize interactions with customer support (e.g., queries sent, number of interactions, history of customer satisfaction scores)
- contextual features representing other contextual information about a customer.
HubSpot specialists try to understand “what makes a successful customer” by using such metrics as website visitors, leads generated, and deals created. General manager of Service Hub Michael Redbord says: “We not only track usage data (e.g., publishing a blog post, editing a deal’s projected closed value, or sending an email) but outcome data (e.g., number of click on an email, number of views on a blog post, dollar value of deals closed during a quarter.) It’s important to understand not just how your customers are using your product but what results they’re seeing. If customers aren’t generating value from the product, we typically see an increase in the likelihood of churn.”
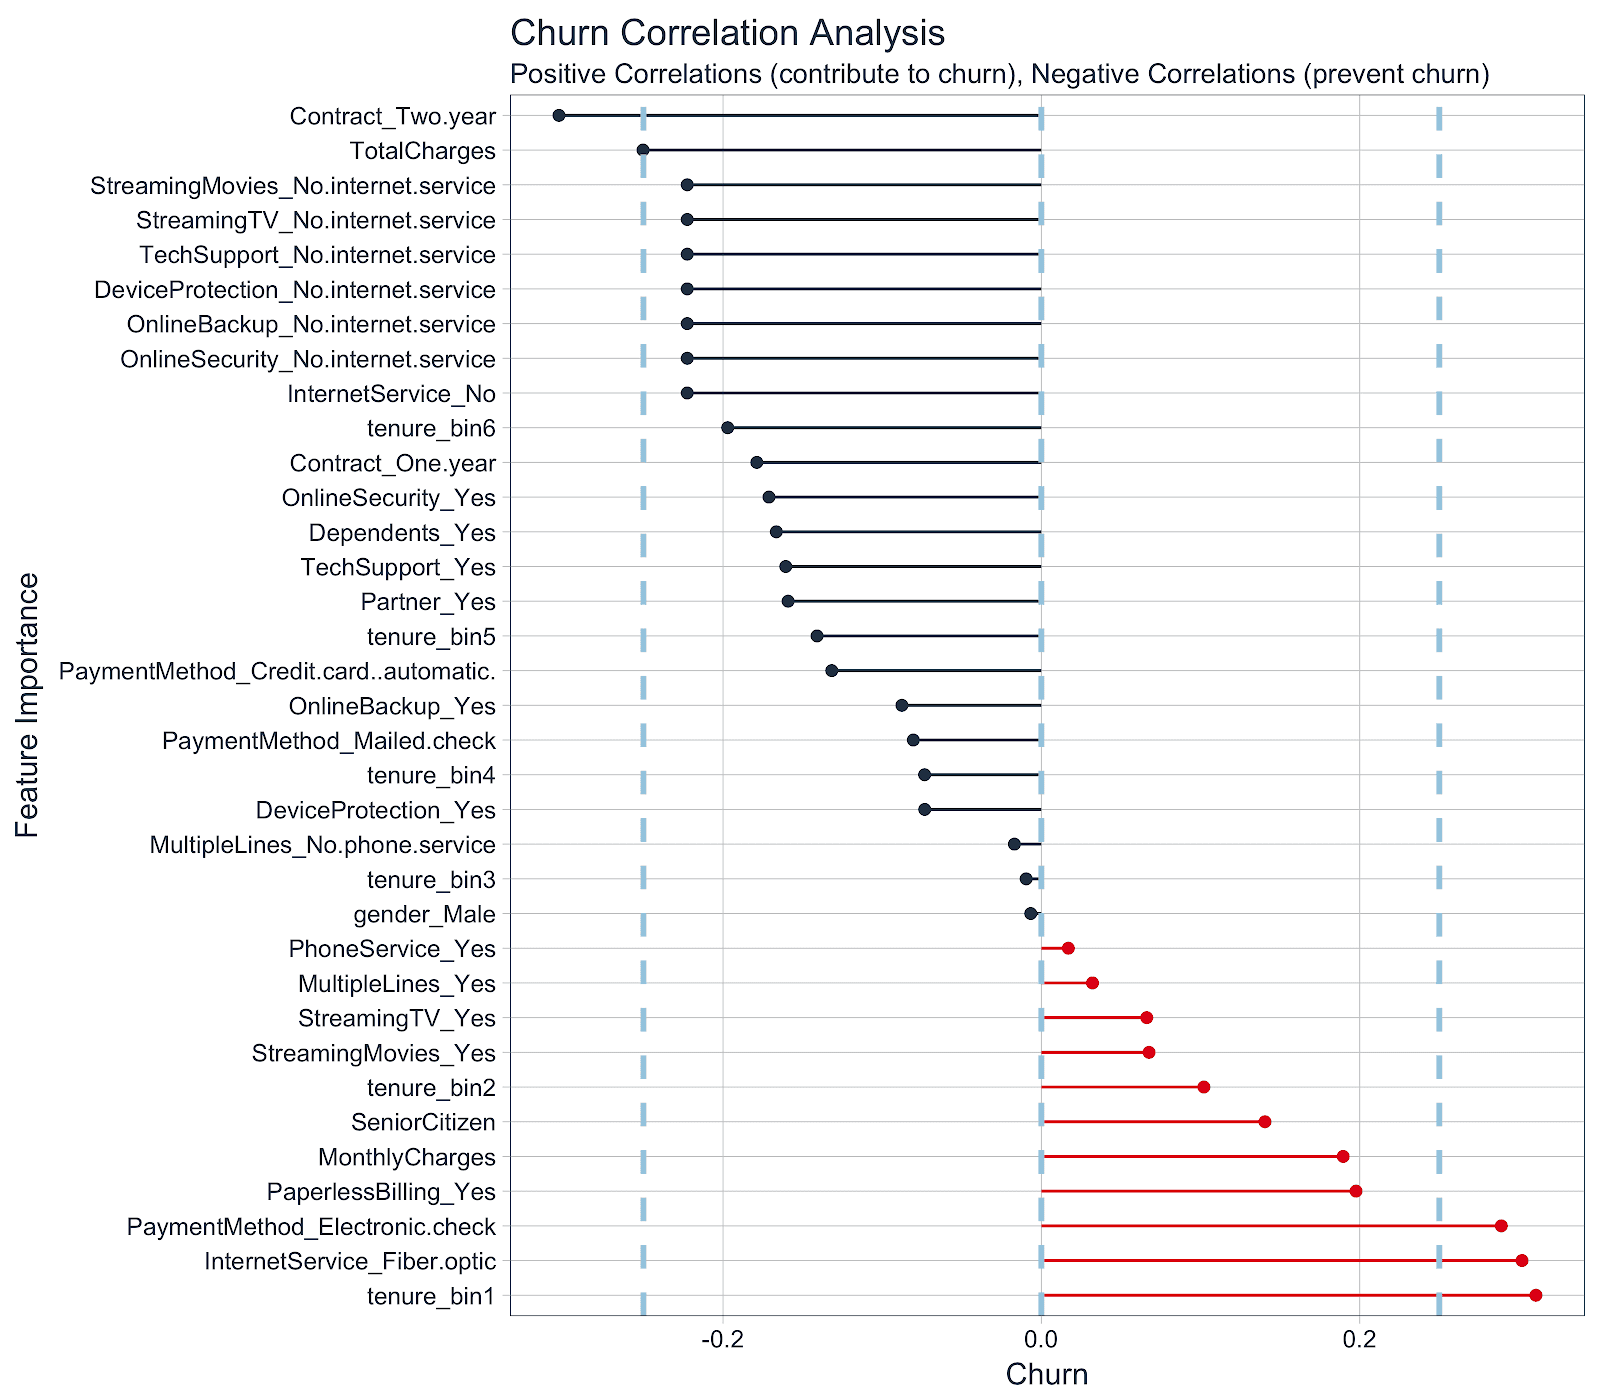
How different user behavior, subscription, and demographic features correlate with churn in Internet service by Matt Dancho for RStudio blog
But having too much data isn’t always good.
Feature extraction aims at reducing the number of variables (attributes) by leaving the ones that represent the most discriminative information. Feature extraction helps to reduce the data dimensionality (dimensions are columns with attributes in a dataset) and exclude irrelevant information.
During feature selection, specialists revise previously extracted features and define a subgroup of them that’s most correlated with customer churn. As a result of feature selection, specialists have a dataset with only relevant features.
Methods. Head of ScienceSoft data analytics department Alex Bekker notes that such methods as permutation importance, ELI5 Python package, and SHAP (SHapley Additive exPlanations) can be used to define the most relevant and useful features.
The principle of work of all methods lies in explaining how models make their predictions (based on what features a model made a particular conclusion.) Model interpretability is one of the high-priority issues in the field, and data scientists keep developing solutions to solve it. You can read more about interpretability in our article on AI and data science advances and trends.
Permutation importance is one of the ways of defining feature importance – an impact a feature makes on the predictions. It’s calculated on models that have already been trained. This is how permutation importance is done: A data scientist changes the order of data points in a single column, feeds the model with the resulting dataset, and defines to what extent that change decreases its accuracy. Features that have the biggest influence on results are the most important.
Another way to do permutation importance is to remove a feature from a dataset and retrain the model.
Permutation importance can be done with ELI5 – an open source Python library that allows for visualizing, debugging ML classifiers (algorithms), and interpreting their outputs.
According to the ELI5 documentation, this method works best on datasets that don’t contain a large number of columns (features).
Using the SHAP (SHapley Additive exPlanations) framework, specialists can interpret decisions of “any machine learning model.” SHAP also assigns each feature an importance value for a particular prediction.
Customer segmentation. Growing companies and those expanding their product range usually segment their customers using previously defined and selected features. Customers can be divided into subgroups based on their lifecycle stage, needs, used solutions, level of engagement, monetary value, or basic information. Since every customer category shares common behavior patterns, it’s possible to increase prediction accuracy through the use of ML models trained specifically on datasets representing each segment.
For instance, HubSpot uses such segmentation criteria as customer persona, lifecycle stage, owned products, region, language, and total revenue of the account. “Combinations of segments like these are how we carve up ownership of accounts and define a CSM [customer support manager] or salesperson’s book of business,” says Michael.
In addition, armed with knowledge about customer value, employees can prioritize their retention activities.
After data preparation, feature selection, and customer segmentation stages, the time comes to define how long it will take to track user behavior before drawing predictions.
Selecting an observation window (customer event history). Predictive modeling is about learning the relationship between observations made during a period (window) that ends before a specific time point and predictions about a period that starts after the same time point. The former period is referred to as observation, independent, explanatory window, or customer event history (let’s use the last definition for clarity). The latter period that follows an observation one is called a performance, dependent, or response window. In other words, we predict events (a user churns or stays) in a performance window, in the future.
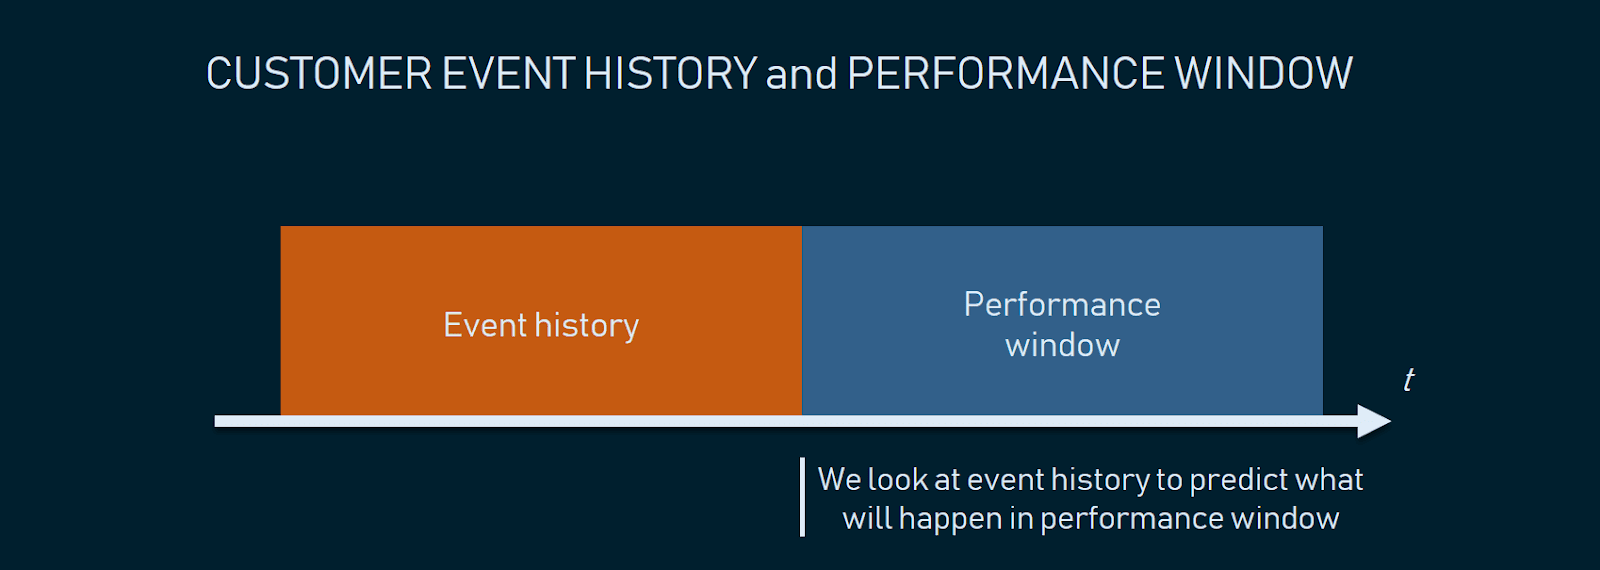
It’s critical to define correct event history and observation windows
Machine learning engineer at Spotify, Guilherme Dinis, Jr., in his master’s thesis, studied the behavior of new Spotify users registered to a free plan to define whether they leave or remain active during the second week after their registration.
He chose the first week of usage as the event history. To classify users as churners and active users Guilherme checked if there was any streaming activity in the second week. If users continued listening to music, they were classified as non-churners.
“The reasons for keeping the observation [event history] and activation windows [performance window] relatively small is motivated by internal prior studies on the same population of users which indicated high churn probability two weeks after registration,” explained the engineer.
So, to define the event history longevity and performance window, you must consider when your users usually churn. It may be the second week, as in the Spotify example, or it may be the 11th month of annual subscription. But most likely, you wouldn’t want to learn that this subscriber is likely to churn in a month. As you’ll have a very small timeframe for re-engagement.
Balancing the time for observations and predictions is actually a tricky task. For instance, if an observation window is one month, then a performance window for a customer with an annual subscription will be 11 months. It seems that making a short event history and long performance windows would be the most beneficial for businesses. You take little time for observation and have enough time for re-engagement. Unfortunately, it doesn’t always work this way. A short event history may not be enough to make reliable predictions, so experimenting with these parameters can become a repetitive ongoing process with its trade-offs. Basically, you have to define the event history that would be enough for a model to make a justified prediction, but still, have enough time to address potential churn.
Modeling and testing
The main goal of this project stage is to develop a churn prediction model. Specialists usually train numerous models, tune, evaluate, and test them to define the one that detects potential churners with the desired level of accuracy on training data.
Classic machine learning models are commonly used for predicting customer attrition, for example, logistic regression, decision trees, random forest, and others. Alex Bekker from ScienceSoft suggests using Random Forest as a baseline model, then “the performance of such models as XGBoost, LightGBM, or CatBoost can be assessed.” Data scientists generally use a baseline model’s performance as a metric to compare the prediction accuracy of more complex algorithms.
Logistic regression is an algorithm used for binary classification problems. It predicts the likelihood of an event by measuring the relationship between a dependent variable and one or more independent variables (features). More specifically, logistic regression will predict the possibility of an instance (data point) belonging to the default category.
A decision tree is a type of supervised learning algorithm (with a predefined target variable.) While mostly used in classification tasks, it can handle numeric data as well. This algorithm splits a data sample into two or more homogeneous sets based on the most significant differentiator in input variables to make a prediction. With each split, a part of a tree is being generated. As a result, a tree with decision nodes and leaf nodes (which are decisions or classifications) is developed. A tree starts from a root node – the best predictor.
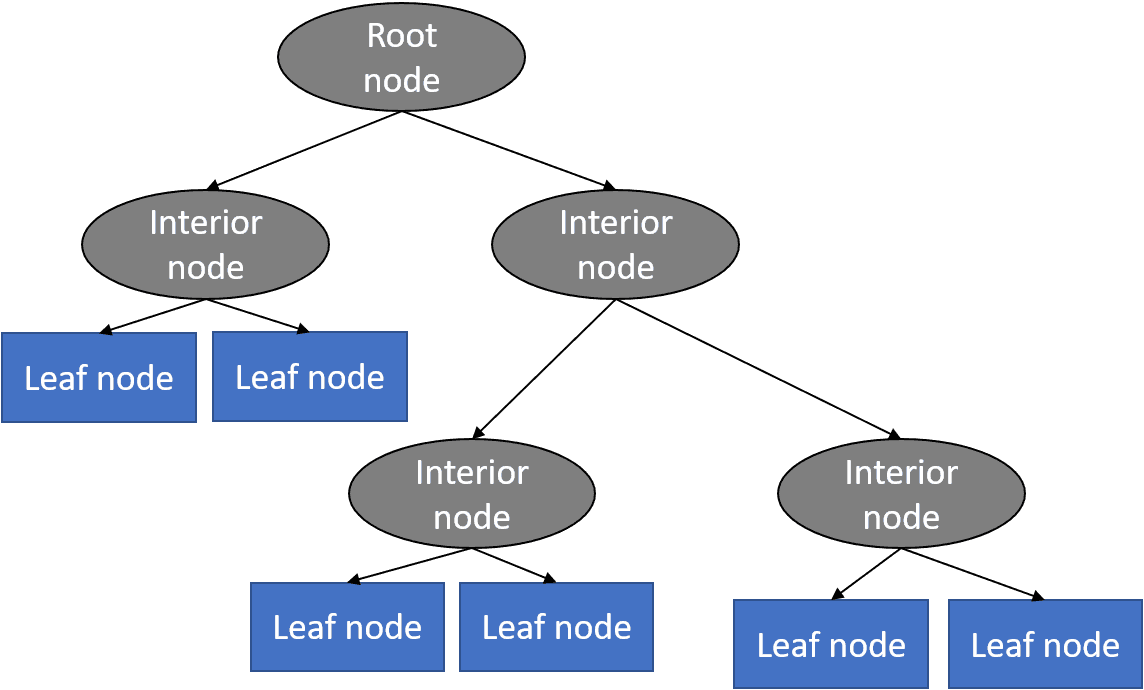
Decision tree basic structure. Source: Python Machine Learning Tutorial
Prediction results of decision trees can be easily interpreted and visualized. Even people without an analytical or data science background can understand how a certain output appeared. Compared to other algorithms, decision trees require less data preparation, which is also an advantage. However, they may be unstable if any small changes were made in data. In other words, variations in data may lead to radically different trees being generated. To address this issue, data scientists use decision trees in a group (AKA ensemble) that we’ll talk about next.
A Random forest is a type of an ensemble learning method that uses numerous decision trees to achieve higher prediction accuracy and model stability. This method deals with both regression and classification tasks. Every tree classifies a data instance (or votes for its class) based on attributes, and the forest chooses the classification that received the most votes. In the case of regression tasks, the average of different trees’ decisions is taken.
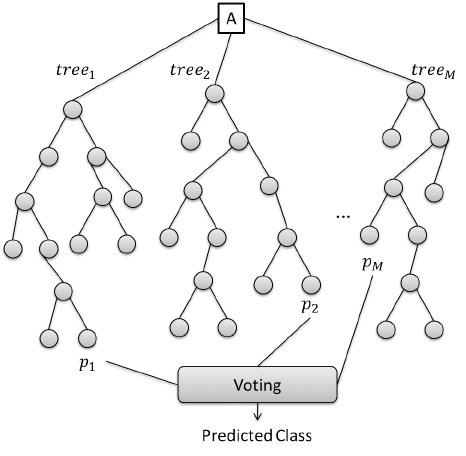
That’s how Random Forest makes predictions. Source: ResearchGate
XGBoost is the implementation of the gradient boosted tree algorithms that’s commonly used for classification and regression problems. Gradient boosting is an algorithm consisting of a group of weaker models (trees), which sums up their estimates to predict a target variable with more accuracy.
A group of researchers from the University of Virginia studied the time-dependent software feature usage data, such as login numbers and comment numbers, to predict a SaaS customer churn within the time horizon of three months. The authors compared model performance across four classification algorithms, and “the XGBoost model achieved the best results for identifying the most important software usage features and for classifying customers as either churn type or non-risky type.” The XGBoost model’s ability to define the most significant features that represent how customers use SaaS software can help service providers launch more effective marketing campaigns when targeting potential clients, according to researchers.
LightGBM is a gradient boosting framework that uses tree-based learning algorithms. It can be used for many ML tasks, for instance, classification and ranking. According to the documentation, some advantages of LightGBM are faster training speed and higher efficiency, as well as greater accuracy. These algorithms use lower memory and handle large volumes of data – it’s not advisable to use them on datasets with less than 10,000 rows. LightGBM also supports parallel and GPU learning (the use of graphical processing units for training large datasets).
CatBoost is another gradient boosting on decision trees library. It handles both numerical and categorical features, so can be used for classification, regression, ranking, and other machine learning tasks. One of the pros of CatBoost is that it permits training models with CPU and two or more GPUs.
Technique choice. Numerous factors can influence the number of required models in production and their type. Although each company’s case is unique, but generally approaches to managing customer data and business needs do have weight. The choice of a prediction technique may depend on:
- Customer lifecycle stage. HubSpot specialists, for instance, concluded that the model choice may depend on the stage of interaction between a customer and a brand. “Customers in onboarding don’t usually display the same value metrics as those customers who have been using HubSpot for greater than a year. Thus, a model trained on customers older than one year may work really great for those customers, but not be accurate when applied to customers still in onboarding,” explains Michael of HubSpot.
- The need for output explanation. When company representatives (e.g. customer success managers) must understand the reasons for churn, so-called white box techniques like decision trees, random forest, or logistics regression can be used. Increased interpretability is one of the main reasons HubSpot opts for random forest. Sometimes it’s enough just to detect churn, for instance when company management needs to estimate budgeting for the next year while taking into consideration possible losses due to customer churn. In these cases, less interpretable models would work.
- Customer persona. Think of a company providing numerous products, each of them designed a specific user type. Since different customer personas may have typical behavior patterns, using dedicated models to predict the likelihood of them churning seems reasonable. Michael Redbord adds: “In a growing business, the nature of the customer base will evolve, especially when new products are introduced. Models built on one set of customers may not work as well when a new customer persona enters the customer base. Thus, when we’ve introduced a new product line we’ve typically built new models to predict churn of those customers.”
Deployment and monitoring
And now, the final stage of the churn prediction project workflow. The selected model/models need to be put into production. A model may be incorporated into existing software or become a core of a new program. However, the deploy-and-forget scenario won’t work: Data scientists must keep track of a model’s accuracy levels and improve it if needed.
“Predicting customer churn with machine learning and artificial intelligence is an iterative process that never ends. We monitor model performance and adjust features as necessary to improve accuracy when customer-facing teams give us feedback or new data becomes available. At the point of any human interaction – a support call, a CSM QBR [quarterly business review], a Sales discovery call – we monitor and log the human interpretation of customer help, which augments the machine learning models and increases the accuracy of our health prediction for each customer,” summarizes Michael.
The frequency with which a model performance is tested depends on how fast data becomes outdated in an organization.
Conclusion
Churn rate is a health indicator for subscription-based companies. The ability to identify customers that aren’t happy with provided solutions allows businesses to learn about product or pricing plan weak points, operation issues, as well as customer preferences and expectations to proactively reduce reasons for churn.
It’s important to define data sources and observation period to have a full picture of the history of customer interaction. Selection of the most significant features for a model would influence its predictive performance: The more qualitative the dataset, the more precise forecasts are.
Companies with a large customer base and numerous offerings would benefit from customer segmentation. The number and choice of ML models may also depend on segmentation results. Data scientists also need to monitor deployed models, and revise and adapt features to maintain the desired level of prediction accuracy.
Original. Reposted with permission.
Resources:
- On-line and web-based: Analytics, Data Mining, Data Science, Machine Learning education
- Software for Analytics, Data Science, Data Mining, and Machine Learning
Related:
- Data Science Projects Employers Want To See: How To Show A Business Impact
- The 7 Myths of Data Anonymisation
- Strategy: Customer Analytics: Are you Profiting from your Data?