Build an Effective Data Analytics Team and Project Ecosystem for Success
Apply these techniques to create a data analytics program that delivers solutions that delight end-users and meet their needs.
By Randy Runtsch, Data Analyst
Introduction
Over a long career in software development, information security, and data analytics, I have observed that large, complex, and overwhelming projects risk not meeting stakeholders’ needs unless they are exceptionally well-managed. In contrast, most of the successful data analytics projects that I have participated in have been small in scope, scale, team size, and timeline. Instead of taking years to complete, they typically take days, weeks, or several months and usually meet their end-users’ needs.
Sound management, agile practices, skilled practitioners, powerful tools, standards, and guidelines can combine to create a data analytics ecosystem that leads to short project life cycles and useful solutions. The following sections describe some of the organizational, project, and data analytics attributes and techniques my team has developed and leveraged to succeed. While we built our data analytics program within the risk management and internal audit functions of a large enterprise, you might be able to apply many of these techniques to your work environment as well.
Good Management and Leadership
I have observed many management and leadership styles over my 34 years in software development and data analytics, both good and bad. I have recently thrived while working with a manager who created a framework and guided our team to build a successful departmental data analytics program within a large enterprise. Based on experience and observation, here are some of the attributes and actions that he and other exemplary leaders bring to bear to help individuals, teams, and programs succeed:
- Set goals for the program and manage it and the team to achieve them.
- Identify required competencies and hire and train staff to fulfill them.
- Partner with internal and external organizations to share and learn best practices.
- Provide powerful software tools that fit the needs.
- Serve as a communication conduit to and from upper management.
- Partner with and care about the team and its members without being overbearing.
- Ensure that basic but adequate agreed-on standards, guidelines, and procedures are implemented and followed.
- Establish a rhythm for growth and achievement.
- Be respectful of each team member’s time and need to focus.
Hire and Develop Skills and Knowledge
Several years ago, I attended a data analytics conference where a presenter described some of the skills needed in her role as a data scientist. She said that over 200 skills were required to perform her job effectively. Indeed, creating successful data analytics solutions requires that analysts possess many talents. To hire and develop analysts with the needed skills and knowledge, you and your management might consider these steps:
- Write compelling job descriptions and postings — Develop job descriptions and postings that describe the skills and knowledge that the successful candidate must possess. Also, list the skills and knowledge that employees must develop while employed.
- Hire data analysts with expertise and good potential — Apply the job descriptions and postings to hire analysts with the required skills and knowledge and the aptitude and potential to develop additional required skills.
- Identify learning resources — create a list of courses and tutorials to help data analysts develop the skills and knowledge needed to succeed in their position.
- Assess skills — To measure the strengths and weaknesses of the team and its members, and to identify development and growth needs, assess the skills and knowledge of each data analyst against their job description and a list of competencies that goes into depth.
- Train analysts — Ensure that the work unit’s budget and schedule allow money and time for data analysts to complete training to develop needed skills and knowledge. Based on skill assessment results, ensure that analysts take training as defined in the learning resources list.
Keep Project Teams Small
Complicated projects with large teams can get bogged down unless expertly managed. Attempting to keep each project’s scale and scope small and limiting the team’s size to one to three end-users and one lead data analyst may help projects succeed. Teams can add data analysts to complex projects that would benefit from a division of labor or complementary skills. For large or complex projects, you may wish to assign a project manager to work with the team to identify and manage tasks, timelines, risks, and issues. Finally, seek out subject matter experts (SMEs) in the project’s business domain when needed.
Adopt Agile Practices
Project teams, especially in software development, often apply agile development methods, such as Scrum or Kanban, to their projects to organize tasks and move quickly. My team has effectively used a Kanban Board, developed in Microsoft OneNote, to track and communicate tasks among the group and its manager at frequent stand-up meetings. It consists of three columns on one page. Each task moves from Ready for Work to In Work when started and from In Work to Done when finished.
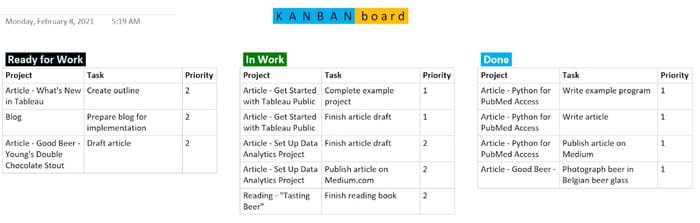
A simple Kanban Board can be used to manage project tasks. Image by the author.
Define Concise Scope, Goals, and Timeline
Conversations with end-users, teammates, and managers throughout the project life cycle are vital to establishing and holding to its agreed-on and concise scope, goals, and timeline. By keeping projects compact, I have succeeded consistently with projects between one week and three months long.
If a project is large and complicated, consider breaking it into smaller subprojects, each with a limited scope, goals, and timeline.
Assign a Reasonable Set of Competing Projects and Tasks to Data Analysts
Some researchers have found that when multitasking, human performance suffers. Assigning individuals a multitude of projects or tasks can be counterproductive. Also, while skill and task variety are job components that can improve individual satisfaction and performance (see job characteristics theory), the number of projects or tasks assigned to a worker should be reasonable to allow the worker to succeed and complete all of them.
Balance Teamwork with Autonomy
Working on a well-functioning team can provide many benefits, such as the following:
- Teammates may complement each others’ skill sets.
- Teammates can encourage and propel each other forward.
- Members of a team can share ideas and brainstorm to identify solutions.
- The productivity of the team may exceed the sum of its parts.
There are no doubts about the benefits of effective teamwork. On the other hand, some types of work, like data analytics, programming, and writing, are often best done by individuals who work semi-autonomously, usually with input from team members. Their jobs require focus and limited interruptions.
Adopt and Master Powerful and Versatile Tools and Languages
Data analysts should equip themselves with powerful and versatile data analytics tools that meet their needs. With this approach, analysts can leverage each tool’s features and develop competencies and best practices. The following sections describe each software package that my current team uses on its data analytics projects.
Alteryx Designer — According to Alteryx’s website, Designer can be used to “Automate every step of analytics, including data prep, blending, reporting, predictive analytics, and data science.” While a single-user license costs thousands of dollars, it is a powerful data analytics and data science tool. My team uses it to create and run workflows that input data, transform and prepare the data, and output the data in many formats. Analysts use it to create powerful and fast-running workflows quickly and easily.
Tableau — Tableau Software has created a powerful and perhaps the most popular business intelligence and data visualization platform. My team uses Tableau Desktop to connect to data sources and develop visual worksheets and dashboards. Then, we publish the visuals to Tableau Server, where end-users view and interact with them.
Python — Python is a user-friendly and powerful programming language popular among data analysts and data scientists. Unlike the statistics-centric R language that is also popular among data scientists, Python is a general-purpose language. It is free and easy to learn. Analysts can extend Python’s capabilities with freely available libraries, such as NumPy and TensorFlow.

Python programming language code sample. Image by the author.
SQL — Structured Query Language (SQL) is the standard language used to implement, manipulate, and query structured data stored in relational database management systems (RDBMS). It includes multiple sublanguages. With its Data Query Language (DQL), analysts can query and retrieve data from database tables. RDMS databases store massive datasets at enterprises around the world.
SQL (structured query language) code sample. Image by the author.
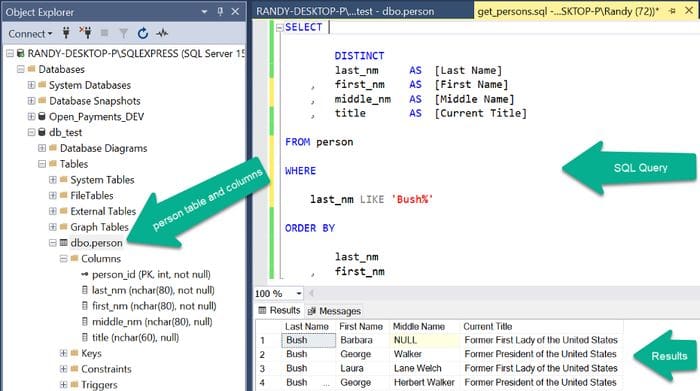
Microsoft SQL Server Management Studio (SSMS) — SSMS is Microsoft’s integrated development environment (IDE) used to manage and query databases implemented in its SQL Server RDBMS. Free and easy to learn, I use SSMS to create and run SQL code to query databases that contain needed data.

SQL Server Management Studio (SSMS) is used to manage Microsoft SQL Server databases and SQL code. Image by the author.
Rapid SQL — Rapid SQL is an IDE similar to SSMS and is used to develop SQL queries to access data stored in Oracle, SQL Server, DB2, and SAP Sybase databases. I use Rapid SQL to obtain data from DB2 or Oracle databases.
Microsoft Visual Studio — Visual Studio is Microsoft’s flagship integrated development environment (IDE). I use Visual Studio Professional to create applications written in Python and other programming languages. Its editor is powerful with color-coded syntax. Visual Studio Community 2019 is a free version of the IDE that may meet your needs. Visual Studio Code (VS Code) from Microsoft is another free IDE that is popular among programmers and data analysts.
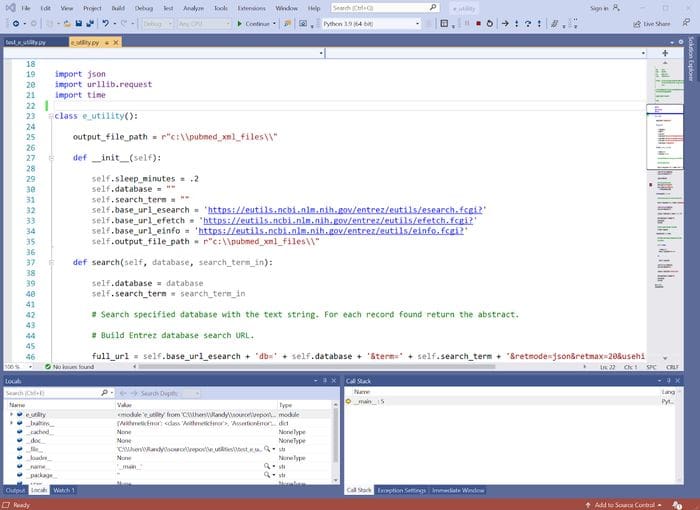
Microsoft Visual Studio Professional is an integrated development environment (IDE) used to write programs and develop applications. Image by the author.
Microsoft Excel — Excel is, of course, a ubiquitous, useful, powerful, and sometimes indispensable tool. I use Excel workbooks as project data sources and outputs to create small datasets, perform essential data cleansing and calculations, and much more. A spreadsheet application like Excel is a vital tool in any data analytics or data science shop.
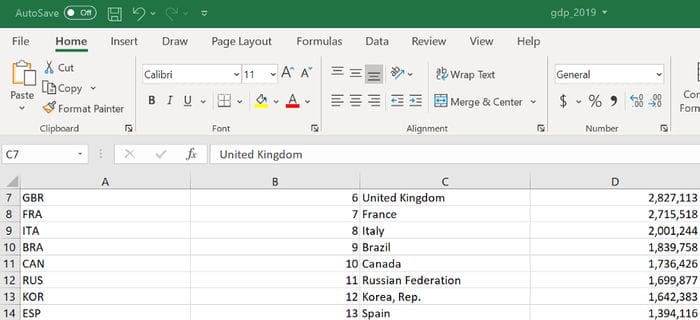
Spreadsheet applications, such as Microsoft Excel, are versatile data analytics tools. Image by the author.
Develop Basic Standards, Guidelines, and Procedures
Applying concise standards and guidelines to data analytics projects can benefit productivity and the maintenance and sharing of work products. Following are types of standards and guidelines that direct my work.
Naming standards — Standardizing how items such as file folders, files, database tables, columns, and fields make it easy to name them consistently and find work products in a collection of many products.
Folder structure standard and template — Using a standard folder structure for all projects makes it easy to set up new projects and find folders and files. My team uses the following folder structure template to organize and store work products for all data analytics projects:
- Project_name (change this value to the name of the project)
- alteryx_workflows
- data
- documentation
- python_programs
- sql_scripts
- tableau_workbooks
The folder structure expands and contracts based on the needs of each project.
Coding standards — Coding standards are applied to programming as grammar is to English prose. They help us to organize and convey thoughts clearly and consistently. Data analytics and software development teams that I have worked on have benefited from documented coding conventions. Applying these standards across projects can make each code module easier for its original coder to write and for any team member to read, understand, enhance, and maintain. Below are descriptions of some of the coding standards that my team uses to guide its work.
- Class, variable, and function naming conventions — For readability, we have decided to create all class, function, and variable names in lower case with each word or abbreviation separated by an underscore (“_”). Each class and variable name describes the types of values it stores, while each function name describes what the function does with what value(s) or object(s). For example, a variable that stores the name of a person might be called person_name or person_nm. A function that retrieves a list of person names from a database might be called get_person_names().
- Code module preamble — We begin each module with text to describe its purpose. To aid other coders who may maintain the module, we add additional information, such as the author’s name, database connection strings, file location information, and a change log.
- Comments — While some say that code documents itself, I believe that well-placed comments can help the coder organize their thoughts and help others who need to maintain or enhance the code understand it more quickly. For example, at its beginning, I describe what a function does with what data. I also add a brief comment before every logical grouping of code that performs a task.
- Whitespace — To make code easier to read, I insert a blank line between each function, each set of variable definitions, and each block of code that performs a specific task.
- Concise function scope and visible size — As with whitespace, I limit each function’s content to make it easier to code, understand, maintain, and enhance. I strive to keep each function simple and attempt to keep its contents visible in the editor (such as 80 characters across and 40 lines down).
Visualization style guidelines — While coding standards can help programmers understand, write, and maintain code, visualization style guidelines can help data analysts develop consistent, useful, and meaningful visuals. They can also benefit end-users across data analytics projects by providing consistent, well-designed, easy to understand, and user-friendly visuals. Following are some visual style guidelines adopted by my team.
- Brand standards — Our company’s brand management unit has identified a consistent set of typefaces, colors, and visual design styles and components. We have adopted these into our visualization guidelines to add professionalism and consistency and help provide end-users with a familiar user interface style.
- Typeface — Our company has designed a typeface that we will use when it’s available to us. Otherwise, our data analytics products will use the Ariel font by default.
- Colors — Our company’s brand standards include a small color palette. We apply those colors to charts, graphs, and dashboards when possible. We also try to limit the number of colors used on any chart, graph, or dashboard to a visually-pleasing set.
- Titles, headers, and labels — Our guidelines describe the standard locations, typefaces, sizes, and colors applied to textual elements, such as dashboard titles, graph and chart headers, columns, filters, and legends.
- Placement of visual components — As with text, our guidelines describe the standard locations on a dashboard of elements such as charts and graphs, filters, and legends.
Summary
It is not easy to build an effective data analytics team that regularly builds and delivers data analytics solutions that provide end-users with insights and help them make decisions. But applying some of the lessons and effective practices that I have learned, adopted, and developed over a long career in software development and data analytics might help you succeed.
Bio: Randy Runtsch is a data analyst, software developer, writer, photographer, cyclist, and adventurer. He and his wife live in southeastern Minnesota, U.S.A. Watch for Randy’s upcoming articles on public datasets to drive data analytics solutions, programming, data analytics, bicycle touring, beer, and more.
Original. Reposted with permission.
Related:
- Models of Data Science teams: Chess vs Checkers
- Six Tips on Building a Data Science Team at a Small Company
- The Missing Teams For Data Scientists