Want To Get Good At Time Series Forecasting? Predict The Weather
This article is designed to help the reader understand the components of a time series.
By Michael Grogan, Data Science Consultant
Source: Photo by geralt from Pixabay
For someone who originally comes from an economics background, it might seem quite strange that I would spend some time building models that can predict weather patterns.
I often questioned it myself — but there is a reason for it. Temperature patterns are one of the easiest time series to forecast.
Time Series Components
When a time series is decomposed — or broken into its individual elements — a series consists of the following components:
- Trend: The general direction of the time series over a significant period of time
- Seasonality: Patterns that frequently repeat themselves in a time series
- Random: Random fluctuations in a time series
When one thinks about it — the components of temperature data are very pronounced.
In most parts of the Northern Hemisphere at least, the general trend is for temperature to rise as one heads into the summer months, with a decreasing trend towards the winter months.
For instance, here is the mean temperature fluctuations for Dublin Airport, Ireland from 2015–2018, sourced from Met Éireann:

Source: RStudio
Decomposing this time series visually reveals the following:
Trend

Source: RStudio
Seasonal

Source: RStudio
Random
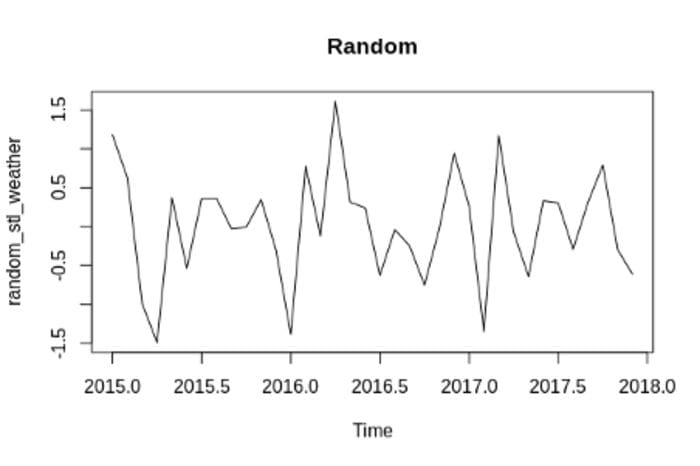
Source: RStudio
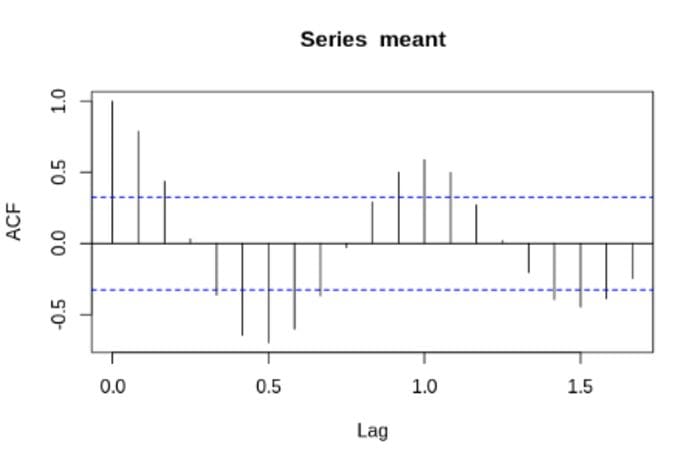
As we can see in the graph above, the seasonal patterns show clear evidence of a yearly cycle. For instance, an autocorrelation function reveals a strong correlation in temperature data every 12 months. This makes sense, as it stands to reason that temperatures in January will show the most correlation with recorded January temperatures in other years. Same when comparing temperatures across July, and so on.
Source: RStudio
An intuitive understanding of these components allows for a better appreciation of how they apply across other time series.
For instance, the seasonal pattern for air passenger numbers (at least before COVID-19) has been a higher incidence of air passengers in the summer months, with lower passengers on the whole for winter. Here is an example of passenger number fluctuations which was generated using data from San Francisco Open Data:

Source: Jupyter Notebook Output
Domain knowledge is also important in discerning the components of a time series. For instance, a data scientist who specialises in analysis of the energy markets would intuitively know that commercial electricity consumption tends to follow a weekly, rather than a yearly seasonal pattern. i.e. consumption tends to peak on days of high usage such as Monday, while decreasing significantly over the weekend.
Can A Time Series Be Forecasted In The First Place?
All too often, those who are new to time series analysis will attempt to forecast a series with a lot of inherent randomness present in the data.
For instance, stock prices tend to follow a very stochastic (or random) pattern. These time series are often driven by cyclicality rather than seasonality, whereby the peaks and troughs in the time series do not occur at specified intervals.
As such, while the overall trend may give a longer-term view of the stock’s direction — it still remains a lot harder to forecast the time series outright, as the patterns in the time series often do not repeat themselves.
That said, all too often — one might attempt to forecast a stock price using a model such as ARIMA without fully taking the time to understand the components of that time series. I’m also guilty of having made this mistake in the past.
Additionally, it is noteworthy that temperature data cannot be influenced by human intervention. However, many time series can (including stock prices), and as such, past data cannot account for these interventions.
Using a separate example, suppose I were to attempt to use Community Mobility data from Google to try and forecast mobility trends for a major city in six months time.
Such a forecast would make no sense — as it is completely dependent on factors external to the time series itself, i.e. government lockdowns, COVID-19 circulation, etc.
Conclusion
Strictly speaking, you don’t have to start with weather patterns when predicting a time series. However, you should start with a set of data that is easy to forecast and has predictable trend and seasonality patterns.
The big mistake that people make is in trying to forecast a time series that has a lot of inherent randomness baked in. Not only will you be unable to generate credible forecasts on such data, but terms such as autocorrelation function will make no intuitive sense to you.
Predicting a time series that is not influenced by external factors (temperature patterns being one of the very few) will allow you to better understand why factors such as autocorrelation, stationarity, and others are of theoretical relevance. Indeed, when it does come time to predict something more complex such as sales data — you will be better equipped to 1) understand the theoretical workings of the model and 2) the advantages and disadvantages of the use of different time series models with respect to the data.
Disclaimer: This article is written on an “as is” basis and without warranty. It was written with the intention of providing an overview of data science concepts, and should not be interpreted as professional advice. The findings and interpretations in this article are those of the author and are not endorsed by or affiliated with any third-party mentioned in this article.
Bio: Michael Grogan is a Data Science Consultant. He posesses expertise in time series analysis, statistics, Bayesian modeling, and machine learning with TensorFlow.
Original. Reposted with permission.
Related:
- Working With Time Series Using SQL
- Why Automated Feature Selection Has Its Risks
- Rejection Sampling with Python