The Lost Art of Decile Analysis
The goal of classification is a primary and widely-used application of machine learning algorithms. However, if careful consideration through additional analysis is not taken into the subtlety in the results of an even an apparently straightforward binary classifier, then the deeper meaning of your prediction may be obscured.
By Venkat Raman, Co-Founder Aryma Labs.

Image source: Unsplash
Binary Logistic Regression is used as a Classification algorithm when we want the response variable to be dichotomous (Churn/Not Churned, Pass/Fail, Spam/No spam etc.)
Usually, we make Logistic Regression into a classification algorithm by setting an appropriate probability cut-off or threshold (0.4, 0.5, 0.6 etc.).
The problem of classifying using a threshold value
Fixing the probability threshold is purely a business call and not a statistical one.
Frank Harrell, in his blog1 aptly, makes the point “classification is a forced choice”.
Now consider this example. You choose a threshold value of 0.5. The ML algorithm outputs the probability of default or no default (1- default, 0 — no default) for 4 customers as 0.51, 0.49, 0.23 and 0.92. Based on the threshold, 2 are classified as ‘default’ and 2 are classified as ‘no default’. However, ask yourself this, isn’t it too close to call for the customers with probability 0.51 and 0.49? 0.51 is surely closer to 0.49 (which is classified as no default) than it is to 0.92 (which is classified as default).
Some machine learning packages and low code tools don’t depict the predicted probabilities to the user explicitly. The user is hence oblivious to what predicted probabilities are gotten. They simply get the decision — default or no default (1 or 0). In the case of 0.49 and 0.51, the user happily made the decision that the person will not default and will default, respectively. But a peek inside the predicted probabilities reveals that it was too close to call!
The other problem with thresholds is that when we use an improper scoring rule like classification accuracy, it can be easily gamed. For example, if out of 100 people, 95 of them default on a loan, and 5 don’t. If the classifier classifies everyone to default on the loan, then it would have an accuracy of 95%!
So, is there a better way to use Logistic Regression?
Industries such as Finance and Marketing use Logistic Regression in a more appropriate way for Credit risk modelling and marketing campaign targeting, respectively.
A real use case
Let us say you are a CMO in charge of sales and marketing of a product in your organization. You plan to launch a marketing campaign to increase sales of that product. You have been given a fixed budget for this. Now you would like to get the best ROI possible, i.e., spend the exact fixed budget or even lesser and get the maximum sales possible. Here is what you have.
You have the data for 10,000 customers who had either purchased or not purchased a similar product in the past.
You would like to understand which customers should be targeted to increase the likelihood of purchase this time.
You would obviously like to target those people who are more likely to buy the product since you have a fixed budget for the campaign. How to go about it?
The answer is Decile Analysis.
So, What is a Decile Analysis?
Decile analysis was once a popularly used technique. However, the convention of teaching and bucketing machine learning problems into either ‘classification’ or ‘Regression’ types led people to forget the Decile analysis type analyses.
Many seasoned data scientists would recollect it by the name ‘Gains Chart.’ Decile Analysis is used to categorize a dataset from highest to lowest values or vice versa (based on predicted probabilities).
As evident from the name, the analysis involves dividing the dataset into ten equal groups. Each group should have the same no. of observations/customers.
It ranks customers in the order from most likely to respond to least likely to respond.
Here are the steps:
Step 1: Build a Logistic Regression model. In this case, the dependent variable was ‘probability of buying the product’ with 1 denoting purchased, 0 denoting not purchased. Also, the relevant independent variables were selected.
Step 2: Get the predicted probabilities from the Logistic Regression algorithm. Arrange the probabilities in descending order.
Step 3: Divide the whole dataset into 10 groups. Each group should contain an equal number of observations. So, if there are 10,000 records, each group would have 1,000 records/customers.
Step 4: Compute the percent of responders for each decile.
Step 5: Compute the response rate for each decile.
Step 6: Compute the lift for each decile.
The top decile would have customers who are most likely to respond, followed by decile 2, which would have customers who are next most likely to respond, and so on.
One major advantage of the decile analysis is that the probabilities and probability range are their own error measures. That is, if the top decile has the probability range 0.75–0.81, then then the probability of this person not buying the product, i.e., the error would be (1- [0.75–0.81], here ‘[]’ denotes the interval of values between 0.75–0.81 including 0.75 and 0.81).
The below table depicts a typical decile analysis output.
Table 1
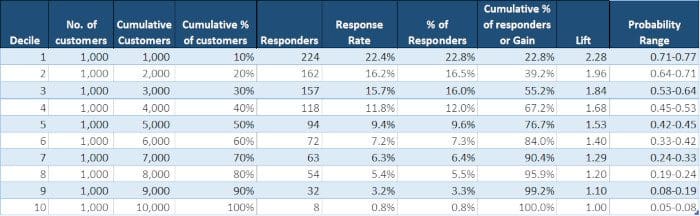
As stated earlier, each decile has an equal number of customers (1000 in each decile).
% of responders for each decile = No. of responders in that decile/ No. of total responders for all 10 deciles
Refer to Table 1:
- % of responders for Decile 1 = 224/984 = 22.8%
- 984 is the total no. of responders in all 10 deciles
- Similarly, % of responders for Decile 2 = 16.5% (162/984)
- And cumulative % of responders for top 2 deciles = 39.2%
Gains and Gain Chart
From Table 1, Decile 1 contains the top 10% of the customers who are most likely to buy. Decile 1 has the highest number of responders (224 responders).
So out of the total responders in all deciles, 22.8% of the responders are in Decile 1. So, for 10% of the customer base, there are 22.8% responses in Decile 1.
Similarly, for 20% of the customer base in decile 1 and decile 2, there are 39.2% responses.
The Gain Chart below explains this better.

A Gain Chart can be used to assess what % of customers respond in each decile. So, rather than targeting customers from lower deciles, customers can be picked up from the top deciles only.
The baseline tells how much % of customers would respond if we target customers randomly without a model.
Response Rate
The Response Rate tells what the percentage of customers who responded in each decile is. The response % is highest in Decile 1, followed by Decile 2, and so on.
Response Rate for each decile = No. of respondents in that decile / No. of customers in that decile
Refer to Table 1:
Here, Response Rate for Decile 1 = 224/ 1000 = 22.4%
The takeaway from Response Rates comparison: The Response Rate of each decile is depicted in the chart below. The average response rate of all deciles is 9.8%. So, customers from Decile 1 to Decile 4 lie above the average response rate and should be targeted for the campaign.

Lift and Lift Curve
Lift = cumulative % of responders / customers % at each decile
Refer to Table 1:
- Lift for Decile 1 = 22.8%/10% = 2.28
- Lift for Decile 2 = 39.2%/20% = 1.96
How to interpret: If we target the top two deciles, then we would target 20% of the customers. In the same deciles, the cumulative % of responders is 39.2%. Hence, there is a lift of 1.96.
A lift of 1 means there is no gain compared with the no. of customers targeted at random. Lift greater than 1 means the model approach is better than selecting the customers at random.
The takeaway from Lift Chart: This can be used to identify the deciles which have a higher Lift.

How to use Decile Analysis in business decision making
Now that we have done building Decile Analysis, the next pertinent question is how we use it to make effective business decisions:
Let us revisit our Decile Analysis Table:
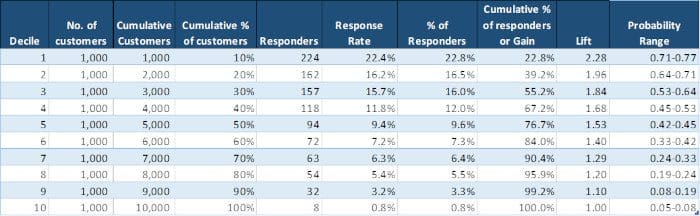
Going by the above results, we make a decision that we will target customers in the Top 4 deciles as they have a higher probability of buying the product.

From the business point of view, the ROI of targeting the Top 4 deciles is more. As we move down the decile, the ROI rapidly decreases and is not worthwhile pursuing these customers.
Important note: In this blog, we focus on decile analysis, but decile analysis can be further generalized by considering intervals smaller than 10%, for example, 5% or 1%. For simplicity of explanation, we limit ourselves to 10% steps (decile analysis), but generalization to smaller steps can be easily made.
So, that wraps up our decile analysis article. Your comments are welcome.
This article was co-authored by Ridhima Kumar and Venkat Raman, co-founders Aryma Labs.
Reference
https://www.fharrell.com/post/classification/
Related: