How Much Memory is your Machine Learning Code Consuming?
Learn how to quickly check the memory footprint of your machine learning function/module with one line of command. Generate a nice report too.

Image source: Pixabay
Why profile the memory usage?
Suppose you have written a cool machine learning (ML) app or created a shiny neural network model. Now you want to deploy this model over some web service or REST API.
Or, you might have developed this model based on data streams coming from industrial sensors in a manufacturing plant and now you have to deploy the model on one of the industrial control PCs to serve decisions based on continuously incoming data.

“Excited to have developed a shiny ML model”. Image source: Pixabay
As a data scientist, an extremely common question that you may expect from the engineering/platform team is “how much memory footprint does your model/code have?” or “what’s the peak memory usage by your code when running with some given data load?”
This is natural to wonder about because hardware resources may be limited and one single ML module should not hog all the memory of the system. This is particularly true for edge computing scenarios i.e. where the ML app may be running on the edge e.g. inside a virtualized container on an industrial PC.
Also, your model may be one of the hundreds of models running on that piece of hardware and you must have some idea about the peak memory usage because if a multitude of models peaks in their memory usage at the same time, it can crash the system.
Now, that got you wondering, didn’t it?

Image source: Pixabay
… hardware resources may be limited and one single ML module should not hog all the memory of the system. This is particularly true for edge computing scenarios…
Don’t make this cardinal mistake
Note, we are talking about the runtime memory profile (a dynamic quantity) of your entire code. This has nothing to do with the size or compression of your ML model (which you may have saved as a special object on the disk e.g. Scikit-learn Joblib dump, a simple Python Pickle dump, a TensorFlow HFD5, or likes).
Scalene: A neat little memory/CPU/GPU profiler
Here is an article about some older memory profilers to use with Python.
How To Manage Memory in Python
In this article, we will discuss Scalene — your one-stop shop for answering these questions, posed by your engineering team.
As per its GitHub page, “Scalene is a high-performance CPU, GPU and memory profiler for Python that does a number of things that other Python profilers do not and cannot do. It runs orders of magnitude faster than other profilers while delivering far more detailed information.”
It is developed at the Univ. of Massachusetts. Check this video for a comprehensive introduction.
Install
It’s a Python package after all. So, install usually,
pip install scaleneCurrently, works only for Linux OS. I did not test it on Windows 10.
Use on a CLI or inside a Jupyter Notebook
The use of Scalene is extremely straight-forward,
scalene <yourapp.py>Alternatively, you can use it inside the Jupyter notebook by using this magic command,
%load_ext scalene
Example output
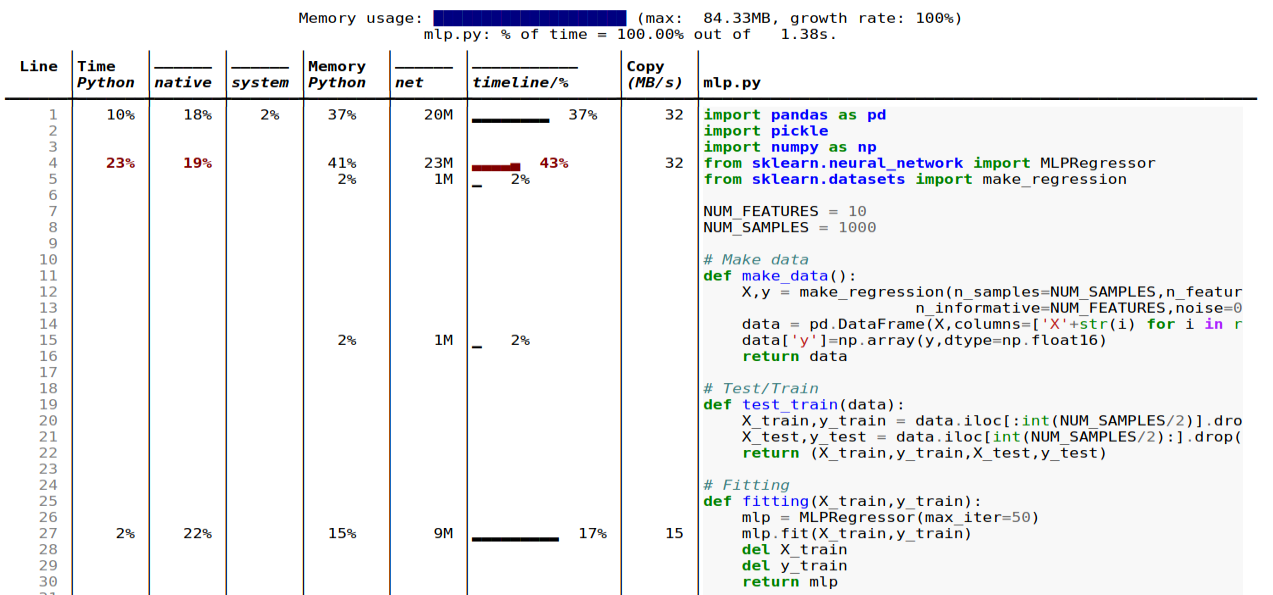
Here is an example output. We will delve deeper into this shortly.
Features
Here are some of the cool features of Scalene. Most of them are self-explanatory and can be gauged from the screenshot above,
- Lines or functions: Reports information both for entire functions and for every independent code line
- Threads: It supports Python threads.
- Multiprocessing: supports use of the
multiprocessinglibrary - Python vs. C time: Scalene breaks out time spent in Python vs. native code (e.g., libraries)
- System time: It distinguishes system time (e.g., sleeping or performing I/O operations)
- GPU: It also can report the time spent on an NVIDIA GPU (if present)
- Copy volume: It reports MBs of data being copied per second
- Detects leaks: Scalene can automatically pinpoint lines responsible for likely memory leaks!
A concrete machine learning code example
Let’s get down to the business of putting Scalene to use for memory profiling standard machine learning code. We will look at two different types of ML models — for reasons that will be clarified soon. We will use the Scikit-learn library for all three models and utilize its synthetic data generation function to create our dataset.
- A multiple linear regression model
- A deep neural network model with the same dataset
The modeling code follows the exact same structure for all three models. External I/O ops are also indicated in the following figure as we will see that they may or may not dominate the memory profile depending on the type of the model.
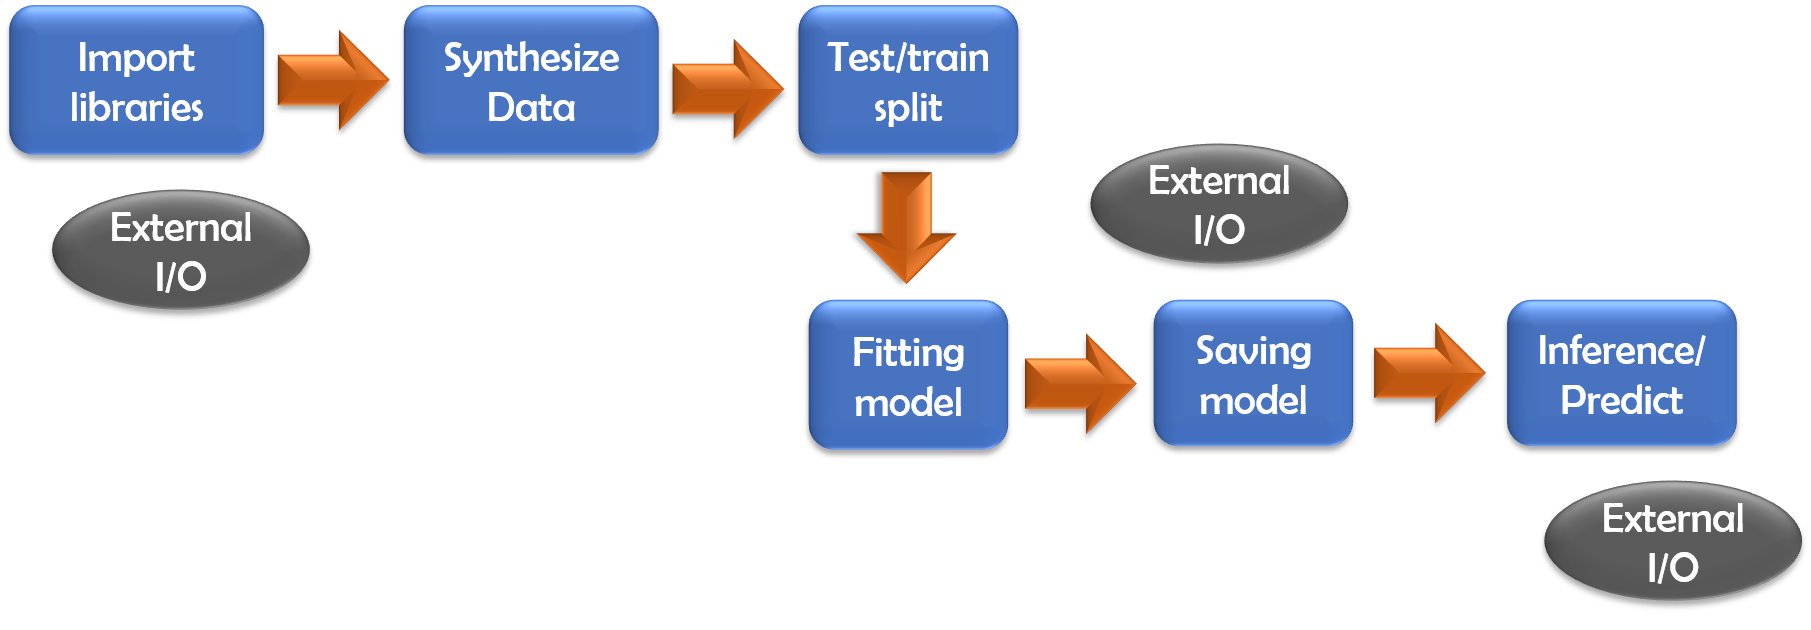
Image source: Author produced (owns the copyright)
Linear regression model
The code file is here in my GitHub repo.
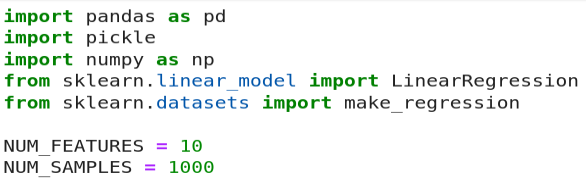
We use standard imports and two variables NUM_FEATURES and NUM_SMPLES for doing some experiments later.
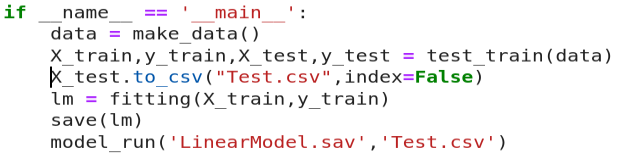
We are not showing the data generation and model fitting code. They are pretty standard and can be seen here. We save the fitted model as a pickled dump and load it along with a test CSV file for the inference.

We run everything under a main loop for clarity with Scalene execution and reporting (you will understand shortly).
When we run the command,
$ scalene linearmodel.py --html >> linearmodel-scalene.htmlWe get these results as output. Note, here I used the --html flag and piped the output to an HTML file for easy reporting.

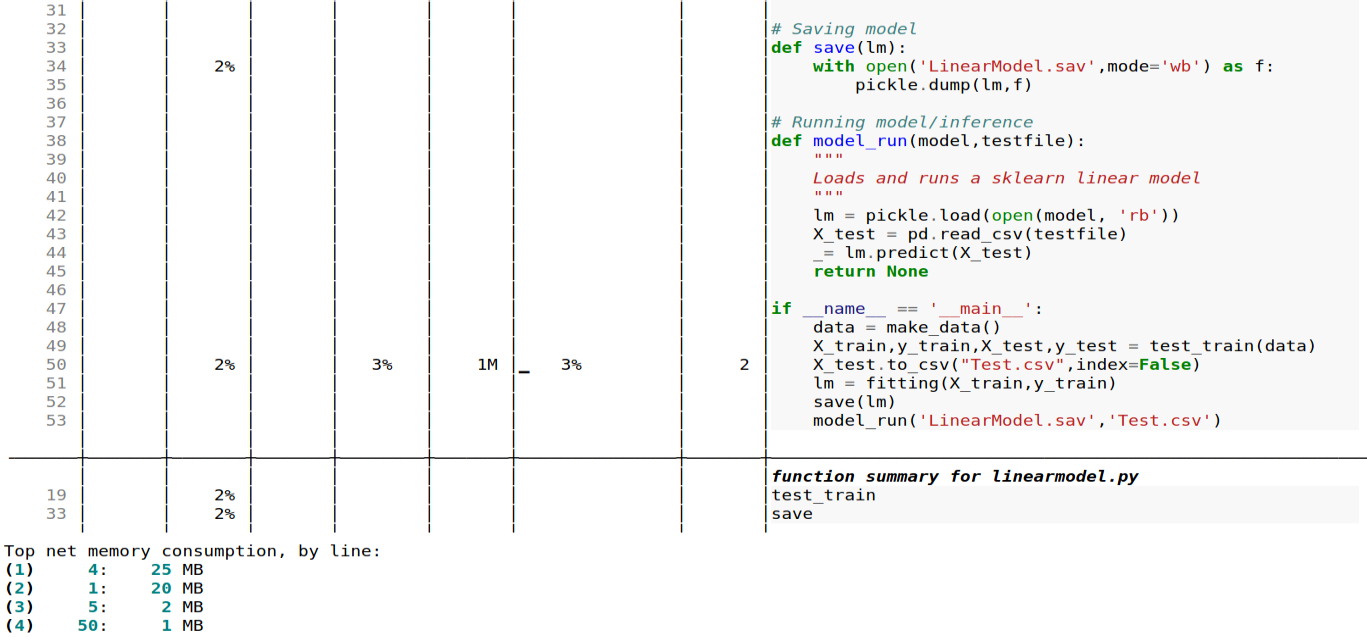
So, what is striking in this result?
The memory footprint is almost entirely dominated by the external I/O such as Pandas and Scikit-learn estimator loading and a tiny amount going to writing out the test data into a CSV file on the disk.
The actual ML modeling, Numpy or Pandas operations, and inference do not impact the memory at all!
What happens as the model and data scale?
We can scale the dataset size (number of rows) and the model complexity (number of features) and run the same memory profiling to document how the various operations behave in terms of memory consumption. The result is shown here.
Here the X-axis represents the # of features/# of data points as a pair. Note that this plot depicts percentage and not the absolute values to showcase the relative importance of the various types of operations.
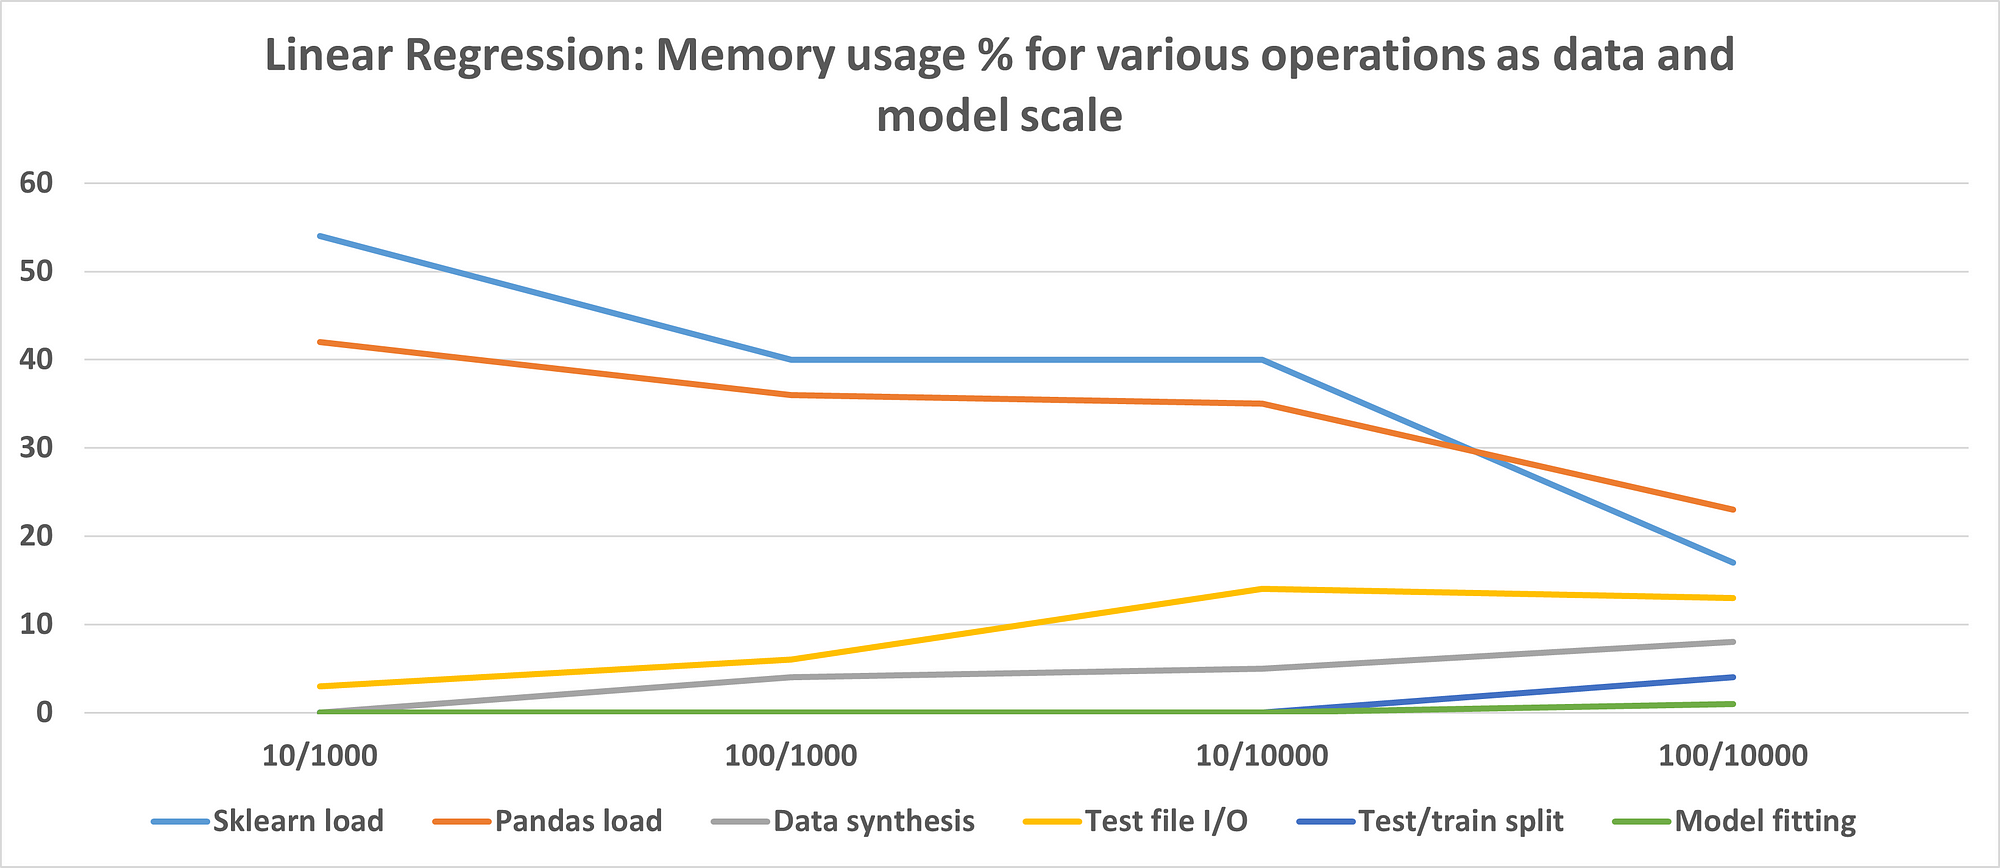
Image source: Author produced (owns the copyright)
So, for the linear regression model…
From these experiments, we conclude that a Scikit-learn linear regression estimator is quite efficient and does not consume much memory for actual model fitting or inference.
It does, however, have a fixed memory footprint in terms of the code and consumes that much while getting loaded. However, the percentage of that code footprint as a whole goes down as the data size and model complexity increase.
Therefore, if you are working with such a small linear model, then you may want to focus on data file I/O to optimize your code for better memory performance.
What happens with a deep neural network?
If we run similar experiments with a 2-hidden-layer neural network (with 50 neurons in each hidden layer), then the result looks like the following. The code file is here.
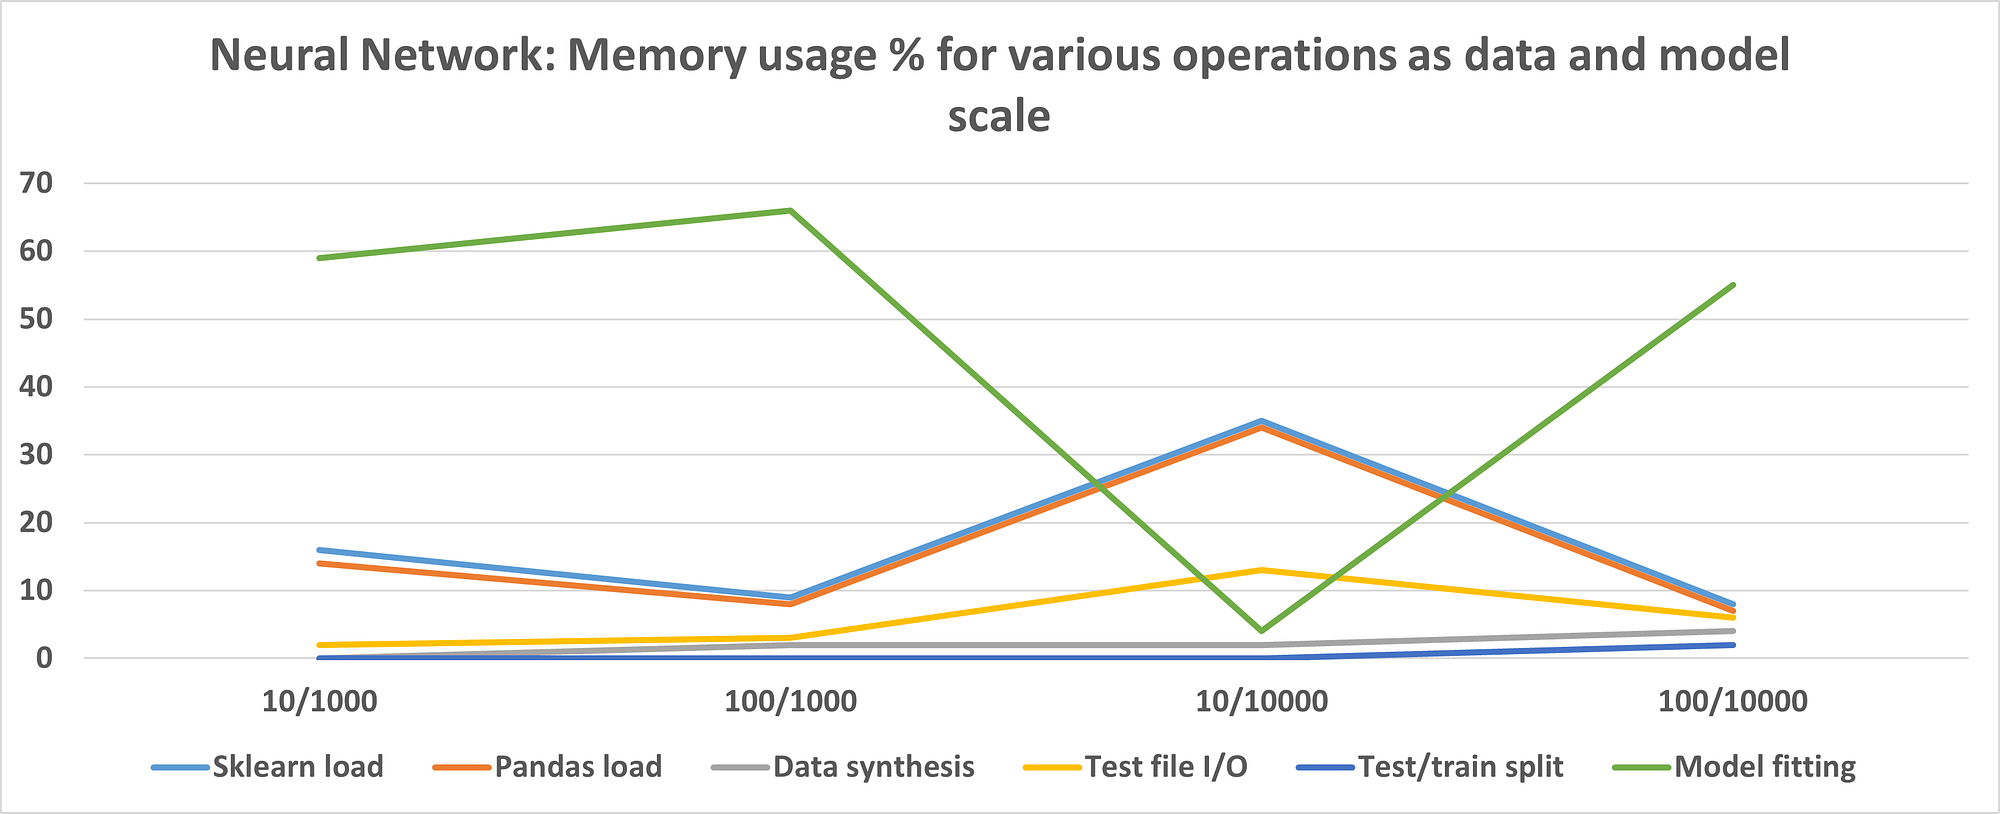
Image source: Author produced (owns the copyright)
Clearly, the neural network model consumes a lot of memory at the training/fitting step, unlike the linear regression model. However, for a small number of features and large data size, the fitting takes a low amount of memory.
You can also experiment with various architectures and hyperparameters and document the memory usage to arrive at the setting which works for your situation.
Follow the experimental approach
If you repeat the experiments with the same code files, the results will vary widely depending on your hardware, disk/ CPU/ GPU/ memory type. The purpose of this article is not to focus on the actual values or even on the trends. I want you to take away the approach to do memory profiling experiments for your own code.
Some key advice
- Preferably write small functions focused on one single task in your code
- Keep some free variables like the number of features and number of data points so that you can run the same code file with minimal changes to check the memory profile when the data/ model scales
- If you are comparing one ML algorithm to another, try to keep the structure and flow of the overall code as much identical as possible to reduce confusion. Preferably, just change the estimator class and compare the memory profiles.
- Data and model I/O (import statements, model persistence on the disk) can be surprisingly dominating in terms of memory footprint depending on your modeling scenario. Never ignore them while doing optimization.
- For the same reason above, consider comparing the memory profiles of the same algorithm from multiple implementation/packages (e.g. Keras vs. PyTorch vs. Scikit-learn). If memory optimization is your primary goal, you may have to look for the implementation that has a minimal memory footprint yet can do the job satisfactorily even if it is not the absolute best in terms of features or performance.
- If the data I/O becomes a bottleneck, explore faster options or other storage types e.g. replacing Pandas CSV by parquet file and Apache Arrow storage. Check this article,
How fast is reading Parquet file (with Arrow) vs. CSV with Pandas?
Other things you can do with Scalene
In this article, we just discussed the bare minimum memory profiling with a focus on a canonical ML modeling code. Scalene CLI has other options which you can take advantage of,
- profiling CPU time only and no memory profile
- reduced profiling with non-zero memory footprint only
- specifying CPU and memory allocation minimum thresholds
- setting the CPU sampling rate
- multithreading and check the difference
Final validation is sometimes necessary
For low-resource situations, it would be a good idea to host a validation environment/ server which will accept a given modeling code (when developed) and run it through such a memory profiler to create runtime statistics. If it passes pre-determined criteria of memory footprint, only then the modeling code will be accepted for further deployment.
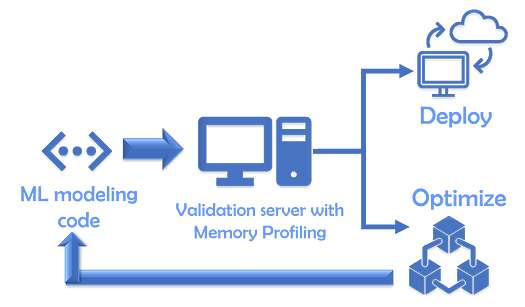
Image source: Author produced (owns the copyright)
If memory optimization is your primary goal, you may have to look for an implementation that has a minimal memory footprint yet can do the job satisfactorily.
Summary
In this article, we discussed the importance of memory profiling your ML code for smooth and easy interfacing with the platform/engineering team that will deploy the code on a service/machine. Profiling memory can also show you surprising ways to optimize the code based on the particular data and algorithms you are dealing with.
We showed a typical ML modeling code example being profiled with a powerful yet lightweight Python library Scalene. We demonstrated some representative results with linear regression and neural network models and also provided some general advice.
Hope you get more success in implementing and deploying your ML code into production using these tools and techniques.
You can check the author’s GitHub repositories for code, ideas, and resources in machine learning and data science. If you are, like me, passionate about AI/machine learning/data science, please feel free to add me on LinkedIn or follow me on Twitter.
Original. Reposted with permission.
Related:
- Managing Your Reusable Python Code as a Data Scientist
- 5 Python Data Processing Tips & Code Snippets
- GitHub Copilot: Your AI pair programmer – what is all the fuss about?