Introduction to Memory Profiling in Python
So where did all the memory go? To figure out, learn how to profile your Python code for memory usage using the memory-profiler package.

Image by Author
Profiling Python code is helpful to understand how the code works and identify opportunities for optimization. You’ve probably profiled your Python scripts for time-related metrics—measuring execution times of specific sections of code.
But profiling for memory—to understand memory allocation and deallocation during execution—is just as important. Because memory profiling can help identify memory leaks, resource utilization, and potential issues with scaling.
In this tutorial, we’ll explore profiling Python code for memory usage using the Python package memory-profiler.
Installing the memory-profiler Python Package
Let’s start by installing the memory-profiler Python package using pip:
pip3 install memory-profiler
Note: Install memory-profiler in a dedicated virtual environment for the project instead of in your global environment. We'll also be using the plotting capabilities available in memory-profiler to plot the memory usage, which requires matplotlib. So make sure you also have matplotlib installed in the project’s virtual environment.
Profiling Memory Usage with the @profile Decorator
Let's create a Python script (say main.py) with a function process_strs:
- The function creates two super long Python strings
str1andstr2and concatenates them. - The keyword argument
repscontrols the number of times the hardcoded strings are to be repeated to createstr1andstr2. And we give it a default value of 10**6 which will be used if the function called does not specify the value ofreps. - We then explicitly delete
str2. - The function returns the concatenated string
str3.
# main.py

from memory_profiler import profile

@profile
def process_strs(reps=10**6):
	str1 = 'python'*reps
	str2 = 'programmer'*reps
	str3 = str1 + str2
	del str2
	return str3

process_strs(reps=10**7)
Running the script should give you a similar output:
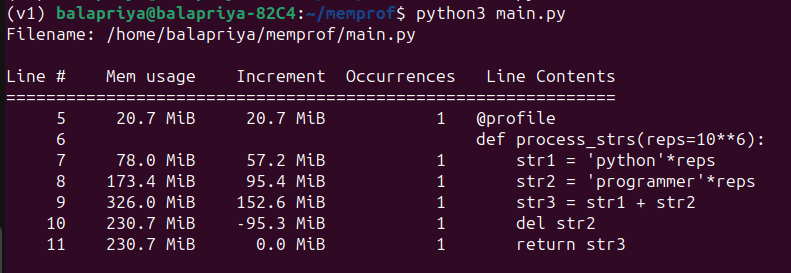
As seen in the output, we’re able to see the memory used, the increment with each subsequent string creation and the string deletion step freeing up some of the used memory.
Running the mprof command
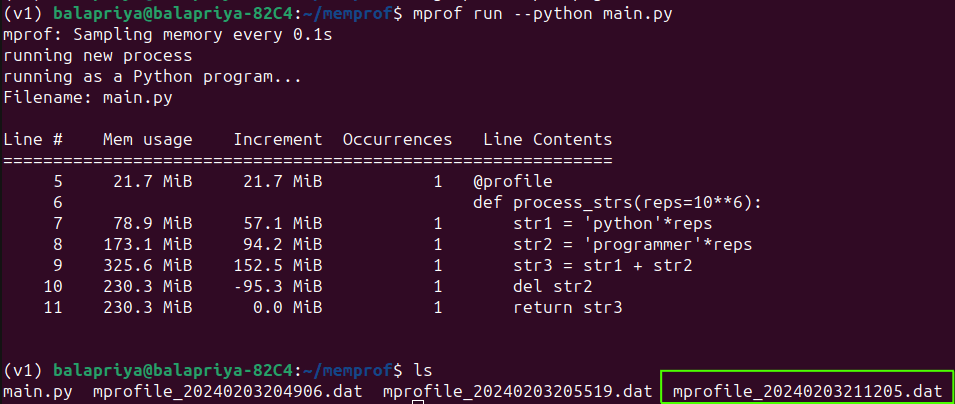
Instead of running the Python script as shown above, you can also run the mprof command like so:
mprof run --python main.py
When you run this command, you should also be able to see a .dat file with the memory usage data. You’ll have one .dat file every time you run the mprof command—identified by the timestamp.
Plotting Memory Usage
Sometimes it's easier to analyze memory usage from a plot instead of looking at numbers. Remember we discussed matplotlib being a required dependency to use the plotting capabilities.
You can use the mprof plot command to plot the data in the .dat file and save it to an image file (here output.png):
mprof plot -o output.png
By default, mprof plot used the data from the most recent run of the mprof command.
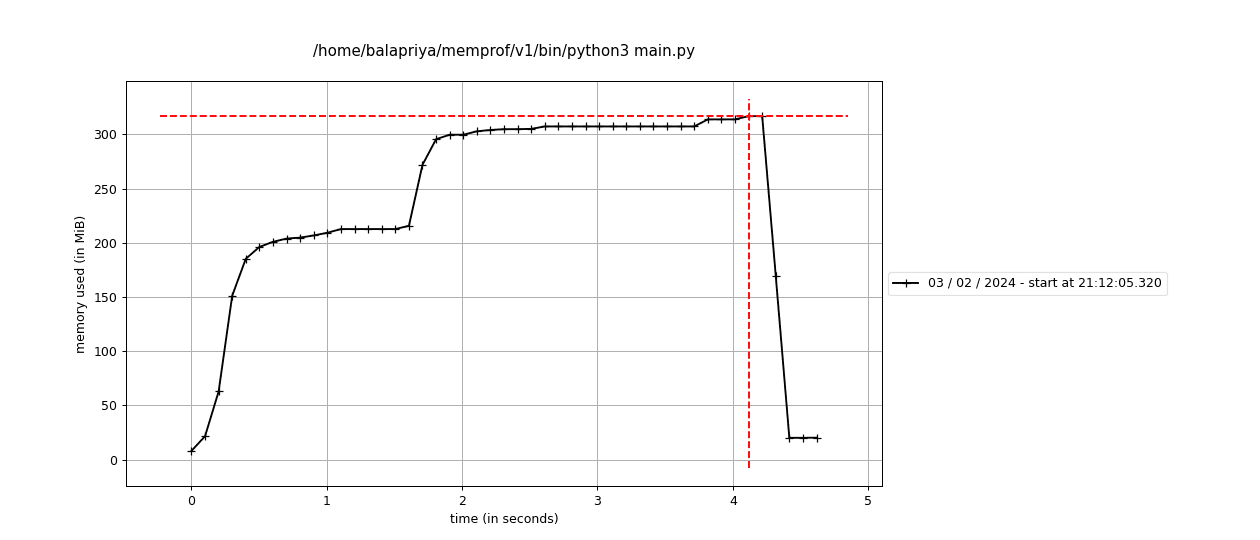
You can see the timestamps mentioned in the plot as well.
Logging Memory Usage Profile to a Log File
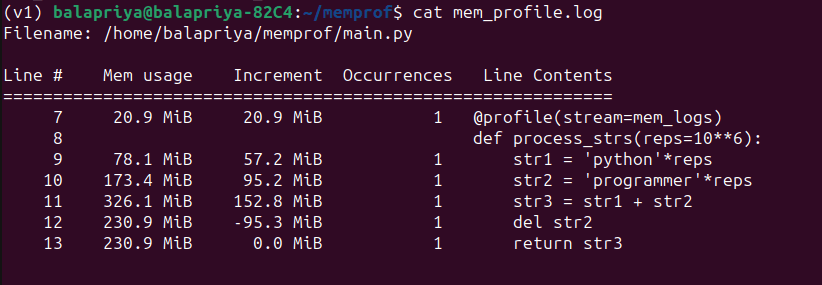
Alternatively, you can log the memory usage statistics to a preferred log file in the working directory. Here, we create a file handler mem_logs to the log file, and set the stream argument in the @profile decorator to the file handler:
# main.py

from memory_profiler import profile

mem_logs = open('mem_profile.log','a')

@profile(stream=mem_logs)
def process_strs(reps=10**6):
	str1 = 'python'*reps
	str2 = 'programmer'*reps
	str3 = str1 + str2
	del str2
	return str3

process_strs(reps=10**7)
When you now run the script, you should be able to see the mem_profile.log file in your working directory with the following contents:
Profiling Using the memory_usage Function
You can also use the memory_usage() function to understand the resources required for a specific function to execute—sampled at regular time intervals.
The memory_usage function takes in the function to profile, positional and keyword arguments as a tuple.
Here, we’d like to find the memory usage of the process_strs function with the keyword argument reps set to 10**7. We also set the sampling interval to 0.1 s:
# main.py

from memory_profiler import memory_usage

def process_strs(reps=10**6):
	str1 = 'python'*reps
	str2 = 'programmer'*reps
	str3 = str1 + str2
	del str2
	return str3

process_strs(reps=10**7)

mem_used = memory_usage((process_strs,(),{'reps':10**7}),interval=0.1)
print(mem_used)
Here’s the corresponding output:
Output >>>
[21.21875, 21.71875, 147.34375, 277.84375, 173.93359375]
You can also adjust the sampling interval based on how often you want the memory usage to be captured. As an example, we set the interval to 0.01 s; meaning we’ll now get a more granular view of the memory utilized.
# main.py

from memory_profiler import memory_usage

def process_strs(reps=10**6):
	str1 = 'python'*reps
	str2 = 'programmer'*reps
	str3 = str1 + str2
	del str2
	return str3

process_strs(reps=10**7)

mem_used = memory_usage((process_strs,(),{'reps':10**7}),interval=0.01)
print(mem_used)
You should be able to see a similar output:
Output >>>
[21.40234375, 21.90234375, 33.90234375, 46.40234375, 59.77734375, 72.90234375, 85.65234375, 98.40234375, 112.65234375, 127.02734375, 141.27734375, 155.65234375, 169.77734375, 184.02734375, 198.27734375, 212.52734375, 226.65234375, 240.40234375, 253.77734375, 266.52734375, 279.90234375, 293.65234375, 307.40234375, 321.27734375, 227.71875, 174.1171875]
Conclusion
In this tutorial, we learned how to get started with profiling Python scripts for memory usage.
Specifically, we learned how to do this using the memory-profiler package. We used the @profile decorator and the memory_usage() function to get the memory usage of a sample Python script. We also learned how to use the capabilities such as plotting the memory usage and capturing the stats in a log file.
If you’re interested in profiling your Python script for execution times, consider reading Profiling Python Code Using timeit and cProfile.
Bala Priya C is a developer and technical writer from India. She likes working at the intersection of math, programming, data science, and content creation. Her areas of interest and expertise include DevOps, data science, and natural language processing. She enjoys reading, writing, coding, and coffee! Currently, she's working on learning and sharing her knowledge with the developer community by authoring tutorials, how-to guides, opinion pieces, and more. Bala also creates engaging resource overviews and coding tutorials.