Building a Scalable ETL with SQL + Python
This post will look at building a modular ETL pipeline that transforms data with SQL and visualizes it with Python and R.
In this short post, we’ll build a modular ETL pipeline that transforms data with SQL and visualizes it with Python and R. This pipeline will be a fully scalable ETL pipeline in a cost-effective manner. It can be reproduced in some of your other projects. We’ll leverage an example dataset (StackExchange), see how to extract the data into a specific format, transform and clean it, and then load it into the database for downstream analysis like analyst reporting or ML predictions. If you’d like to go directly to a live example, you can check out the entire pipeline in the ETL template here. I’ll review some of the principles that are in this template, and provide a deeper look into how to achieve those.
The main concepts we’ll cover:
- Connect to any database via Python.
- Templating SQL tasks
- Parallelization - running queries in parallel with Ploomber
- Orchestration through DAGs
Architecture Diagram
We’ll first start by reviewing the overall architecture of our pipeline with the dataset to understand better how it’s built and what we can achieve with this demo pipeline.
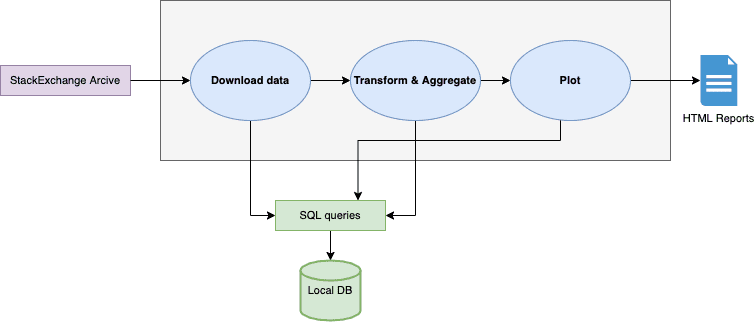
Here we can see the pipeline; it starts by extracting our dataset using and storing it (this snippet’s source can be found at preprocess/download.py):
url = 'https://archive.org/download/stackexchange/arduino.stackexchange.com.7z'
urllib.request.urlretrieve(url, product['zipped'])
Path(product['extracted']).mkdir(exist_ok=True)
Archive(product['zipped']).extractall(product['extracted'])
With Ploomber you can parameterize the paths and create dependencies on these paths. We can see how each output, like the extracted and zipped data, is saved back into the task’s path specified in the pipeline.yaml. Breaking this component into a modular piece allows us to develop faster. The next time the pipeline changes, we won’t have to rerun this task as its outputs are cached.
Extractions, Formating, and Aggregations
The next phase in our pipeline is to transform the raw data and aggregate it. We have configured the client once, through a get_client function (taken from the db.py):
def get_client(env):
  path = env.path.products_root / 'data.db'
  # create parent folders if they don't exist, otherwise sqlalchemy fails
  if not path.parent.exists():
      path.parent.mkdir(exist_ok=True, parents=True)
  return SQLAlchemyClient(f'sqlite:///{path}')
I then created SQL queries that leverage this client each time (we can see it’s a local DB, but it depends on the use case and can connect to anything SQLAlchemy supports). This same client can be used or another one can be used for the aggregations. In this pipeline, I took the raw data and push it into 3 different tables: users, comments, and posts. We’ll talk in the next section about which template I’ve used and how does it work.
SQL As Templates
Another capability in Ploomber is that users can just write the SQL queries, declare the inputs/output file and Ploomber dumps the data into the correct location. This can be completely automated through templates so you can have 1 or many clients, multiple input or output tables and it allows you to focus on actually writing SQL and not dealing with the DB client, connection strings, or custom scripts that can’t be reused.
The first example we’ll see relates to the previous section - uploading our CSVs as a table (this snippet is taken from the pipeline.yaml):
 - source: "{{path.products_root}}/data/Users.csv"
   name: upload-users
   class: SQLUpload
   product: [users, table]
   upstream: convert2csv
   to_sql_kwargs:
     if_exists: replace
We can see here that our source data is the users.csv we just got from our data extraction task, we’re using the SQLUpload class and uploading a users table. We’re creating each of these tasks for the three tables we’ve got: users, comments, and posts.
Now since the raw data was loaded into the database, we’d like to create some aggregations, to do so, we can continue with our users table example and see how to leverage .sql files within our pipeline:
- source: sql/upvotes-by-location.sql
  name: upvotes-by-location
  product: [upvotes_by_location, table]
  upstream: upload-users
We can see our source is the upvotes-by-location.sql (right below this paragraph), the output product is another table upvotes_by_location, and it depends on the upload-users task.
We can dive a level deeper to the source code in the ./sql folder:
DROP TABLE IF EXISTS {{product}};
CREATE TABLE {{product}} AS
SELECT Location, AVG(upvotes) AS mean_upvotes
FROM {{upstream['upload-users']}}
GROUP BY Location
HAVING AVG(upvotes) > 1
Here we’re overwriting the table (parameterized from the pipeline.yaml), grouping by location, and taking only users with 1+ votes. Separating these tasks and components of table uploads, aggregations and grouping will also allow us to parallelize our workflow and run faster - we’ll cover it next. The final step in our sample pipeline is a plotting task that takes those newly created tables and visualizes them.
Parallelization And Orchestration
Having this notion of a templatized project, orchestrating the tasks of SQL allows us to develop test, and deploy datasets for multiple purposes. In our example, we’re running on 3 tables with a limited number of rows and columns. In an enterprise setting, for instance, we can easily get to 20+ tables with millions of rows, which can become a real pain to run sequentially.
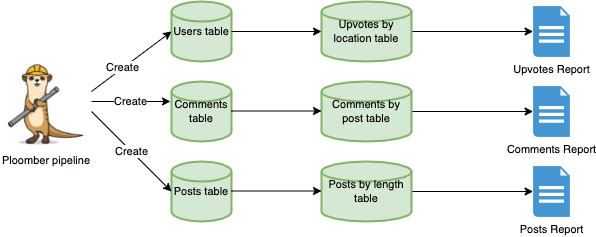
In our case, orchestration and parallelization helped us to focus on actual code which is the main task, not infrastructure. We’re able to generate those 3 independent workflows, run them in parallel and reduce our time for insights.
Conclusion
In this post I tried to cover most of the software engineering best practices Ploomber can offer through an ETL pipeline (SQL based), some of these concepts like modularity, code reusability, and portability can save a lot of time and improve the overall efficiency of your team. We’re always up for feedback and questions, make sure to give it a try yourself, and share your experiences. Please join our slack channel for further updates or questions!
Ido Michael co-founded Ploomber to help data scientists build faster. He'd been working at AWS leading data engineering/science teams. Single-handedly he built 100’s of data pipelines during those customer engagements together with his team. Originally from Israel, he came to NY for his MS at Columbia University. He focused on building Ploomber after he constantly found that projects dedicated about 30% of their time just to refactoring the dev work (prototype) into a production pipeline.