Simplify Data Processing with Pandas Pipeline
Write a single line of code to clean and process the data for analytics and machine learning tasks.
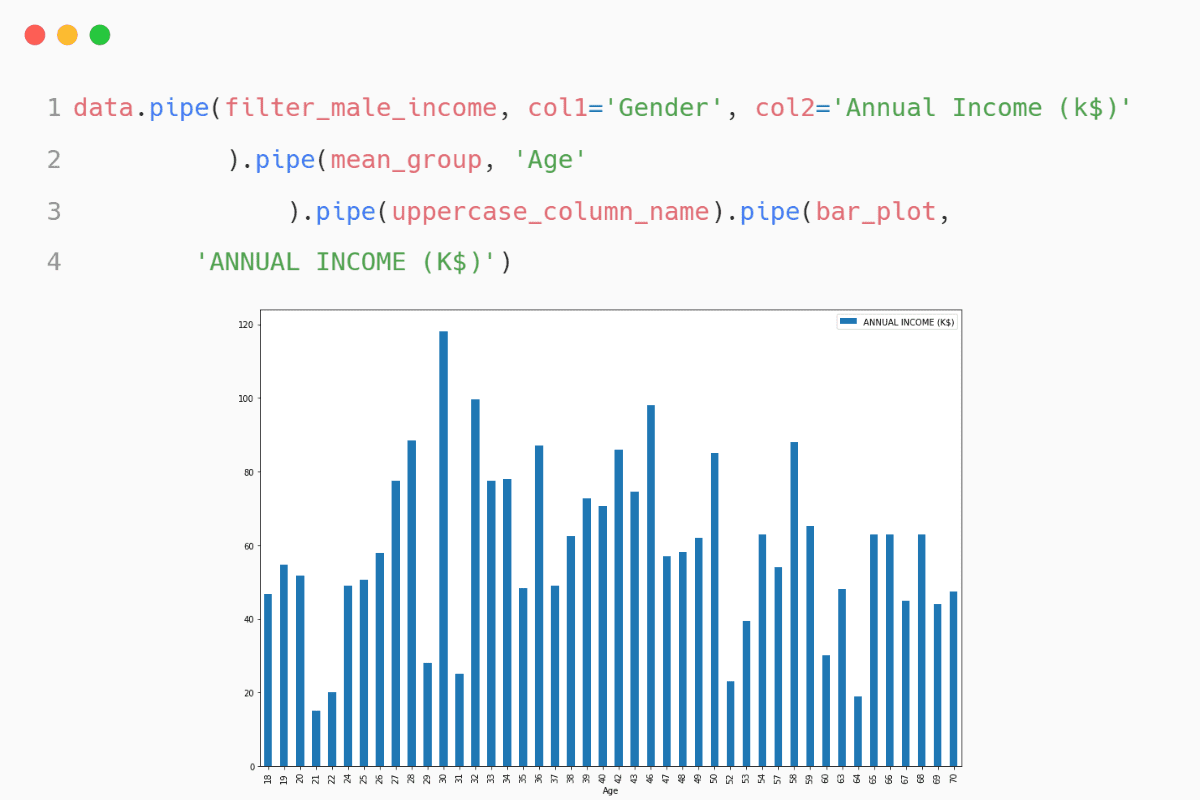
Image by Author
Introduction
In the R language, we use %>% to create pipelines and perform multiple operations on a dataset. Similarly, for creating a machine learning pipeline, we use scikit-learn’s Pipeline to process the data, build and evaluate the model. So, what do we use for creating data pipelines in Python? We use a pandas pipe to apply chainable functions.
Pandas Pipe Tutorial
In this tutorial, we will learn to create a pandas pipe and add multiple chainable functions to perform data processing and visualization.
We will be using the Deepnote environment to run the code and display sharp-looking pandas data frames.
Getting Started
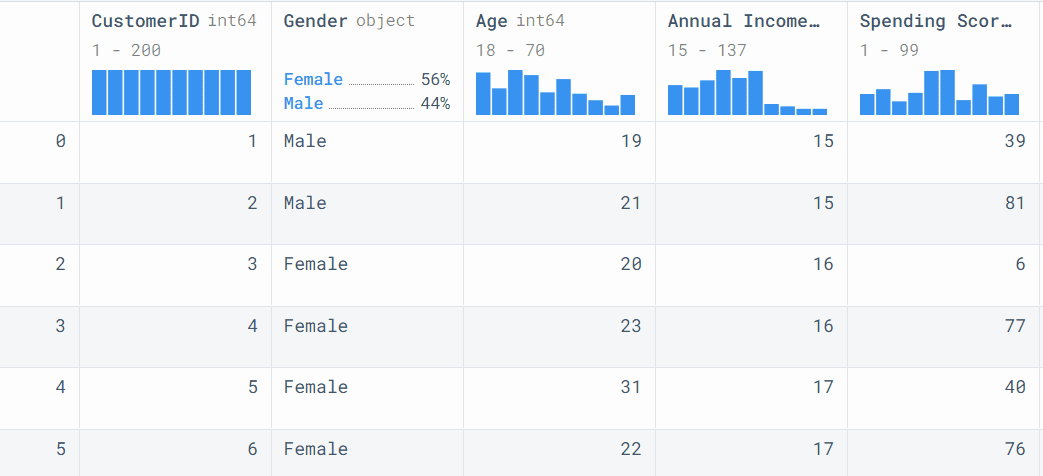
We will load and display the Mall Customer Segmentation dataset from Kaggle using `read_csv()`.
import pandas as pd

data = pd.read_csv("Mall_Customers.csv")
data
It contains customer ID, age, gender, income, and spending score.
Creating data processing functions
Now write the simple Python functions that take one or more than one arguments. Every function must have a dataframe as the first argument to create a chainable pipe.
- filter_male_income: the function takes two columns and filters the data for male customers with an annual income greater than 15.
- mean_group: it groups the dataframe on a single column with mean and drops the CustomerID column.
- uppercase_column_name: it transforms columns name to uppercase.
- bar_plot: the function uses the single columns and plots the bar chart. It is using `matplotlib.pyplot` on the back end.
# filtering by Gender and Annual Income
def filter_male_income(dataframe, col1,col2):
    return data[(data[col1] == "Male") & (data[col2] >= 15) ]

# groupby mean and dropping ID columns
def mean_group(dataframe, col):
    return dataframe.groupby(col).mean().drop("CustomerID",axis=1)

# changing column names to uppercase
def uppercase_column_name(dataframe):
    dataframe.columns = dataframe.columns.str.upper()
    return dataframe

# plot bar chart using pandas
def bar_plot(dataframe, col):
    return dataframe.plot(kind="bar", y=col, figsize=(15,10))
Pipeline with one function
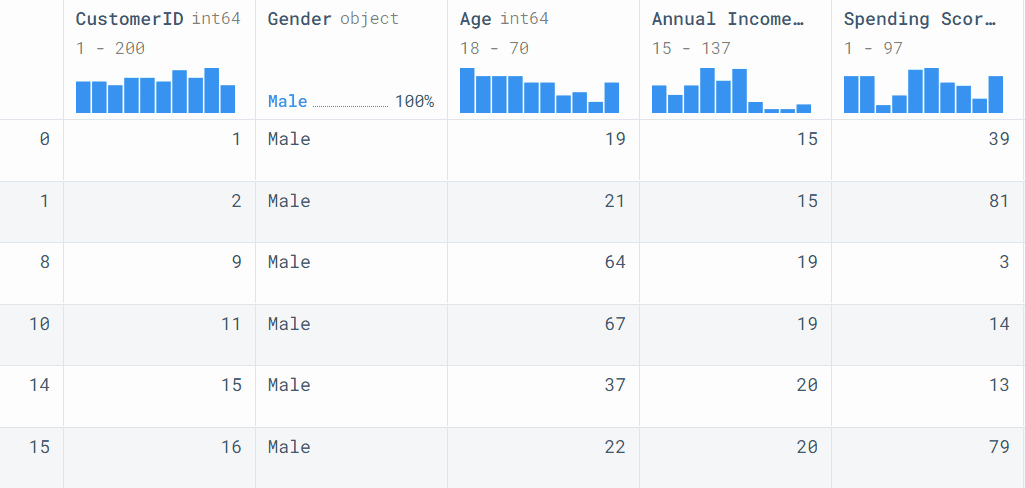
In this part, we will create a simple pipeline with a single function. We will add `.pipe()` after the pandas dataframe (data) and add a function with two arguments. In our case, the two columns are “Gender” and "Annual Income (k$)".
data.pipe(filter_male_income, col1="Gender", col2="Annual Income (k$)")
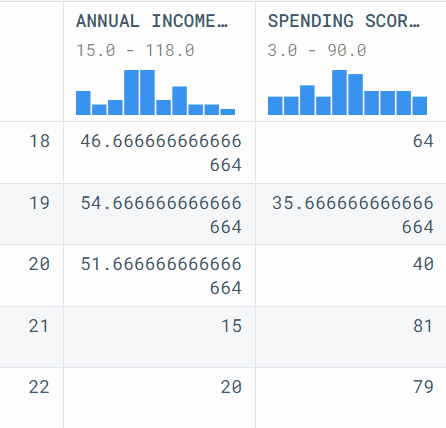
Pipeline with multiple functions
Let’s try a bit of a complex example and add 2 more functions into the pipeline. To add the other function, just add `.pipe()` after the first pipe function. We can add as many pipes into the data pipeline with multiple arguments. The results are reproducible, and the code is easily readable and clean.
In our case, we have filtered the dataset, grouped it by “Age”, and converted the column names to uppercase.
It is simple, just like initiating a Python function.
data.pipe(filter_male_income, col1="Gender", col2="Annual Income (k$)").pipe(
                mean_group, "Age"
                ).pipe(uppercase_column_name)
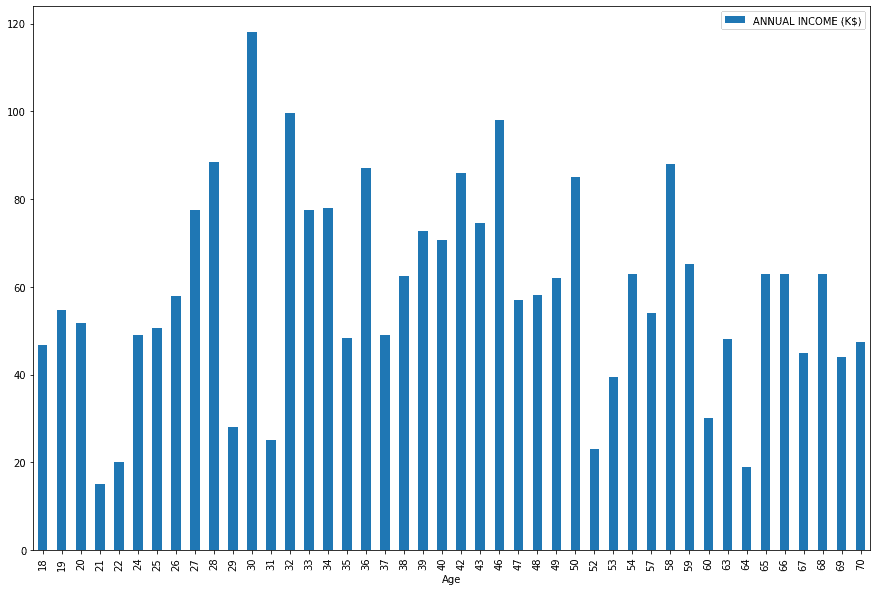
A complete pipeline
A complete pipeline processes the data and displays some analytical results. In our case, it is a simple bar chart of the customer’s Annual Income vs. Age. We have filtered the dataframe, grouped it by Age, converted the columns to uppercase, and plotted the bar chart.
data.pipe(filter_male_income, col1="Gender", col2="Annual Income (k$)").pipe(
                mean_group, "Age"
                ).pipe(uppercase_column_name).pipe(bar_plot,"ANNUAL INCOME (K$)")
Conclusion
The pipe can be applied to pandas dataframe and series. It is quite effective during data processing and the experimental stage. Where you can easily switch the functions to get an optimal solution. The pipe allows us to have a structure and organized way of combining multiple functions into a single operation. It is clean, readable, and reproducible. You can use it to simplify the data processing stage.
In the tutorial, we have learned about pandas pipe functions and their use case. We have also created multiple pipelines with single and multiple functions. The pipe functions can also be used for advanced processes such as data analytics, data visualization, and machine learning tasks.
Abid Ali Awan (@1abidaliawan) is a certified data scientist professional who loves building machine learning models. Currently, he is focusing on content creation and writing technical blogs on machine learning and data science technologies. Abid holds a Master's degree in Technology Management and a bachelor's degree in Telecommunication Engineering. His vision is to build an AI product using a graph neural network for students struggling with mental illness.