Type I and Type II Errors: What’s the Difference?
Looking to sort out the difference between Type I and Type II errors? Read on for more.

Image by Author
Key Takeaways
- Type I and Type II errors are very common in machine learning and statistics.
- Type I error occurs when the Null Hypothesis (H0) is mistakenly rejected. This is also referred to as the False Positive Error.
- Type II error occurs when a Null Hypothesis that is actually false is accepted. This is also referred to as the False Negative Error.
Let’s illustrate Type I and Type II errors using a binary classification machine learning spam filter. We will assume that we have a labelled dataset of N = 315 emails, 244 of which are labelled as spam, and 71 are not-spam. Supposed that we’ve built a machine learning classification algorithm to learn from this data. Now we would like to evaluate the performance of the machine learning model. How good was the model in correctly detecting the spam vs not-spam emails? We will assume that whenever the model predicts an email to be a spam email, the email will be deleted and saved in the spam folder. Let’s also assume that the spam class is the negative class, and not-spam the positive class. Let’s assume the performance of the machine learning model could be illustrated in the table below:
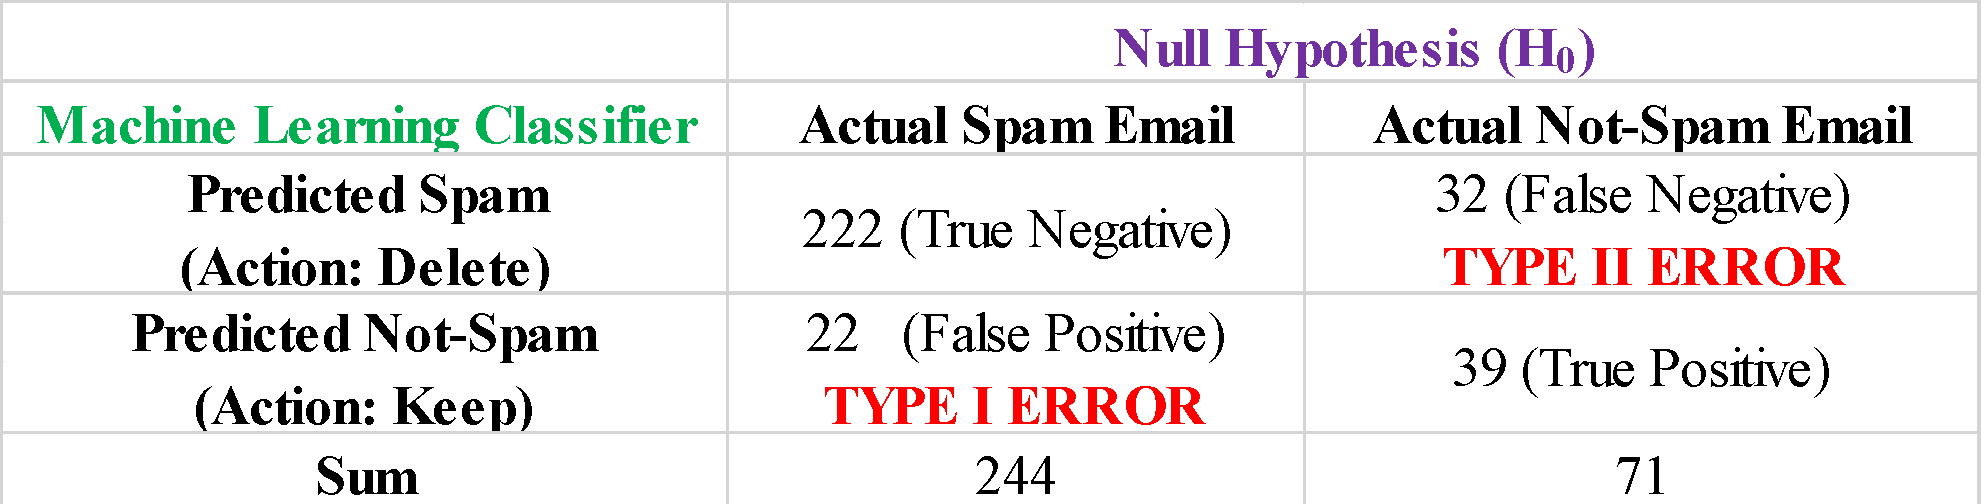
Type I Error (False Positive Error): We observe from the table that of the 244 spam emails, the model correctly predicted 222 as spam emails (True Negative), while 22 spam emails were incorrectly predicted as not-spam (False Positive). This means that based on this model, 22 spam emails will not be deleted. The Type I Error Rate or False Positive Rate is represented as and is given as

Type II Error (False Negative Error): We observe from the table that of the 71 not-spam emails, the model correctly predicted 39 as not-spam emails (True Positive), while 22 of the not-spam emails were incorrectly predicted as spam (False Negative). We see that the model will be deleting 32 emails that are not-spam emails. The Type II Error Rate or False Negative Rate is represented as and is given as
Total Model Error: We observe from the table above that there is a total of 54 misclassifications, out of the 315 labeled email datasets, that is 22 were false positives, and 32 were false negatives. The Total Error Rate is given as
For binary classification systems, the Total Error Rate is not a good metric. Instead, it is important to focus on the Type I and Type II error rates. In this illustration, it is important to keep the Type I error rate () to be low, so that spam emails are not incorrectly classified as normal not-spam emails and deleted. Similarly, it is important that the Type II error rate be minimized, so that normal not-spam emails are not mistaken for spam emails.
In summary, we’ve discussed the difference between Type I and Type II Errors. For more information on how Type I and Type II errors can be used in a binary classification system, please see this article: Bayes’ Theorem Explained.
Benjamin O. Tayo is a Physicist, Data Science Educator, and Writer, as well as the Owner of DataScienceHub. Previously, Benjamin was teaching Engineering and Physics at U. of Central Oklahoma, Grand Canyon U., and Pittsburgh State U.