Image by Editor
What is Skewness?
When you hear about distribution in relation to statistics, a lot of us will refer to the most common symmetrical bell curve which many of us are familiar with it being known as a normal distribution.
Skewness measures the asymmetry of a distribution. If the distribution is either shifted to the left or right - this means that it is skewed. It represents how a given distribution varies from a normal distribution - which is known to have a skew of zero.
A distribution can either be right (positive), left (negative), or at zero skewness. The tail of the distribution in positive and negative skews starts to move away from the median.

Source: Wikipedia
Zero skew
Zero skewness is symmetrical - the left and right side mirror one another. As I said, many of us will know this as normal distribution - however, the normal distribution is not the only form of distribution with zero skewness. If the distribution is symmetrical, it will have zero skew - for example uniform distribution.
When a distribution has zero skews, that tells us that the mean and median are equal.
Right skew
Right, skew is also known as positive skew. Positive skew has a longer or fatter tail on the right of the distribution. In a positive skew, the mean is typically greater than the median - this is due to values in the tail which naturally affect the mean more than the median.
Left skew
Left skew is also known as negative skew. Negative skew has a longer or fatter tail on the left of the distribution. In a negative skew, the mean will be less than the median.
How to calculate skewness?
The most common way to calculate skewness is by using the Pearson formula. There are two formulas that can be used:
Pearson’s first coefficient of skewness:
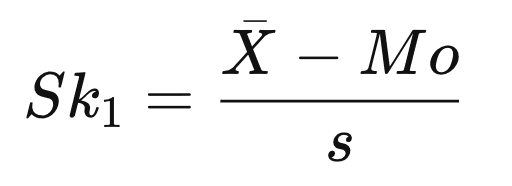
 = Pearson’s first coefficient of skewness
- = standard deviation
- = is the mean value
- =is the median value
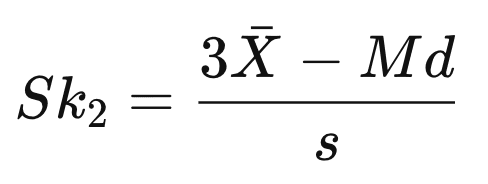
Pearson’s second coefficient of skewness:
What to do with skewed data?
When working with data and applying statistical tools - many hope for a normal distribution. However, that is not always the case and you may end up with skewed data. So what can you do with skewed data that requires a normal distribution?
Depends on the intensity of the skew
Depending on the intensity of your skewed data, you may not need to do anything at all. This is for skewed data that is mild or moderate.
Using a different model
You may need to use another model that does not aim for data that will be normally distributed. For example, you could choose a nonparametric test. These tests do not make assumptions about the data.
Transform
Transforming in the sense of statistical skew refers to applying the same function to all the observations of a variable. Your choice to transform your skewed data is dependent on the type of skew you are facing, for example, is it moderately skewed or is it very strongly skewed?
Wrapping it up
I hope this article helped you better understand what skewness is, the different types, how to calculate it, and what your next move should be when you come across skewed data.
If you want to know more about statistical terms explained, have a read of this: Descriptive Statistics Key Terms, Explained
Nisha Arya is a Data Scientist and Freelance Technical Writer. She is particularly interested in providing Data Science career advice or tutorials and theory based knowledge around Data Science. She also wishes to explore the different ways Artificial Intelligence is/can benefit the longevity of human life. A keen learner, seeking to broaden her tech knowledge and writing skills, whilst helping guide others.