From Data Collection to Model Deployment: 6 Stages of a Data Science Project
Here are 6 stages of a novel Data Science Project; From Data Collection to Model in Production, backed by research and examples.
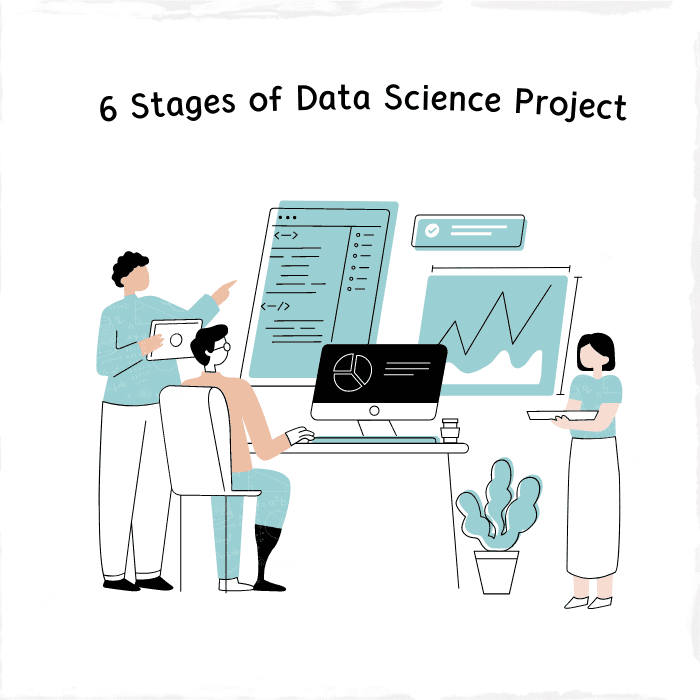
Image by Author
Data Science is a growing field. Let me support this with two different pieces of research.
The first one is by Linkedin, done in 2022. The study shows the fastest-growing job titles over the past 5 years. The Machine Learning Engineer title is the fourth fastest-growing job. It is a subbranch of Data Science.
As a data scientist, you have to build your own Machine Learning model and put it into production. Of course, you should know about web scraping, too, and all other stages of a data science project. You can find it all in the following parts of the article.
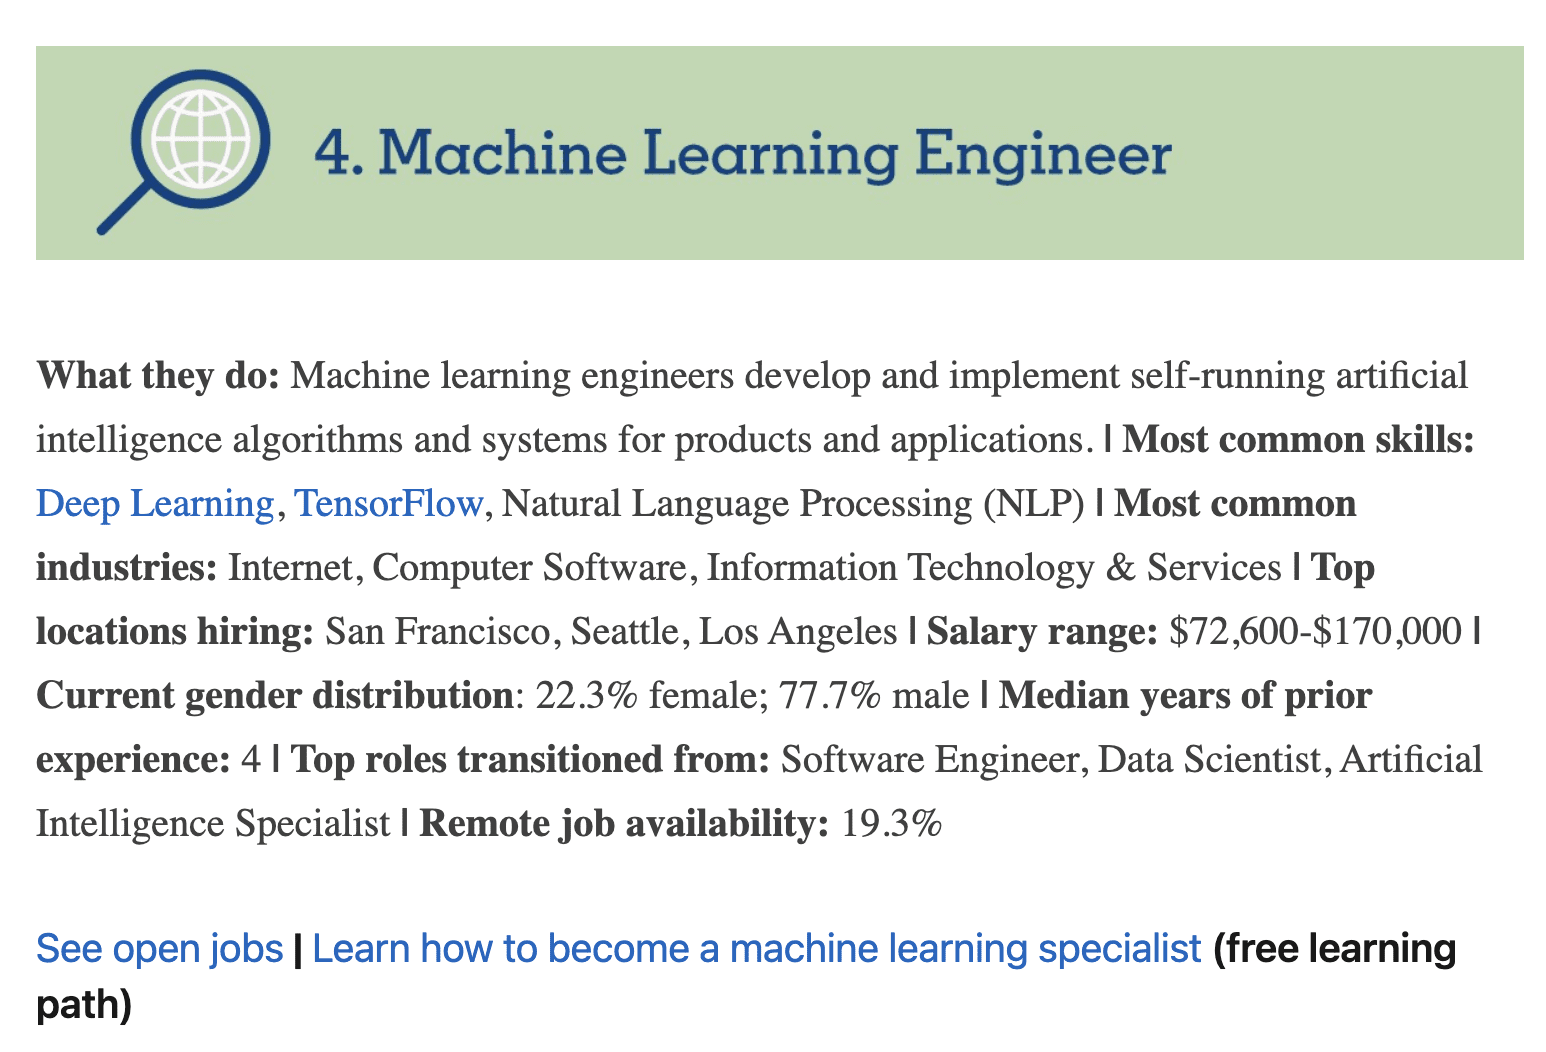
Image from LinkedIn
The second research comes from Glassdoor. It shows that data science is in the top three of the 50 best jobs in America. Also, it’s been the same for the last seven years. Let's see the statistics. 10,071 job openings and the 4.1/ 5 job satisfaction rate might be the reason behind being one of the best jobs. Also, the median base salary is $120,000 per year.
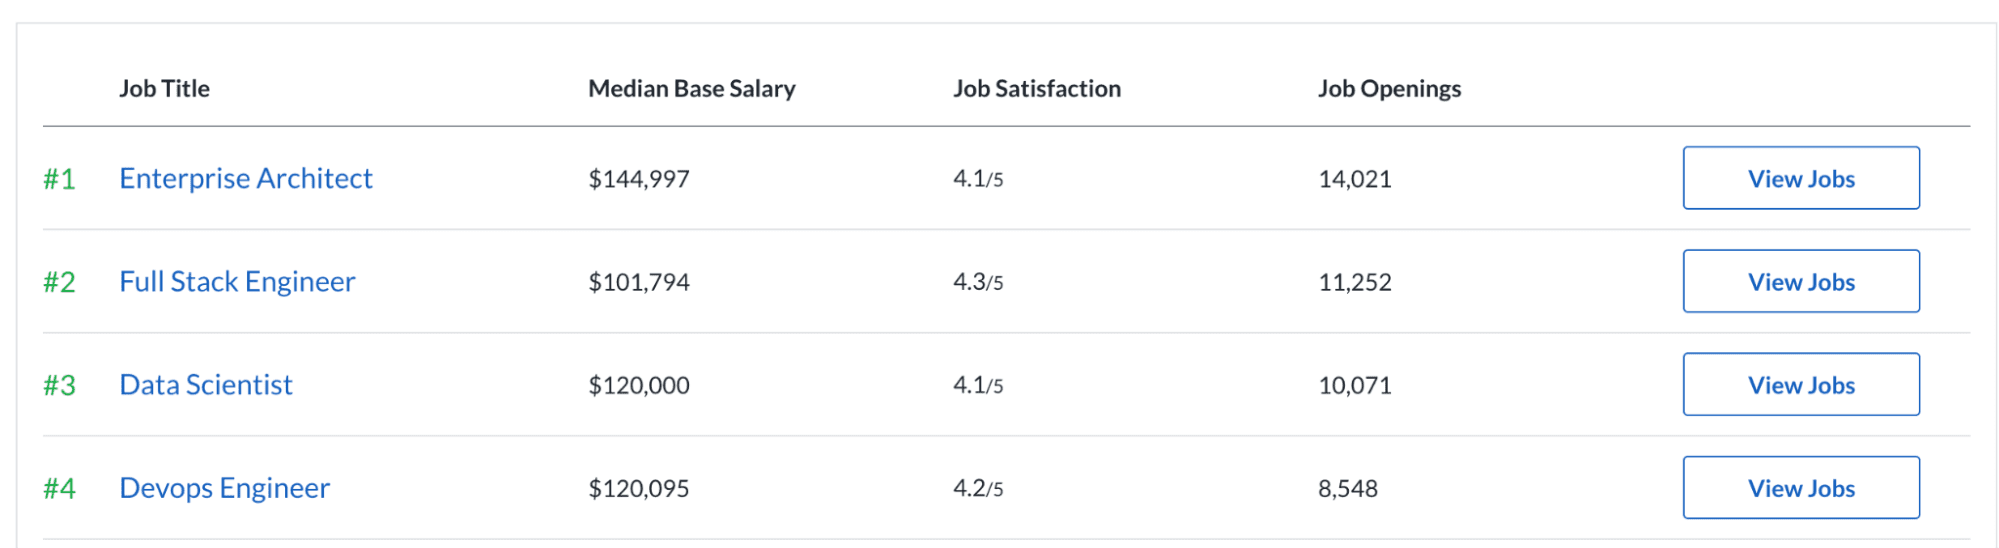
Image from Glassdoor
Now, it is more evident that data science is a growing field. And also, the demand in the industry looks promising.
Due to this demand, the options for learning Data Science are increasing. Online courses and websites are popular ways to learn Data Science concepts.
Choosing the Right Data Science Project
After mastering theory, doing real projects will make you ready for job interviews. It also helps enrich your portfolio.
Yet, the projects that junior developers are doing overlap often. For instance, house price prediction, identifying iris plants, or predicting the Titanic survivors. Even though they are useful projects, including these in your portfolio might not be the best idea.
Why?
Because the recruiter has very limited time to look at your CV. Here is another research that should make you more aware of this. It’s eye-tracking research done by ladders. This career site shows that recruiters look at your resume for just 6 seconds on average.
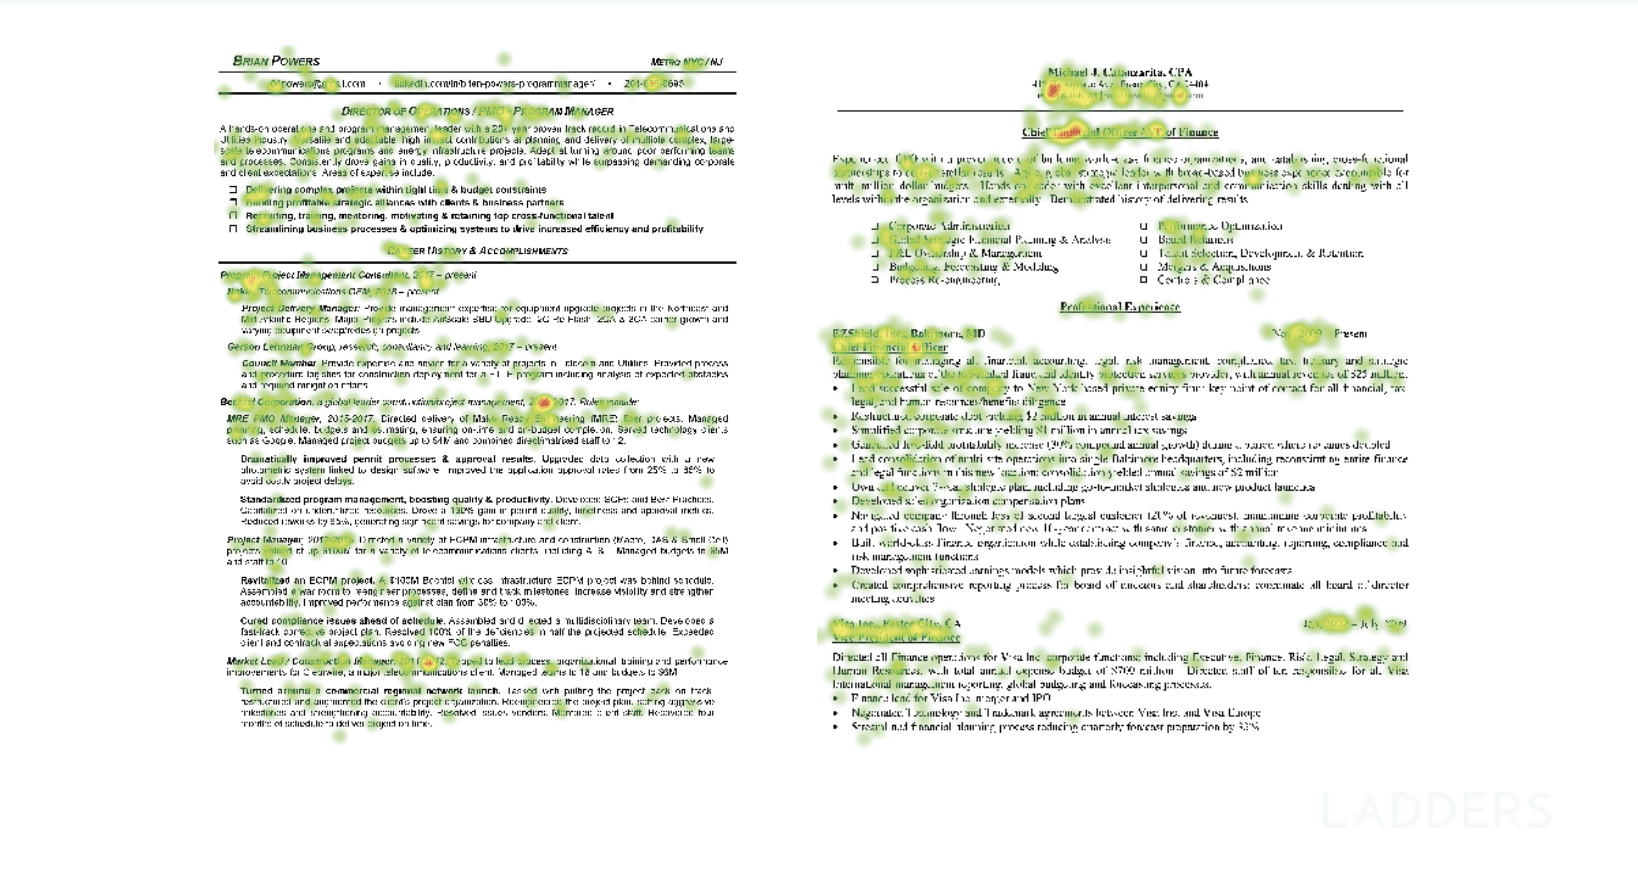
Image from theladders
Now, I already mentioned Data Science's popularity. Because of its popularity, many developers have already turned one step toward it. So that makes the field extremely competitive.
To differentiate yourself from others, you must do novel projects that will stand out. You must follow certain stages to make the best of these projects. That way, you’ll stand out both by doing projects that are different from others and by being thorough and systematic. In other words, you’ll attract the recruiter's attention and then keep it by showing them you know what you’re doing.
Here’s the overview of the project stages.
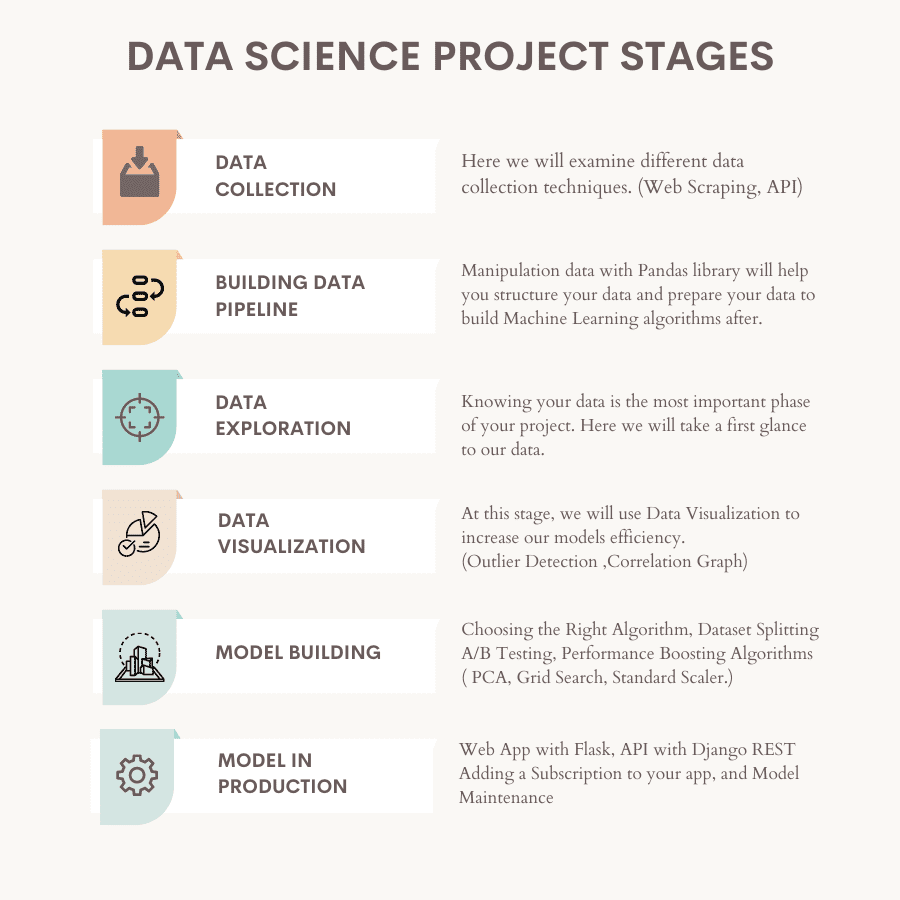
Image by Author
Let’s now have a look at each. I’ll also give you links to different projects and coding libraries. No need to reinvent the wheel in this case.
1. Data Collection
Image by Author
Data Collection is the process of gathering data from different sources. Over the last 10 years, the amount of data created by different sources has been growing.
By 2025 the amount of collected data will have increased to almost three times more than today.
Here is the research done by IDC, showing the changes in data created by its type.
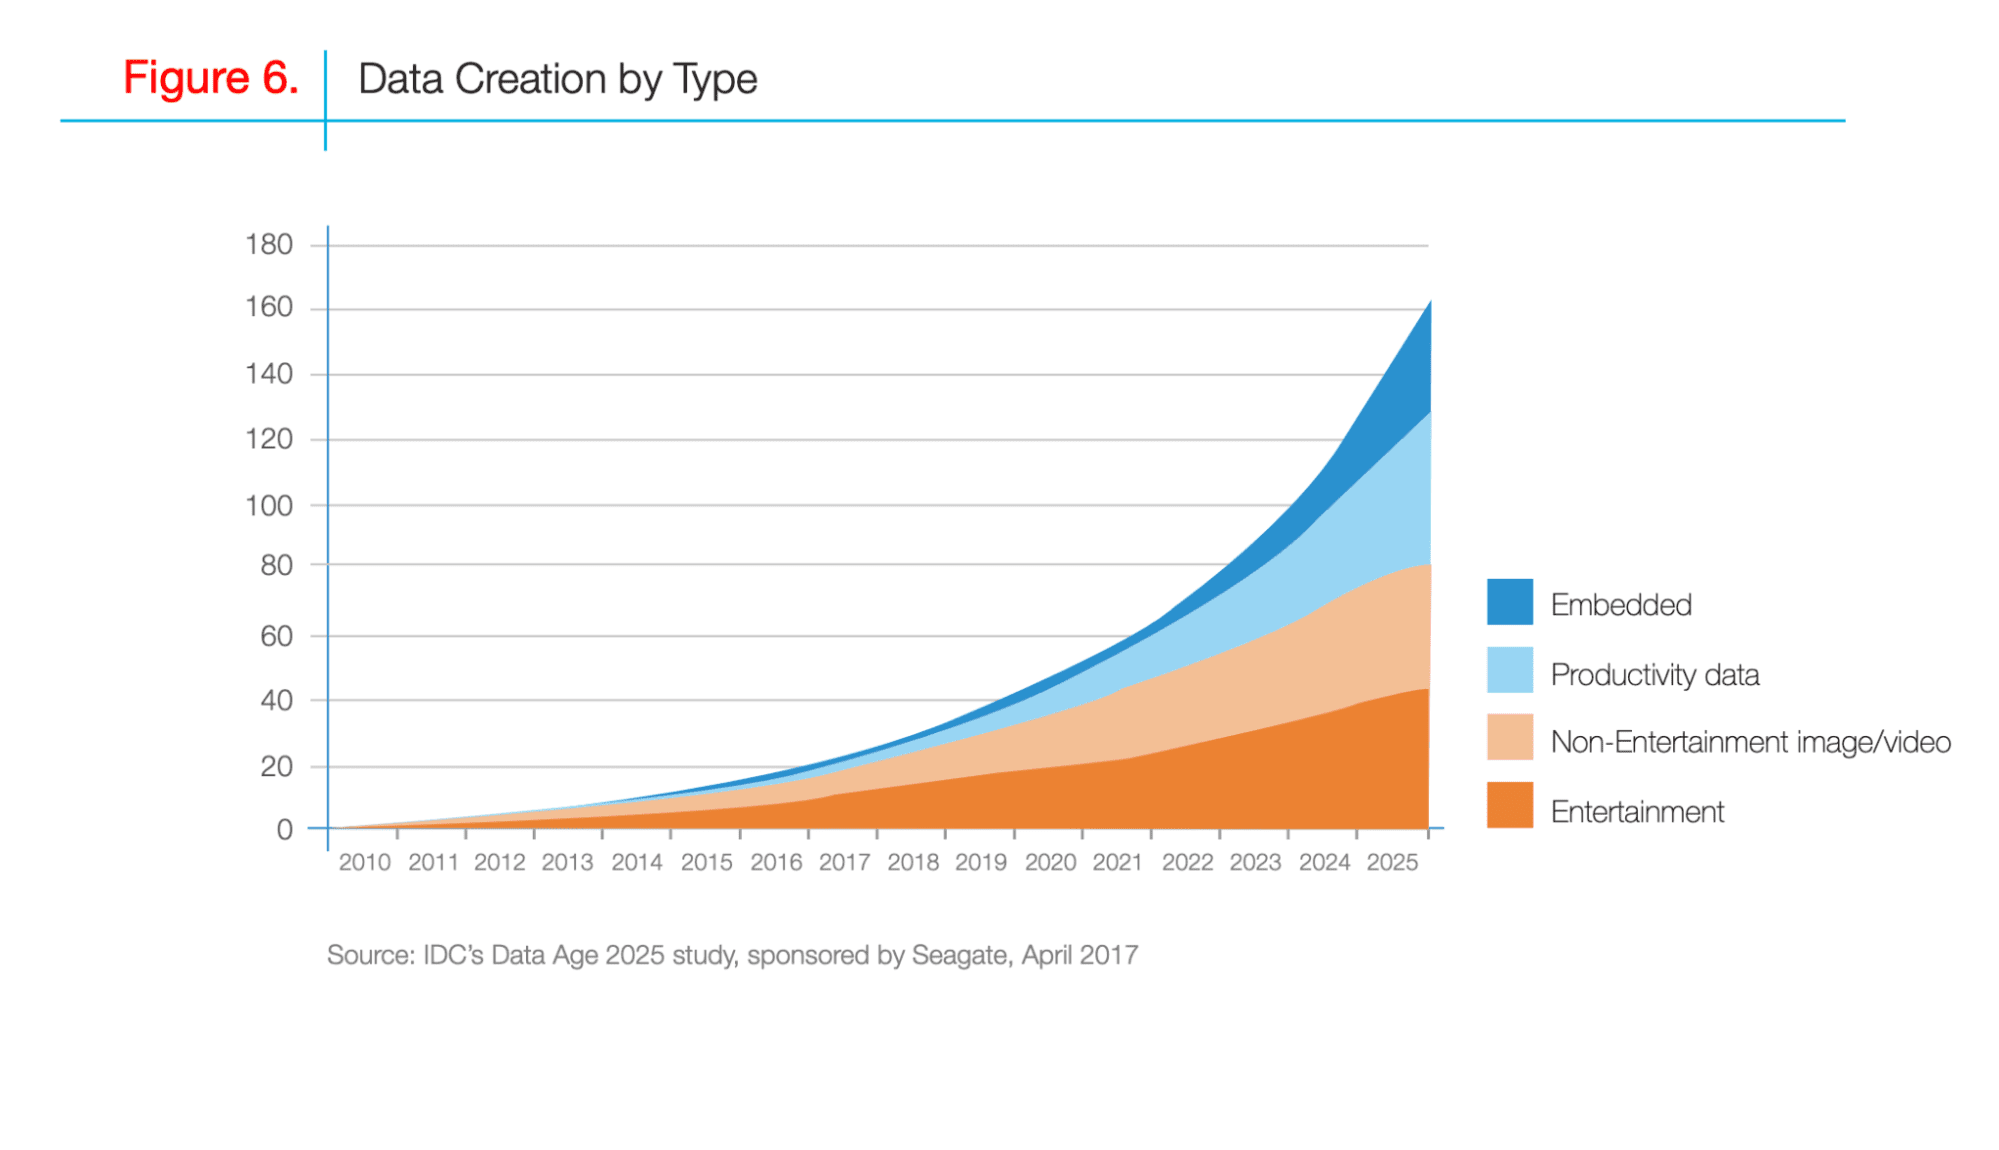
Image from import.io
It means the amount of data collected will continue to increase. This is the opportunity for businesses and developers to scrape even more data.
Why do you need more data?
After collecting data, the final stage will be model building and deploying it to production. So, increasing this model's performance will be highly important. One way to do this is by collecting more data. Here the main thing to focus on is how your model's performance can be improved as the amount of data increases.
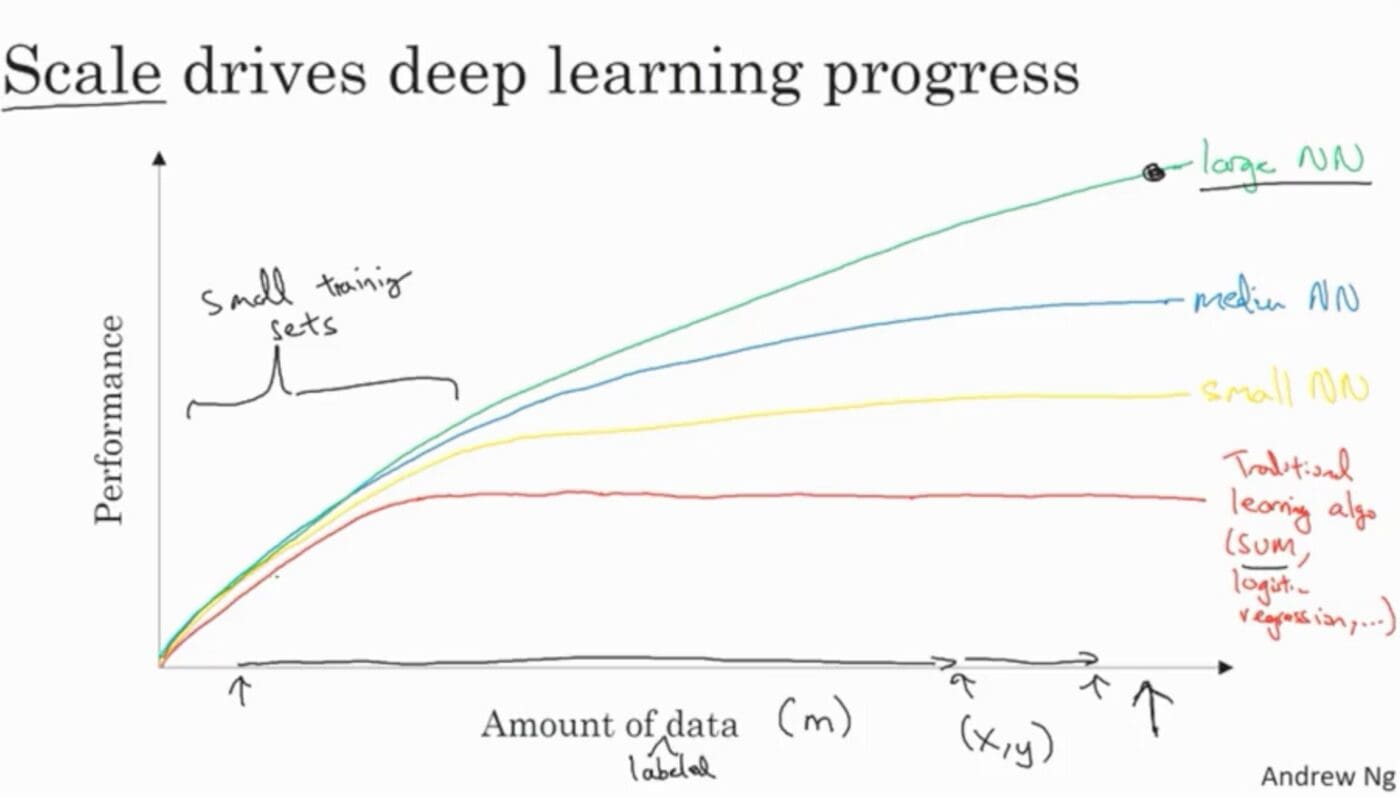
Image from Deeplearning.AI
Now, many different techniques exist to collect data. Here I will explain 3 of them: reading from different file sources, web scraping, and API.
Collecting Data From Different File Sources
Many websites and companies will present you with data in good shape. Yet reading that in your coding environment will need a couple of lines of code.
For example, this project aims to analyze the data of people who have huge debt yet have a hard time paying them off. As you can see, this project also starts with reading data by using the read_csv function in pandas.
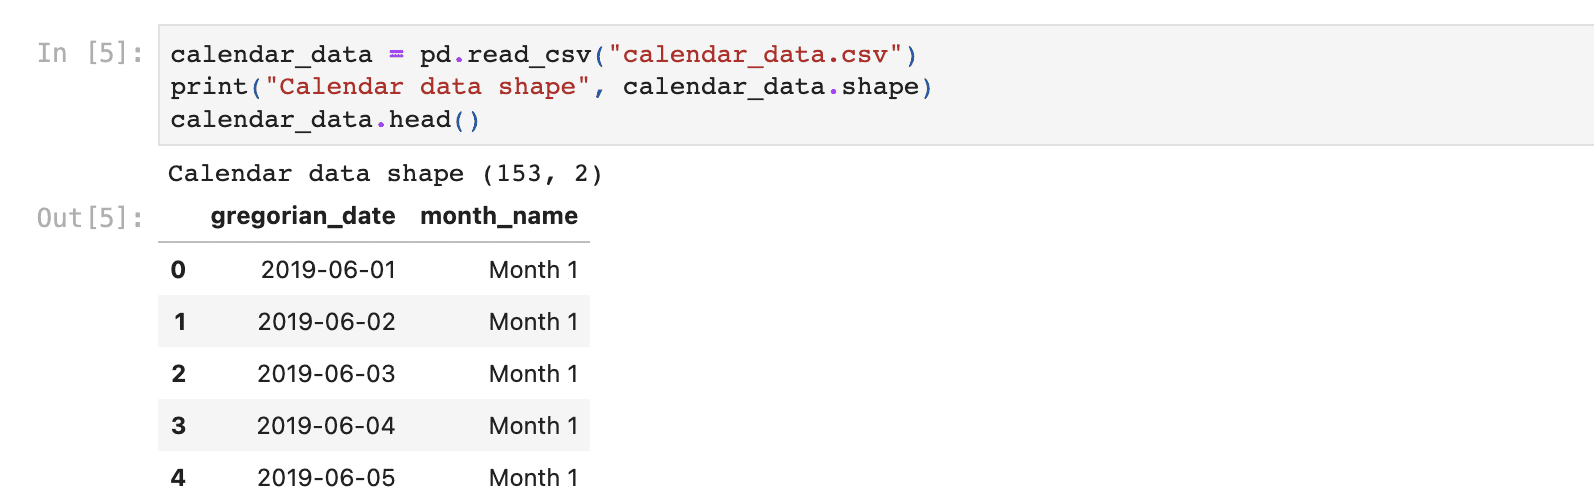
Now you have data, you can perform the exploratory data analysis this project is asking you.
For more details on how to do it, here is the youtube video.
There are many different websites where you can find open-source data.
Here are 4 of them.
Find the data there and read them by using Python functions as has been done above. If your data comes in other formats (HTML, JSON, excel), you can also read them using Pandas functions.
Web Scraping
Web scraping is a process of using automated tools to scrape through the web and gather data. This means using crawlers and scrapers. They map the website HTML and then collect data using the given instructions.
The Crawler
Web crawlers look for any information to take from the website. It helps you find URLs that contain the information you want to scrape.
The Scraper
The scraper collects the information that you preset. Every scraper has a selector to locate the information you want to take from the website.
How does it work?
Generally, they work together. First, the crawler takes the information about your topic and finds the URLs. Then the scraper locates the information you need by using the selector. In the final step, you scrape this data.
Data Scraping Python Libraries
In Python, you can scrape data by working with different libraries. Here are 4 of them for you.
- BeautifulSoup
- Scrapy
- Selenium ( This one is not official documentation, yet I find that one more readable.)
- Request
Here is the video by Ken Jee. You can see his Youtube series of Data Science projects by dividing them into different steps. In the second video, he explains the importance of data collection. Then he scrapes data from glassdoor by using Selenium to make data analysis of the data scientist's salary.
API
Image by Author
API stands for Application Programming Interface, which is used for communication between different programs. It helps two programs or applications to pass information between them.
Youtube Scraper API
Here is a Youtube API that will be used to gather data in the next video. It allows you to get channel statistics like the total subscribers and view counts, names of the videos, comments, and more.
In this video on The Vu Data Analytics channel, the data is scraped from Youtube using the Youtube API.
First, the data is processed. After that, there’s an exploratory data analysis, visualization, and more.
You can see some similarities to the previous video, like cleaning data and doing explanatory analysis. This is normal because most data projects go through the same stages. But the data you use in these stages and how you use it will improve your projects and enrich your portfolio.
2. Building Data Pipeline
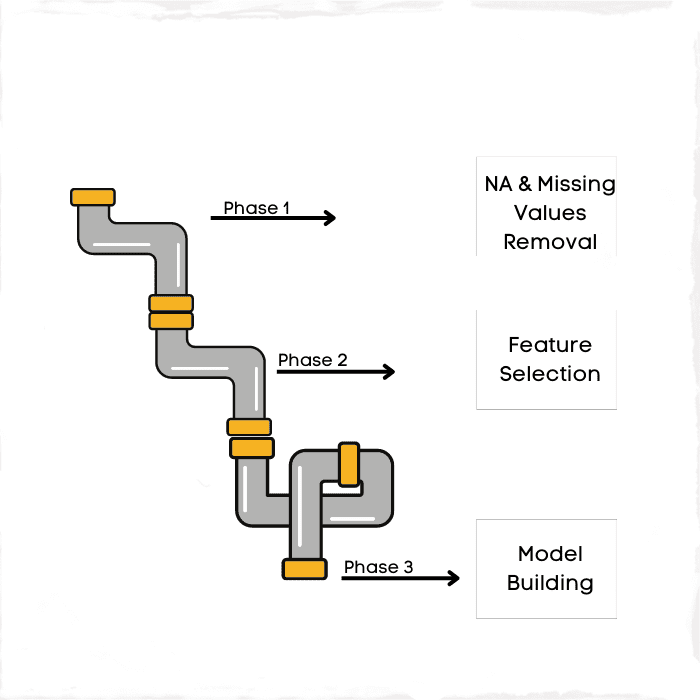
Image by Author
It is the phase of turning your unstructured data into a meaningful version. The pipeline term here focuses on transformation. Sometimes this phase is also called data cleaning, yet visualizing pipelines and assigning them to the stages of data makes sense.
After scraping, data generally won't be in the best shape.That’s why changing its format will be mandatory. For instance, if you have a small amount of data but it contains many NAs or missing values, filling these values into the average of the column will help you to use this data.
Or for example, if you work with the date time column, the data type of your column might be an object. That will prevent you from applying the date time function to that column. So you should turn this column's data type to date-time.
Having more data with better quality helps you build a more effective model.
Let's give an example of the transformation needed in Machine Learning. If you build a model, your variables should be numerical. Yet some data has categorical information. To turn these variables into numerical, you should do one hot encoding.
3. Data Exploration

Image by Author
Knowing your data is really important when doing a project. To do that, you must first explore it by using different functions.
Here are some common Pandas functions used in data exploration.
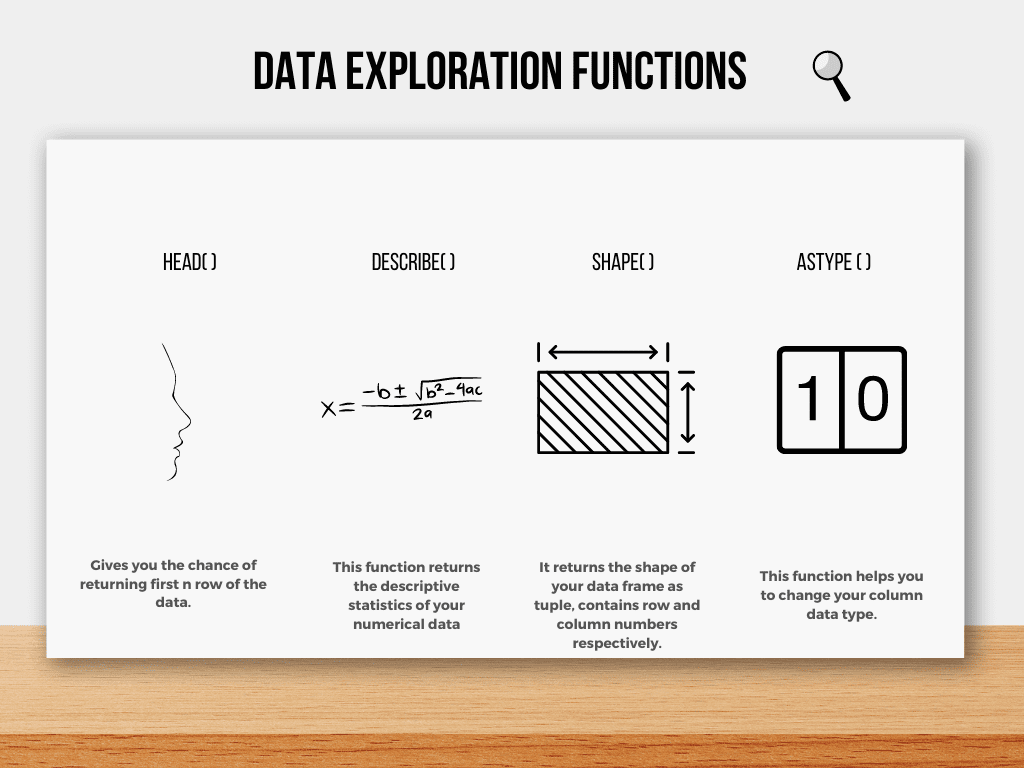
Image by Author
First glance at your data
head( ) function gives you the chance to look at the first several rows of your data. Also, the info( ) function will give you a piece of information about your data's columns, such as length and data types.
describe( ) function will give a summary of descriptive statistics.
shape( ) function will give information about the dimension of your data, which outputs row/column as a tuple, respectively.
astype( ) function helps you to change the format of your columns.
Additionally, the chance is you won’t be working with a dataset, so merging data is also a common operation you’ll use.
4. Data Visualization

Image by Author
Extracting meaningful information from data becomes easier if you visualize it. In Python, there are many libraries you can use to visualize your data.
You should use this stage to detect the outliers and correlated predictors. If undetected, they will decrease your machine-learning model performance.
Creating graphs makes this detection easier.
Outlier Detection
The outliers often happen due to anomalies, and they don’t help your model’s predictions. Detecting the outliers is followed by removing them from your data.
Here we can see this distribution graph, which shows the maximum prices people are willing to pay for a room on Airbnb in Dublin.
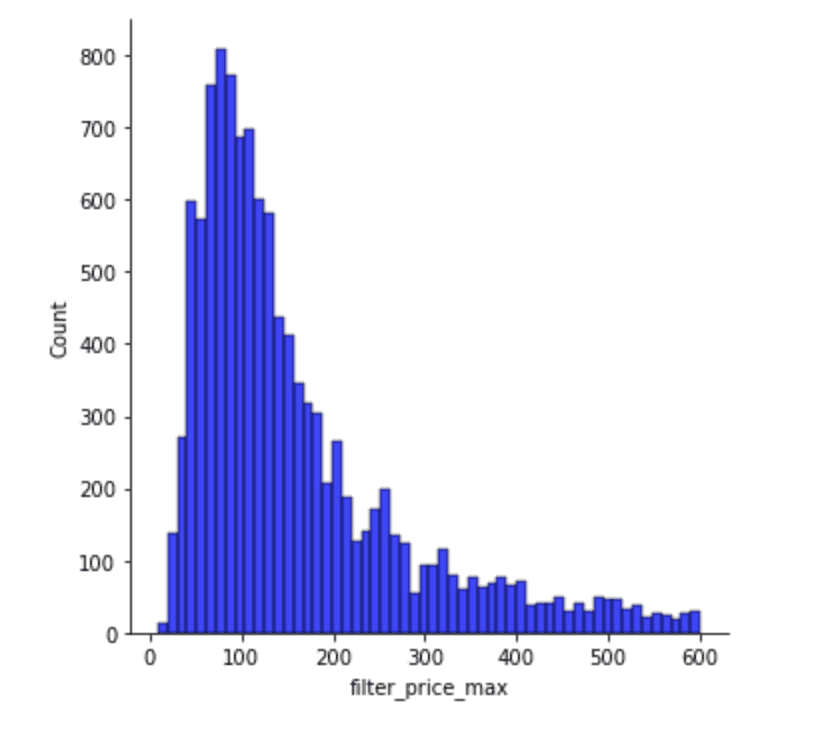
Most people search for a room below $200/night, and especially around $100/night. Yet there are other people who search for rooms between 500-600.
When building a model, filtering it at a certain level will help you to predict the behavior more accurately.
Correlation Graph
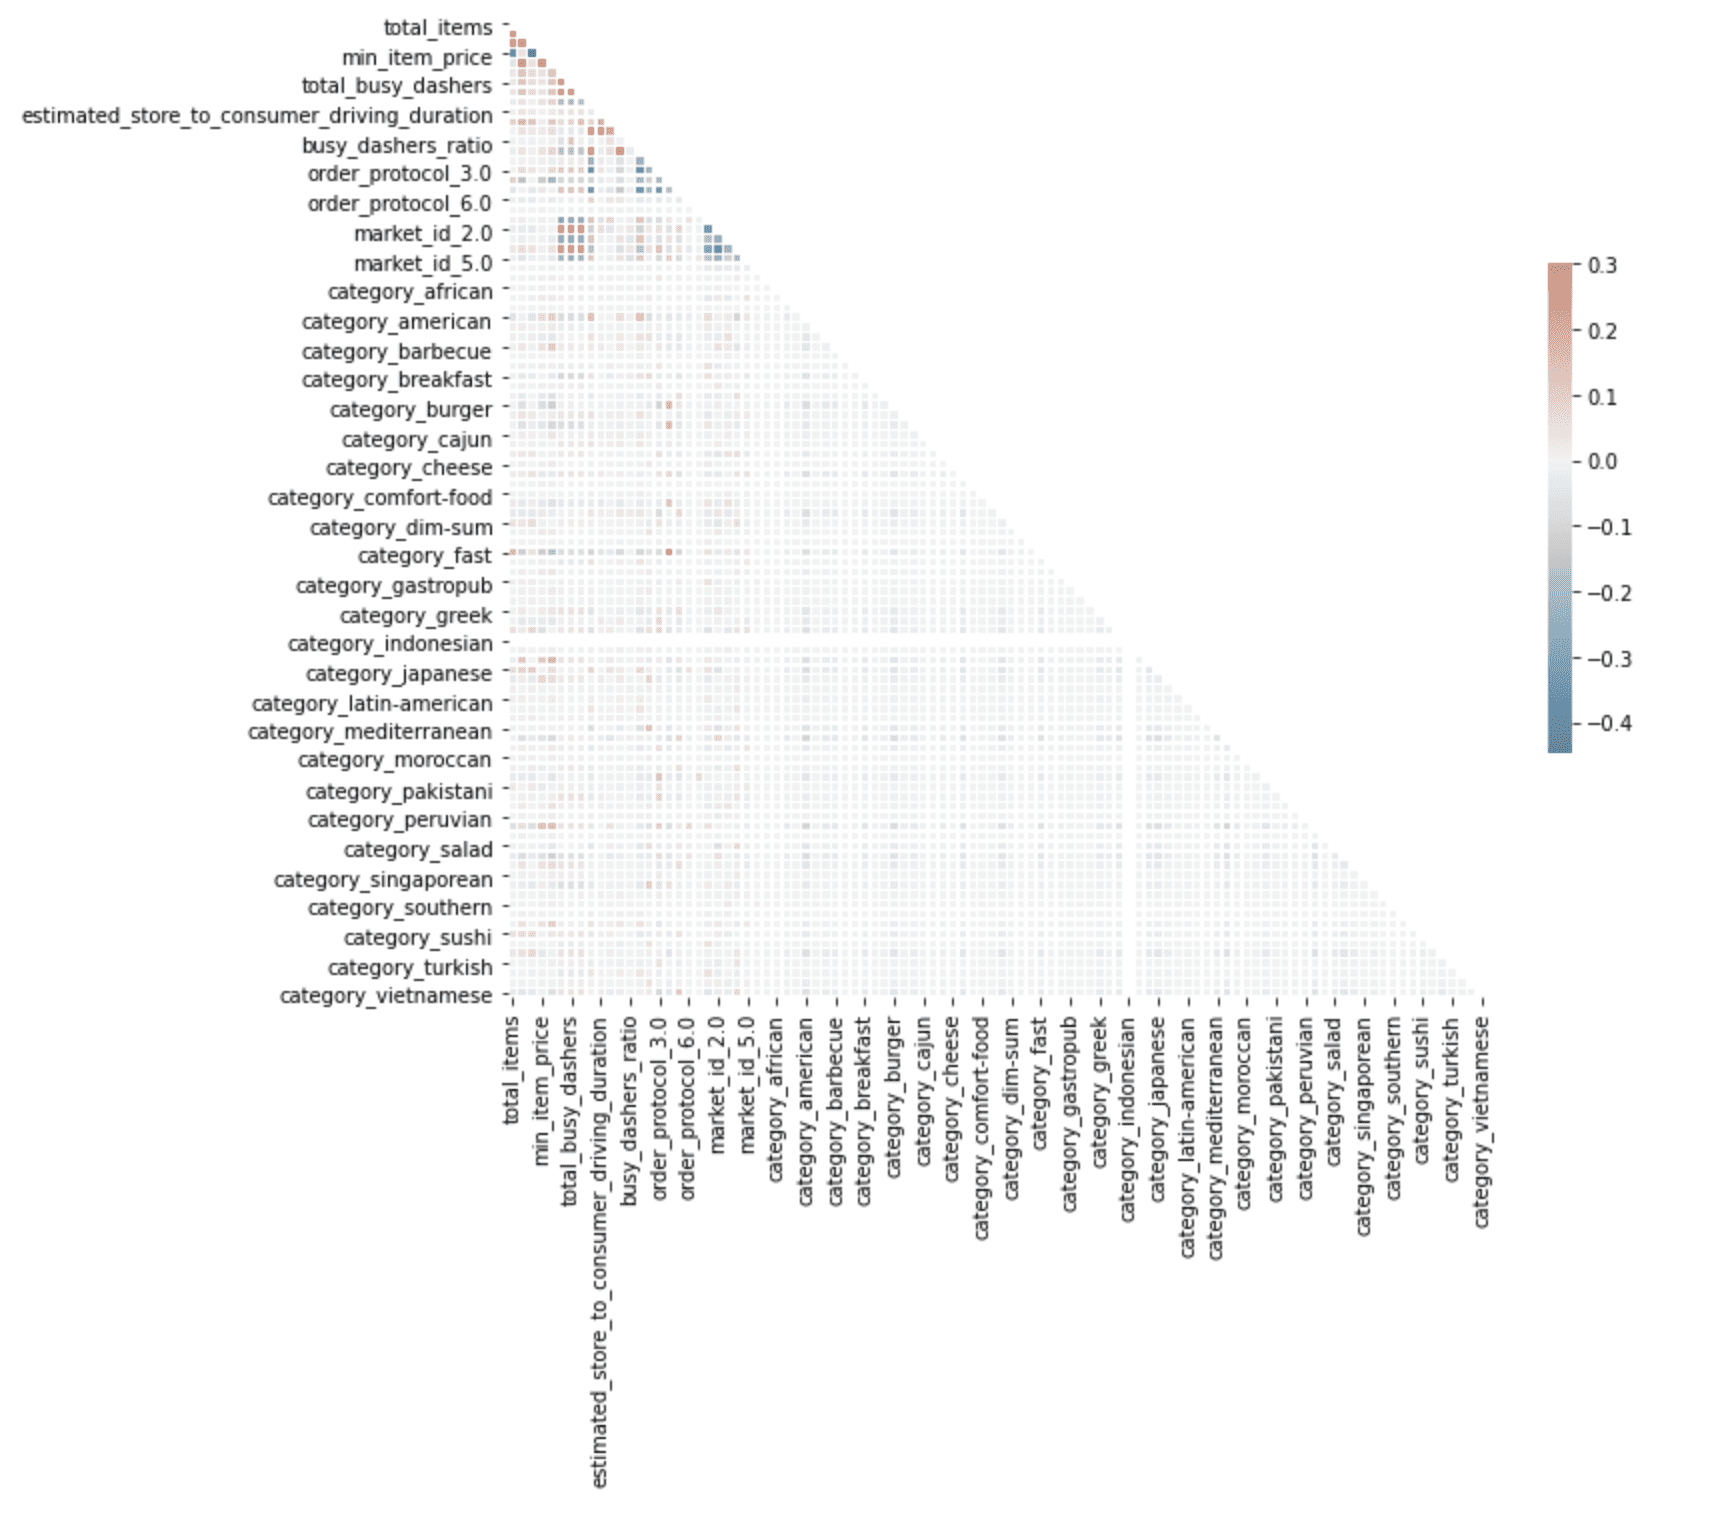
Image by Author
Here, the correlation graph detects correlated predictors, which will decrease your model’s performance. You can see the color scale on the right side of the graph, which shows that as the color density increases, the correlation increases, too for both negative and positive.
5. Model Building

Image by Author
Here you can see the different stages of model building.
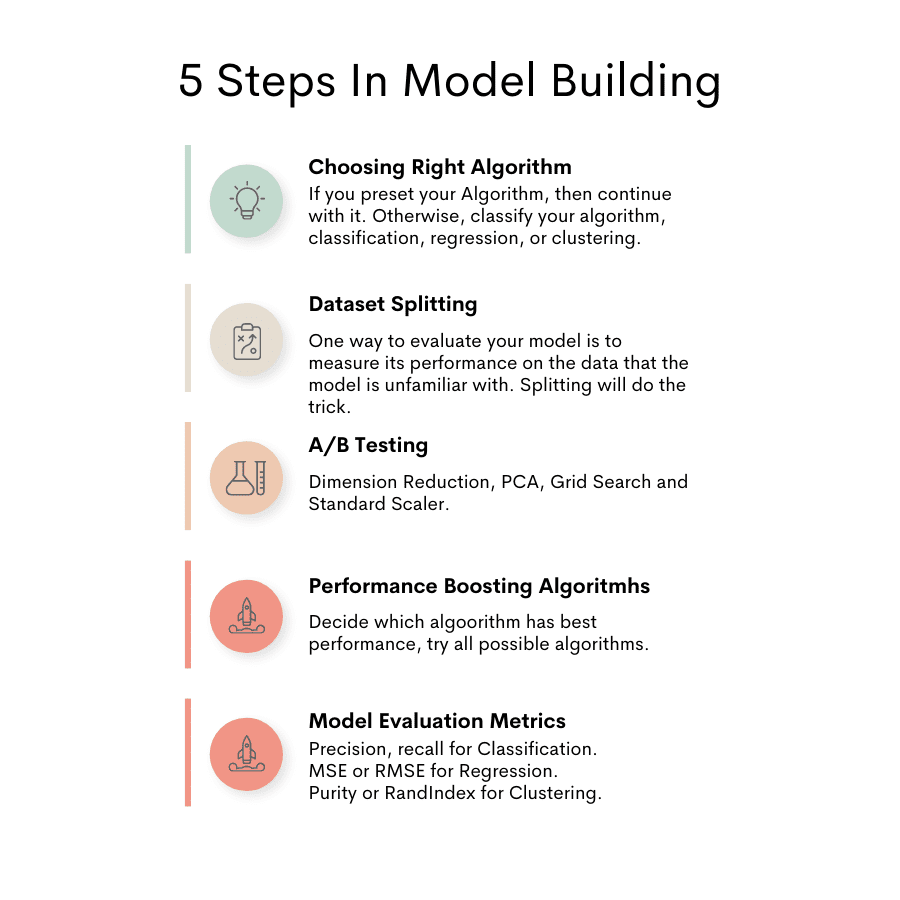
Image by Author
Choosing the Right Algorithm
First step in model building is choosing which algorithm type to use. Of course, it depends on your topic.
Do you work with numerical data and plan to make predictions? Then your choice will be Regression. Or do you want to classify the image with a Classification algorithm? It is up to your project. For instance, anomaly detection is often a popular project content. It can be used for credit card fraud detection and uses the Clustering algorithms in the backend. Of course, you can use Deep Learning in your project too.
Dataset Splitting
One way to evaluate your model is to measure its performance on the data that the model is unfamiliar with. Splitting data into training and testing datasets helps you achieve that.
You train your model using the training dataset and then test its performance using the test set, which contains data the model is unfamiliar with.
In this stage, if you already know which model you’ll use, you can skip using the validation set. However, if you want to try different models to see which one is best, using the validation set is for you.
A/B testing
After choosing the algorithm and splitting your dataset, it is time to do A/B testing.
There are different algorithms. How can you be sure which one will be the best for your model? One thing to check this is called A/B testing in machine learning. A/B testing in Machine Learning means that you will try different models to find the best for your project.
Try all possible algorithms for your data and find the best-performing algorithm and continue using that one.
Performance Boosting Algorithms and Techniques

Image by Author
The performance of your model often can be enhanced by using different techniques. Let’s focus on three of them.

Image by Author
Dimensionality Reduction
Dimensionality reduction is used to find the predictors which will represent your data better than others. This technique makes your algorithm work faster, and your model predicts better.
Here you can see the application of the dimensionality reduction technique in the sci-kit learn library.
PCA
PCA stands for Principal Component Analysis, which helps you determine the number of predictors needed to explain a certain percentage of your data set.
Let me explain this in an example, the expected time of delivery is predicted. There are 100 predictors, so eliminating them will help us to enhance the speed of the algorithm and result to have a better working algorithm. That’s why the PCA algorithm is applied.
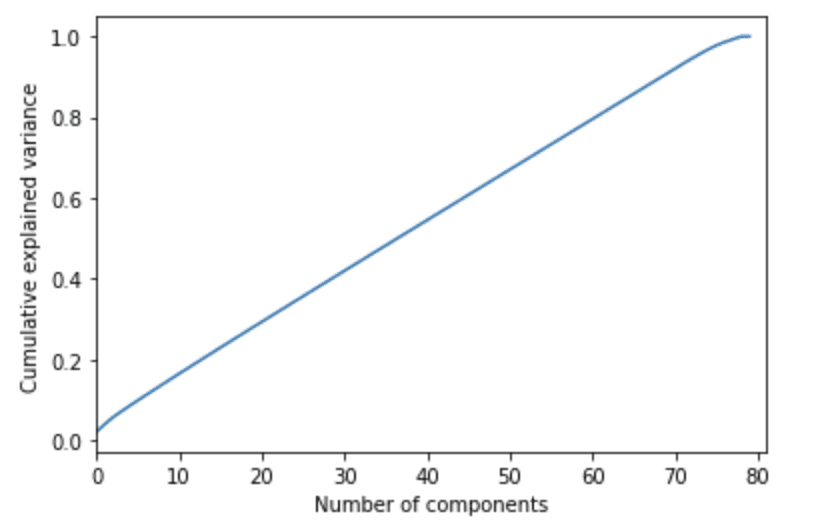
PCA shows that at least 60 representative features are needed to explain 80% of the dataset. Here is the code in the sci-kit learn library with an explanation.
Hyperparameters Tuning
When building a machine learning model, there will be a lot of different parameters that can be used to make a prediction. Hyperparameters Tuning helps us find the best of these parameters according to the needs of our project.
Grid Search
Grid Search helps you to find the best parameter values to optimize your machine learning model.
Here is the code in the sci-kit learn library, which explains what grid search is and gives you the code of implementation.
Preprocessing
It helps to scale your variables at the same level, that’s how your algorithm, which works for prediction, works faster.
Standard Scaler
The main idea is to change your predictor’s mean, zero, and standard deviation to 1. Here is the sci-kit learn library code to help you calculate that.
Model Evaluation Metrics
Image by Author
This step helps us to interpret the model. That’s why there are different evaluation metrics for different algorithms. The interpretation of algorithm results will differ depending on the problem: to regression, classification, or clustering.
Regression
It is a technique to find relations between numerical variables. Simply, we will use regression to predict numeric variables.
Here are the two evaluation metrics of regression problems.
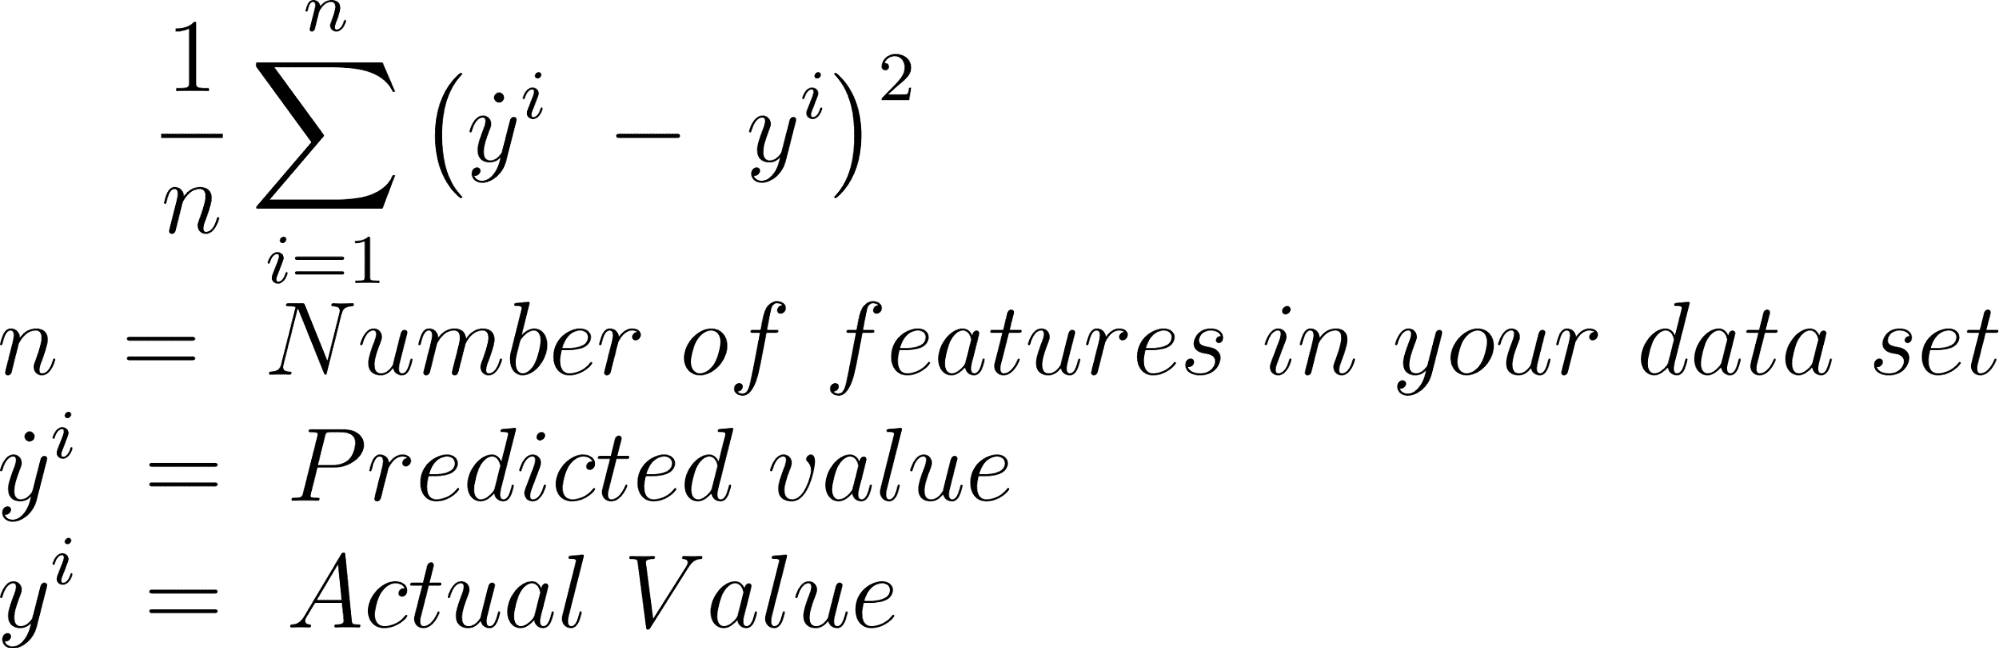
MSE
Mean squared error is calculated by finding the differences between the predicted value and actual value and squaring the result, for every element of your dataset.
Here is the formula.
Here is the implementation of MSE in sci-kit learn with Python.
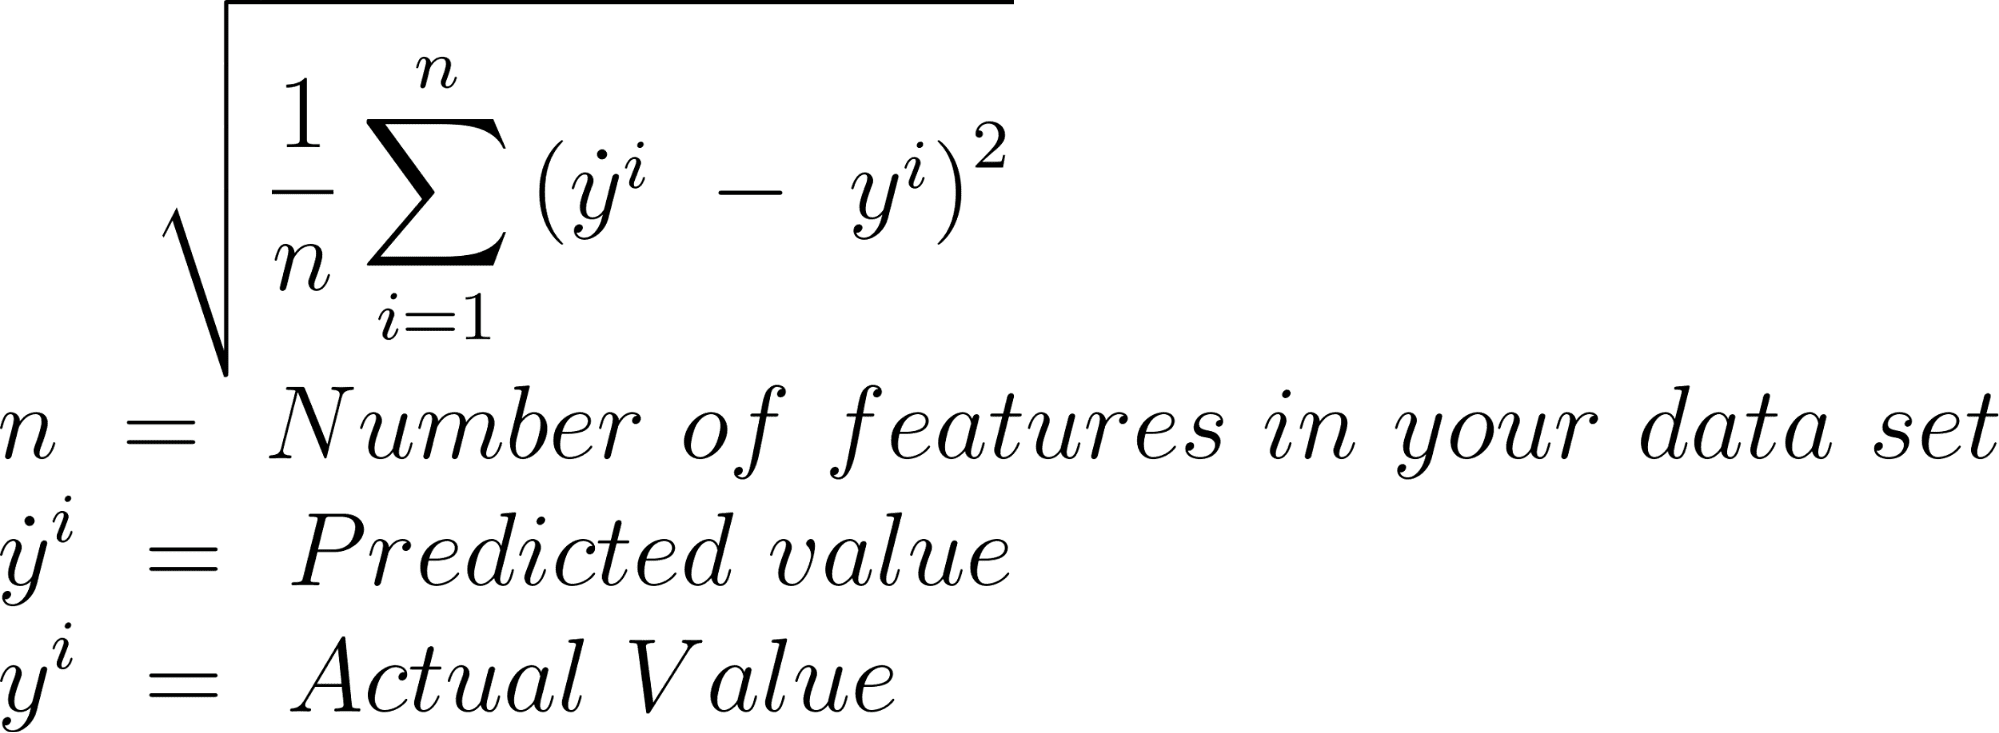
RMSE
RMSE is the root of the MSE.
Here is the formula.
Here is the implementation of RMSE in sci-kit learn with Python.
Classification
Classification algorithms split your data into different groups and define them accordingly.
The classification evaluation process often includes a confusion matrix, which includes True Class and predicted class. (True Positive, False Positive, True Negative, False Negative)
Here is the implementation of the confusion matrix in sci-kit learn.
Precision
This is to evaluate the accuracy of positive predictions.
Here is the formula.
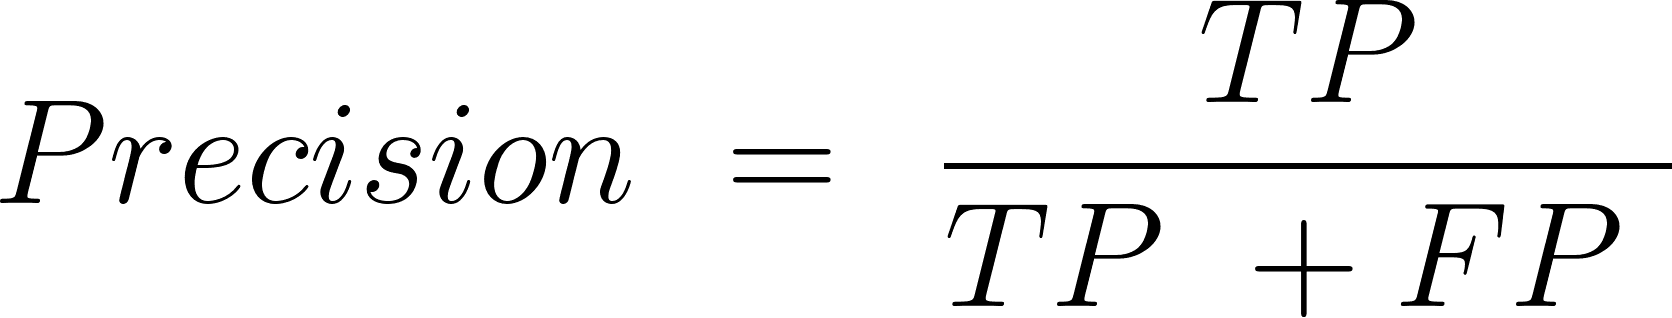
TP = True Positive
FP = False Positive
Here is the implementation of precision in Python with the sci-kit learn.
Recall
Recall or sensitivity, it is the ratio of positive examples that are correctly classified by your algorithm.
Here is the formula.

FN: False Negative
Here is the implementation of recall in Python with the sci-kit learn.
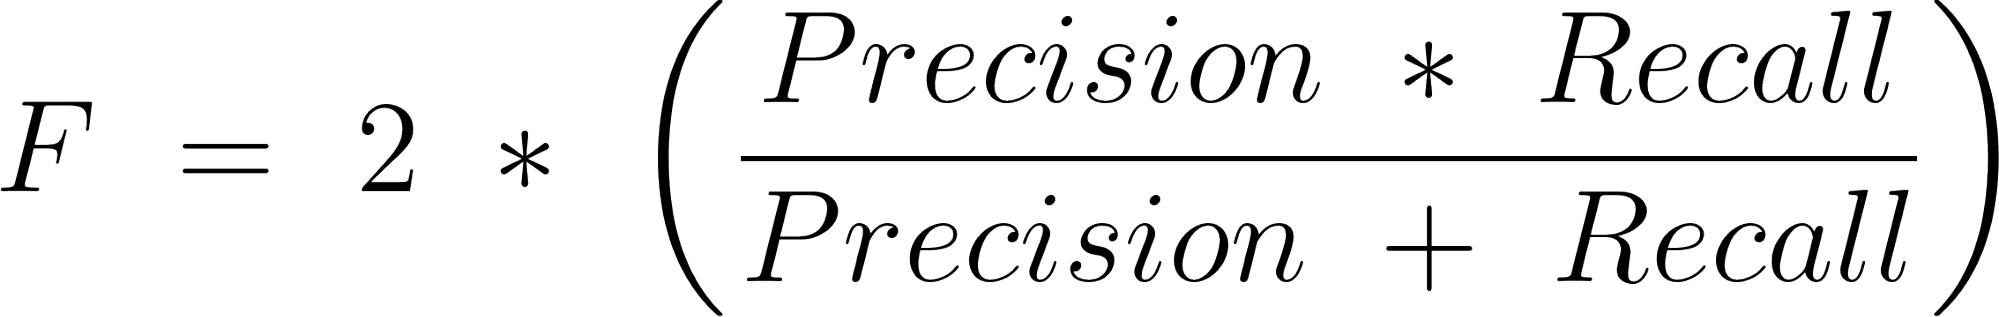
F1 Score
It is the harmonic mean of precision and recall.
Here is the formula
Clustering
First step of clustering is grouping the data points as a cluster. The second step is assigning them.
If you choose the clustering algorithm, here are two evaluation metrics to interpret your model's performance. Also, I added their formula and the link to the sci-kit learn library.
Purity
The purity is the percentage of total data points classified correctly.
Here is the formula
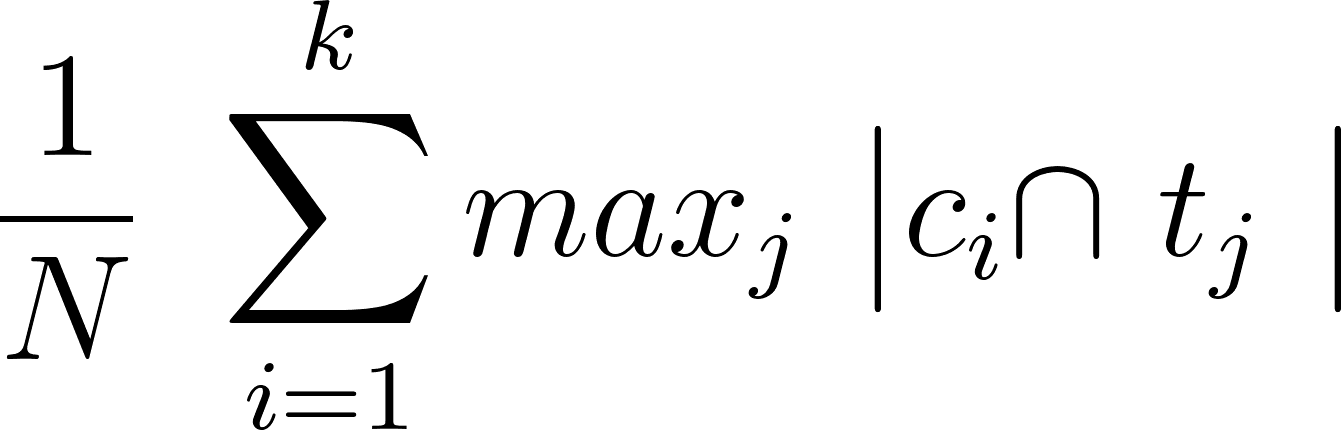
To calculate purity, you should first calculate the confusion matrix.
RandIndex
It measures the similarity between two clusters.
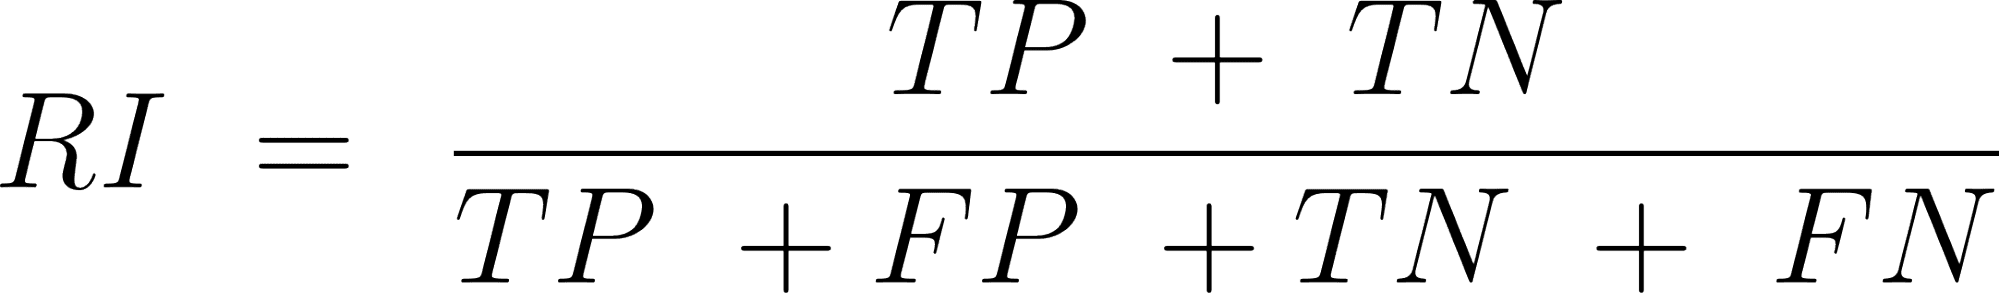
TP = True Positive
FP = False Positive
TN = True Negative
FN = False Negative
Here is the implementation of RandIndex in Python with the sci-kit learn.
6. Model in Production

Image by Author
After building your machine learning model, it is time to see its performance by presenting it to different users using cloud services. Here I will explain how to do that by using two different libraries in Python: Flask and Django.
Also, there are different options to run and host your model, such as Heroku, Digitalocean, pythonanywhere.com, which you can use for your own project.
Web APP with Flask
Flask is a Python library which will give you the chance to write web applications. For more info, please visit the official website here.
Suppose you developed a machine learning model to predict users' weight using body measurements and age.
To do that, you first need to access the data so you can build Multiple Linear Regression. Here you can reach the body fat prediction open-source dataset to create a machine-learning model which will predict the weight.
By using pythonanywhere.com, you can run your model and host it on the website at the same time.
API with Django REST
I already mentioned what API is, and now here I will mention its implementation options. You can write your API by using the Django REST framework. Django is like a flask; it is a micro web framework. Through using it, you can also code the backend and also frontend of the application and also write API.
Let’s talk about the advantages of developing API with Django REST.
The community is active, and the documentation is extensive.
Also, here are the other Python frameworks; by using these, you can develop an API.
On top of these six main project stages, here are the bonus two.
Adding Subscription to Your App
You can include a subscription plan in your Web APP. Suppose you developed an OCR algorithm which targets to distract information from documents by doing image processing, like Docsumo.
Here are the different options of their pricing system.
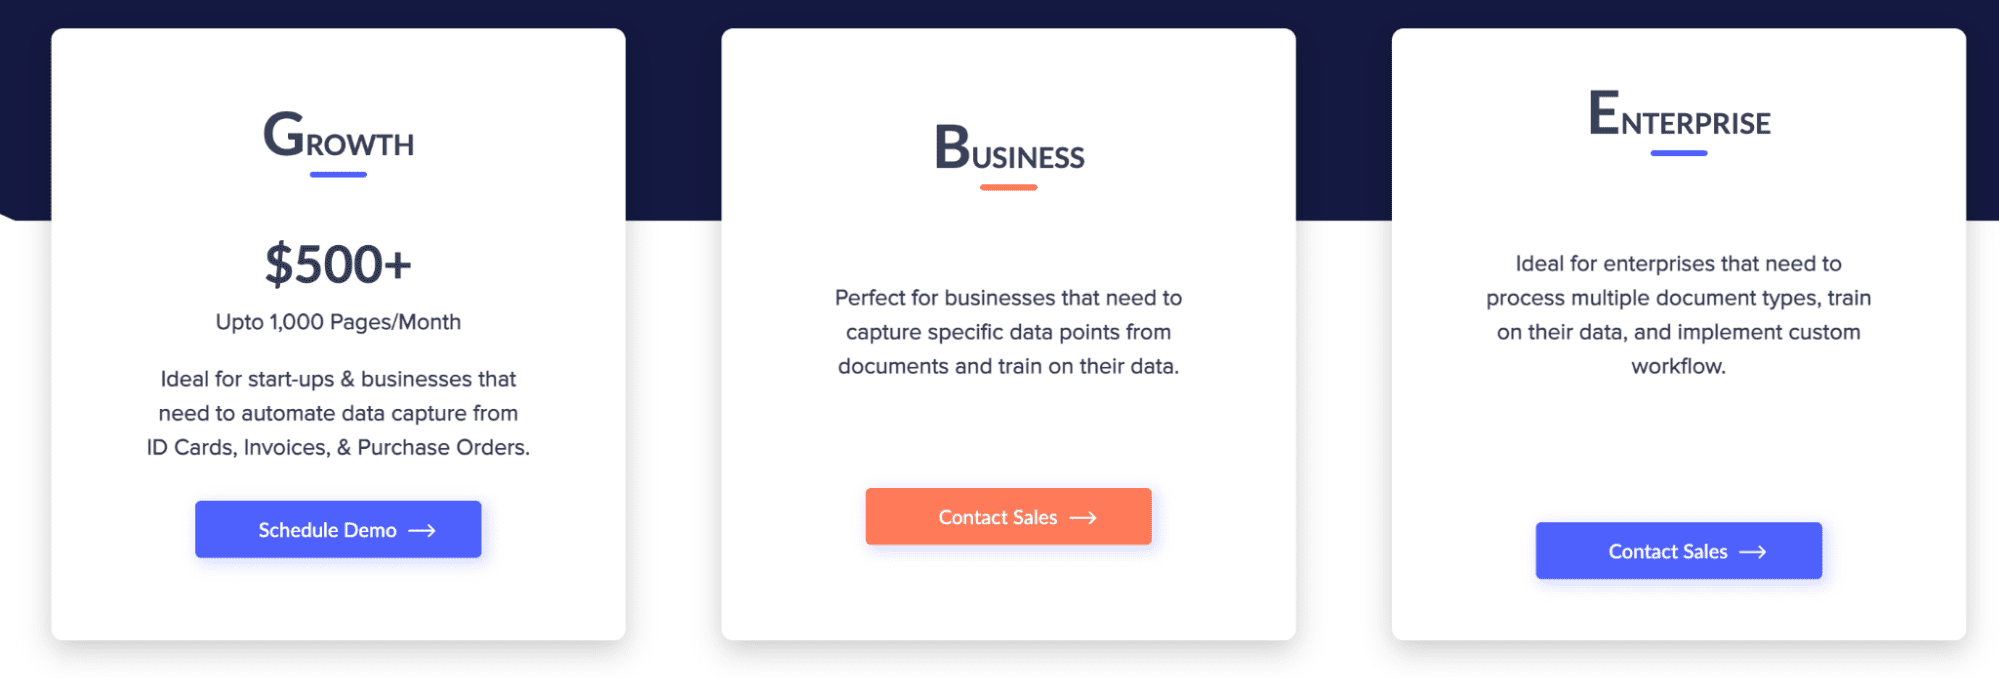
Image from docsumo.com
Of course, before turning your web application into a business, many stages exist to follow, yet the final destination could be like this one.
To gain income by using API, here is a website where you can upload your API, and it also contains thousands of different APIs.
You can monetize your API by adding different subscription options and gain income afterward.
Here is a face recognition api, which helps you to turn your text into speech. This API possibly uses CNN in the backend to recognize faces.

Image from RapidAPI
If you want to develop an algorithm for face recognition, here you can reach a great tutorial written by Adem Geitgay, which explains the stages of face recognition without going deeper and makes it easier by developing his own library.
Model Maintenance

Image by Author
After uploading your model into production, it should be regularly maintained. Since your model will use your user's information, your algorithm should be updated regularly.
Let’s say you build a Deep Learning Model which will predict the distance between two objects in the user’s photo. When training your model, you possibly use high-quality images to do that. Yet, real-life data might not be the quality you’re hoping for.
When looking at your evaluation metrics, you can see the drop in your model’s performance due to this technical issue. Of course, there are many possible solutions to overcome this problem.
One of them is adding noise to the pictures in your model.
That’s how your model will also have the ability to predict low-quality images too.
So to keep your model’s performance always high, it needs regular updates like that. Also, you should take care of your customer’s feedback regularly to keep them satisfied with your work and debug their problems.
Final Thoughts
Creating a project often starts with data collection. To differentiate from others, use some or all the data collection options I covered in the article. Along with that, use different open-source websites where you can reach different data sets.
After collecting your data, building a pipeline, and turning your data into the right format comes next. After that, it’s time to extract meaningful info from it by exploring it and then visualizing it. The next stage is to build a model.
Here we examined model building and performance booster algorithms, together with the evaluation metrics.
Of course, there are many options for deploying your models into production, of which I covered some.
Following these stages, will help you to ace your project, enrich your portfolio and earn possible income.
As you gain experience, feel free to add the stage according to your needs between them.
After you finish the project, try mapping these stages into your mind. Because explaining them to the interviewers in detail, also will help you to ace the interview and land a new job.
Nate Rosidi is a data scientist and in product strategy. He's also an adjunct professor teaching analytics, and is the founder of StrataScratch, a platform helping data scientists prepare for their interviews with real interview questions from top companies. Connect with him on Twitter: StrataScratch or LinkedIn.