
Python Matplotlib Cheat Sheets
Matplotlib is the most famous and commonly used plotting library in Python. It allows you to create clear and interactive visualizations that make your data easier to understand and your results more concrete.
There is no way you can build a data science project in Python without using Matplotlib. In fact, if something like:
from matplotlib import pyplot as plt
is not among the first 3 or four lines of your code, then something is missing. Matplotlib is the most famous and commonly used plotting library in Python. It allows you to create clear and interactive visualizations that make your data easier to understand and your results more concrete.
Your visualizations can change how your results will be perceived by others, whether you're presenting to your clients or your coworkers. In order to create compelling visualizations, you will need to be able to harness all the power Matplotlib offers.
This is what this article is for, some resources to help you start, practice, and master using Matplotlib to create visualizations that strongly support your results.
If you're new to data science or trying to refresh your knowledge, an excellent place to start is the 90 minutes Matplotlib on Freecodecamp.
Another great place to start is this article by GeeksforGeeks that takes you step by step from installing Matplotlib to creating a beautiful visualization in less than 5 mins read.
If you want to know how to make interactive visualization with Matplotlib, this video by UCLA's advanced research lab will show you the foundation, and all materials used are available on GitHub.
After you have a solid foundation of the basics, it is always nice to have a summary of the commonly used functions in Matplotlib that you will surely use when creating your data science projects.
So, let me share with you my top 3 favorite Matplotlib cheat sheets.

Image source: Matplotlib
- Whether you are a beginner, intermediate or advanced user of Matplotlib, you can find all you want on the official Matplotlib website. These cheat sheets include hits and code snippets on creating, editing, and even animating your plots. In addition to the cheat sheets, they also offer guides with basic functionalities based on your level of experience in using the library.
- Next up is the cheat sheet created by Datacamp. Datacamp offers pdf/ png versions of the cheat sheet, and you can find the code snippets on the same webpage. This is great if you want to copy-paste the snippets to try them out before you edit them or incorporate them into your code.
- Last but not least, a straightforward cheat sheet is also offered as a pdf and a webpage by CodeAcademy. This simple cheat sheet helps you lay down the basics of using Matplotlib.
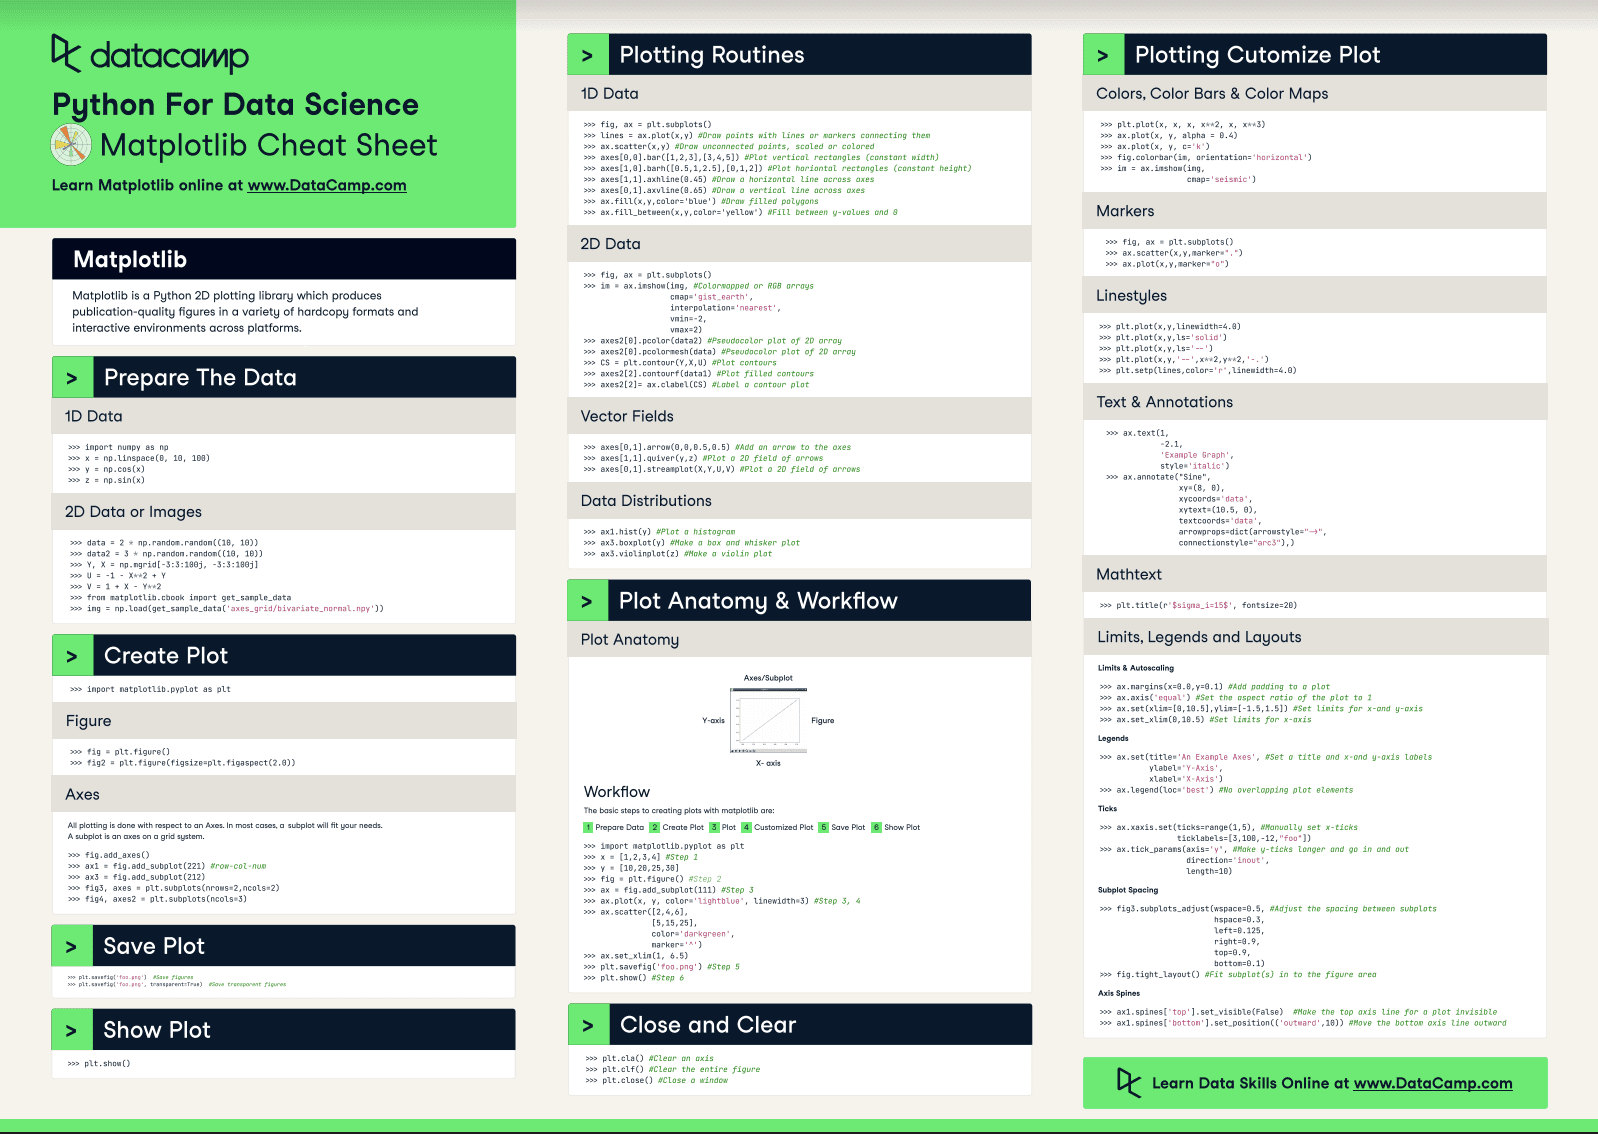
Image source: DataCamp
These resources will help you build a solid understanding of Matplotlib. But, if you want to take the extra mile to master the library, this handout by the official Matplotlib creators and this regenerative article will teach tips and tricks to take your plots and visualizations to the next level.
Knowing how to create compelling visualizations is an essential skill every data scientist needs to excel at their job. I hope you can use these resources to build and enhance your data visualization skills and take your career to the next level.
Sara Metwalli is a Ph.D. candidate at Keio University researching ways to test and debug quantum circuits. I am an IBM research intern and Qiskit advocate helping build a more quantum future. I am also a writer on Medium, Built-in, She Can Code, and KDN writing articles about programming, data science, and tech topics. I am also a lead in the Woman Who Code Python international chapter, a train enthusiast, a traveler, and a photography lover.