
5 SQL Visualization Tools for Data Engineers
This article will discuss SQL visualization, its role in augmenting the modern-day data engineer, and five categories of SQL visualization tools.
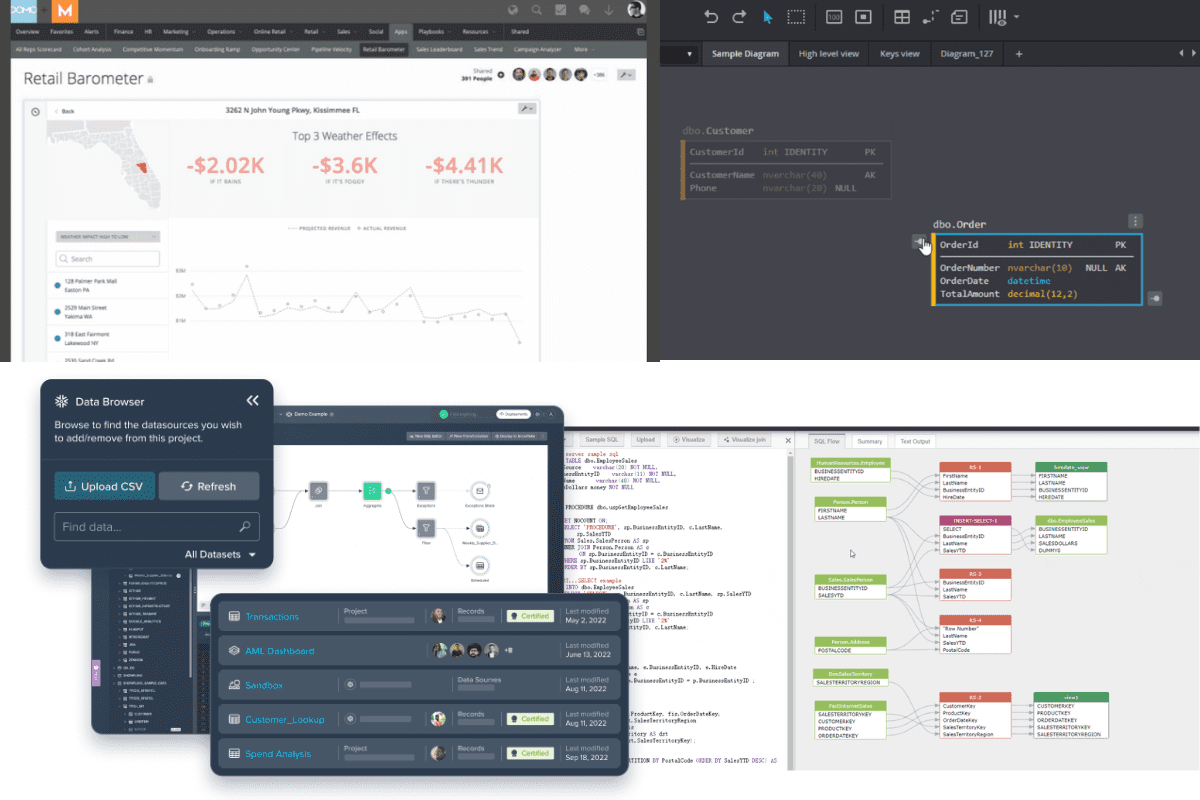
Image by Editor
It’s a no-brainer that humans alone cannot get the optimal value from all the data assets available today.
A quick disclaimer, however, is neither can the technology- at least not by itself.
It’s about a symbiosis - tech helping people on the one hand; and people guiding the tech toward a set, value-oriented goal.
We can cite a good use case with one of the generative AI tools leading the buzz today, Chat GPT.
Sequoia’s anatomy of a generative AI application reveals that as systems like chat GPT receive more user data, the model learns and is being fine-tuned.
A way to put this is, “we augment the systems, and it augments us”…quite simplistic yet profound.
This article will discuss an augmentation concept - SQL visualization, its role in augmenting the modern-day Data engineer, and five categories of SQL visualization tools.
The Rise In Human Augmentation
Gartner’s value equation for 2022 and beyond predicted a rise in the augmentation of people and decisions.
This trend stresses that in 2022 and beyond, composable, human-augmenting solutions are the technologies that will form the backplane of progressive AI-centered systems.
You can dive into the full report here.
It’s early 2023, and we’re seeing more citizen data science tools and augmentation technology for the data analyst/engineer persona.
So how does any of this relate to SQL Visualization?
We’ll explore more of this in the next section.
So, What’s SQL?
To understand SQL visualization, we need to revisit its suffix, SQL.
SQL, or S-e-q-u-e-l as it’s commonly called, is a 43 years old query language renowned as one of the most common languages used in database technologies today.
Stack overflow’s survey cites that over 50 percent of developers use SQL.
Safe to say, SQL works.
So...
Why the need for SQL Visualization?
SQL visualization is easing the adoption of SQL processing using graphical, visual components.
In the era of multi-cloud, hybrid, and cloud DW deployments and transitions, there is an increasing need for SQL visualization tools to aid businesses in optimizing their data stacks and processes. This is partly due to the following:
New Complexities
As organizations take steps to optimize their data processes by leveraging new tech channels and data sources, new challenges and complexities arise.
The need for shorter iterations
Data consumers now more than ever expect relevant, real-time context around datasets.
Analyst personas also expect to integrate data quickly and with a fail-fast approach without resorting to IT.
Overcoming de-democratized data prep
Stakeholders expect more empowerment to carry out ad-hoc analysis and self-service analytics without deep technical knowledge.
Scarcity of Data engineers
As of 2022, Tamr, a leading brand in data mastering, highlighted the spike in demand for data engineers and the corresponding scarcity of DE resources.
Companies that center their strategy around data engineering resources might encounter drawbacks.
Categories and Examples of SQL Visualization Tools
I like to segment the various SQL visualization tools into four clusters, namely:
SQL Flow visualization tools
SQL flow/lineage tools provide in-depth analysis of SQL syntax and produce visually intuitive lineage results.
Similar to JSON crack - which is used for visually exploring API output in JSON format, SQLflow by Gudusoft is an automated SQL lineage visualization tool.
Image by SQLFlow by Gudusoft
SQL schema visualization tools
These sets of SQL tools allow you to visualize your database designs online - in a collaborative and interactive environment. An excellent example of such a tool is SqlDBM.
SqlDBM is a development platform that enables companies to build online databases without writing code. Thanks to this, developers can concentrate more on the database's model and less on syntax.
Image by SqlDBM
SQL Query Visualization tools
These SQL visualization tools are primarily used for data wrangling, transformation, and modeling activities.
A renowned tool in this category is Datameer.
Datameer is an all-in-one solution for exploring, preparing, visualizing, and cataloging Snowflake insights. Datameer enables data engineers and analysts to alter data directly in Snowflake through a straightforward SQL code or no-code interface.
Image from Datameer
SQL Dashboard tools
Our typical data lifecycle starts from base SQL queries ? models, ? dashboards. However, tools like SQL dashboard software are disrupting this paradigm- by drastically shortening the time to insight for ad-hoc analysis and prototyping.
An excellent example of such a tool is Domo.
Domo is a visualization software that establishes a direct connection to data where it resides, feeding your vital metrics with up-to-the-minute data for quick analysis.
Image from Domo
Final Thoughts
We have reached the end of my curated list of SQL visualization tools for the data engineer/analyst persona… I hope you found this helpful.
If you’re a data analyst or engineer working with a cloud analytics stack, I strongly encourage you to try any of these out.
Regarding testimonials, I frequently use Datameer for low-code transformation and, SqlDBM for easy database modeling across my snowflake environments. Therefore I can attest to their claims of augmenting the "data engineer and analysts' persona."
If you have any recommendations outside these categories, kindly mention them in the comments; looking forward to hearing your thoughts.
Ndz Anthony is a senior BI Analyst and tutor. He enjoys educating through writing relating to business intelligence and enterprise analytics.