Why is DuckDB Getting Popular?
DuckDB combines the simplicity and ease of use of SQLite with the analytical performance of specialized columnar databases. Learn more with Python examples.
Image by Author
What is DuckDB?
DuckDB is a free, open-source, embedded database management system designed for data analytics and online analytical processing. This means several things:
- It's free and open-source software, so anyone can use and modify the code.
- It's embedded, meaning the DBMS (database management system) runs in the same process as the application that uses it. This makes it fast and simple to use.
- It's optimized for data analytics and OLAP (online analytical processing), not just transactional data like typical databases. This means the data is organized by columns instead of rows to optimize aggregation and analysis.
- It supports standard SQL so you can run queries, aggregations, joins, and other SQL functions on the data.
- It runs in-process, within the application itself rather than as a separate process. This eliminates the overhead of communicating between processes.
- Like SQLite, it's a simple, file-based database so there's no separate server installation required. You just include the library in your application.
In summary, DuckDB provides an easy-to-use, embedded analytic database for applications that need fast and simple data analysis capabilities. It fills a niche for analytical processing where a full database server would be overkill.
Why is DuckDB Getting Popular?
There are many reasons companies are now building products on top of DuckDB. The database is designed for fast analytical queries which means it's optimized for aggregations, joins, and complex queries on large datasets - the types of queries often used in analytics and reporting. Moreover:
- It's simple to install, deploy, and use. There is no server to configure - DuckDB runs embedded within your application. This makes it easy to integrate into different programming languages and environments.
- Despite its simplicity, DuckDB has a rich feature set. It supports the full SQL standard, transactions, secondary indexes, and integrates well with popular data analysis programming languages like Python and R.
- DuckDB is free for anyone to use and modify, which lowers the bar for developers and data analysts to adopt it.
- DuckDB is well-tested and stable. It has an extensive test suite and is continuously integrated and tested on a variety of platforms to ensure stability.
- DuckDB offers comparable performance to specialized OLAP databases while being easier to deploy. This makes it suitable for both analytical queries on small to medium datasets as well as large enterprise datasets.
In short, DuckDB combines the simplicity and ease of use of SQLite with the analytical performance of specialized columnar databases. All of these factors - performance, simplicity, features, and open source license - contribute to DuckDB's growing popularity among developers and data analysts.
DuckDB Python Example
Let’s test out a few features of DuckDB using the Python API.
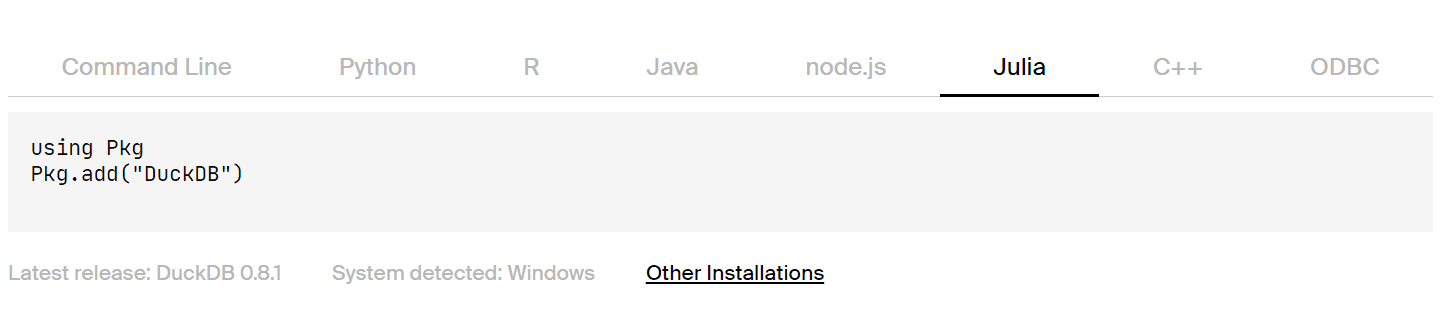
You can instal DuckDB using Pypi:
pip install duckdb
For other programming language, head to the DuckDB’s installation guide.
In this example, we will be using Data Science Salaries 2023 CSV dataset from Kaggle and try to test DuckDB’s various functionalities.
Relation API
You can load a CSV file just like pandas into a relation. DuckDB provides a relational API that allows users to link query operations together. The queries are lazily evaluated, which enables DuckDB to optimize their execution.
We have loaded the data science salary dataset and displayed the alias.
import duckdb
rel = duckdb.read_csv('ds_salaries.csv')
rel.alias
'ds_salaries.csv'
To display the column names we will use .columns similar to pandas.
rel.columns
['work_year',
 'experience_level',
 'employment_type',
 'job_title',
 'salary',
 'salary_currency',
 'salary_in_usd',
 'employee_residence',
 'remote_ratio',
 'company_location',
 'company_size']
You can apply multiple functions to the relation to get specific results. In our case, we have filtered out “work_year”, displayed only three columns, and ordered and limited them to display the bottom five job titles based on the salaries.
Learn more about Relational API by following the guide.
rel.filter("work_year > 2021").project(
    "work_year,job_title,salary_in_usd"
).order("salary_in_usd").limit(5)
┌───────────┬─────────────────┬───────────────┐
│ work_year │    job_title    │ salary_in_usd │
│   int64   │     varchar     │     int64     │
├───────────┼─────────────────┼───────────────┤
│      2022 │ NLP Engineer    │          5132 │
│      2022 │ Data Analyst    │          5723 │
│      2022 │ BI Data Analyst │          6270 │
│      2022 │ AI Developer    │          6304 │
│      2022 │ Data Analyst    │          6359 │
└───────────┴─────────────────┴───────────────┘
You can also use Relational API to join two datasets. In our case, we are joining the same dataset by changing the alias name on a “job_title”.
rel2 = duckdb.read_csv('ds_salaries.csv')
rel.set_alias('a').join(rel.set_alias('b'), 'job_title').limit(5)
┌───────────┬──────────────────┬─────────────────┬───┬──────────────┬──────────────────┬──────────────┐
│ work_year │ experience_level │ employment_type │ ... │ remote_ratio │ company_location │ company_size │
│   int64   │     varchar      │     varchar     │   │    int64     │     varchar      │   varchar    │
├───────────┼──────────────────┼─────────────────┼───┼──────────────┼──────────────────┼──────────────┤
│      2023 │ SE               │ FT              │ ... │          100 │ US               │ L            │
│      2023 │ MI               │ CT              │ ... │          100 │ US               │ S            │
│      2023 │ MI               │ CT              │ ... │          100 │ US               │ S            │
│      2023 │ SE               │ FT              │ ... │          100 │ US               │ S            │
│      2023 │ SE               │ FT              │ ... │          100 │ US               │ S            │
├───────────┴──────────────────┴─────────────────┴───┴──────────────┴──────────────────┴──────────────┤
│ 5 rows                                                                         21 columns (6 shown) │
└─────────────────────────────────────────────────────────────────────────────────────────────────────┘
Direct SQL method
There are direct methods too. You just have to write SQL query to perform analysis on the dataset. Instead of the table name, you will write the location and name of the CSV file.
duckdb.sql('SELECT * FROM "ds_salaries.csv" LIMIT 5')
┌───────────┬──────────────────┬─────────────────┬───┬──────────────┬──────────────────┬──────────────┐
│ work_year │ experience_level │ employment_type │ ... │ remote_ratio │ company_location │ company_size │
│   int64   │     varchar      │     varchar     │   │    int64     │     varchar      │   varchar    │
├───────────┼──────────────────┼─────────────────┼───┼──────────────┼──────────────────┼──────────────┤
│      2023 │ SE               │ FT              │ ... │          100 │ ES               │ L            │
│      2023 │ MI               │ CT              │ ... │          100 │ US               │ S            │
│      2023 │ MI               │ CT              │ ... │          100 │ US               │ S            │
│      2023 │ SE               │ FT              │ ... │          100 │ CA               │ M            │
│      2023 │ SE               │ FT              │ ... │          100 │ CA               │ M            │
├───────────┴──────────────────┴─────────────────┴───┴──────────────┴──────────────────┴──────────────┤
│ 5 rows                                                                         11 columns (6 shown) │
└─────────────────────────────────────────────────────────────────────────────────────────────────────┘
Persistent Storage
By default, DuckDB operates on an in-memory database. This means that any tables created are stored in memory and not persisted to disk. However, by using the .connect() method, a connection can be made to a persistent database file on disk. Any data written to that database connection will then be saved to the disk file and reloaded when reconnecting to the same file.
- We will create a database by using
.connect()method. - Run an SQL query to create a table.
- Use Query to add two records.
- Display the newly created test table.
import duckdb

con = duckdb.connect('kdn.db')

con.sql("CREATE TABLE test_table (i INTEGER, j STRING)")
con.sql("INSERT INTO test_table VALUES (1, 'one'),(9,'nine')")
con.table('test_table').show()
┌───────┬─────────┐
│   i   │    j    │
│ int32 │ varchar │
├───────┼─────────┤
│     1 │ one     │
│     9 │ nine    │
└───────┴─────────┘
We can also create the new table using a data science salary CSV file.
con.sql('CREATE TABLE ds_salaries AS SELECT * FROM "ds_salaries.csv";')
con.table('ds_salaries').limit(5).show()
┌───────────┬──────────────────┬─────────────────┬───┬──────────────┬──────────────────┬──────────────┐
│ work_year │ experience_level │ employment_type │ ... │ remote_ratio │ company_location │ company_size │
│   int64   │     varchar      │     varchar     │   │    int64     │     varchar      │   varchar    │
├───────────┼──────────────────┼─────────────────┼───┼──────────────┼──────────────────┼──────────────┤
│      2023 │ SE               │ FT              │ ... │          100 │ ES               │ L            │
│      2023 │ MI               │ CT              │ ... │          100 │ US               │ S            │
│      2023 │ MI               │ CT              │ ... │          100 │ US               │ S            │
│      2023 │ SE               │ FT              │ ... │          100 │ CA               │ M            │
│      2023 │ SE               │ FT              │ ... │          100 │ CA               │ M            │
├───────────┴──────────────────┴─────────────────┴───┴──────────────┴──────────────────┴──────────────┤
│ 5 rows                                                                         11 columns (6 shown) │
└─────────────────────────────────────────────────────────────────────────────────────────────────────┘
After performing all the tasks, you must close the connection to the database.
con.close()
Conclusion
Why do I like DuckDB? It is fast and simple to learn and manage. I believe simplicity is the main reason DuckDB has become widely used in the data science community. DuckDB provides an intuitive SQL interface that is easy for data analysts and scientists to pick up. Installation is straightforward, and the database files are light and manageable. All of these make DuckDB a joy to use.
Check out my previous Deepnote article on Data Science with DuckDB for an in-depth analysis of features and use cases.
With robust tools for data loading, managing, and analysis, DuckDB offers an attractive option compared to other database solutions for data science. I believe DuckDB will continue gaining users in the coming years as more data professionals discover its user-friendly nature.
Abid Ali Awan (@1abidaliawan) is a certified data scientist professional who loves building machine learning models. Currently, he is focusing on content creation and writing technical blogs on machine learning and data science technologies. Abid holds a Master's degree in Technology Management and a bachelor's degree in Telecommunication Engineering. His vision is to build an AI product using a graph neural network for students struggling with mental illness.