In-Database Analytics: Leveraging SQL’s Analytic Functions
Learn about various SQL Analytic functions like RANK(), NTILE(), CUME_DIST() and more to leverage your data analysis skills to the next level.

Image by Author
We all know the importance of data analysis in today’s data-driven world and how it offers us valuable insights from the available data. But sometimes, data analysis becomes very challenging and time-consuming for the data analyst. The main reason it has become hectic nowadays is the exploded volume of generated data and the need for external tools to perform complex analysis techniques on it.
But what if we analyse data within the database itself and with significantly simplified queries? This can be made possible using SQL Analytic functions. This article will discuss various SQL analytic functions that can be executed within the SQL Server and obtain us valuable results.
These functions calculate the aggregate value based on a group of rows and go beyond basic row operations. They provide us with tools for ranking, time series calculations, windowing and trend analysis. So without wasting any further time, let’s start discussing these functions one by one with some details and practical examples. The pre-requisite of this tutorial is the basic practical knowledge of SQL queries.
Creating a Demo Table
We will create a demo table and apply all the analytic functions on this table so that you easily follow along with the tutorial.
Note: Some functions discussed in this tutorial are not present in SQLite. So it is preferable to use MySQL or PostgreSQL Server.
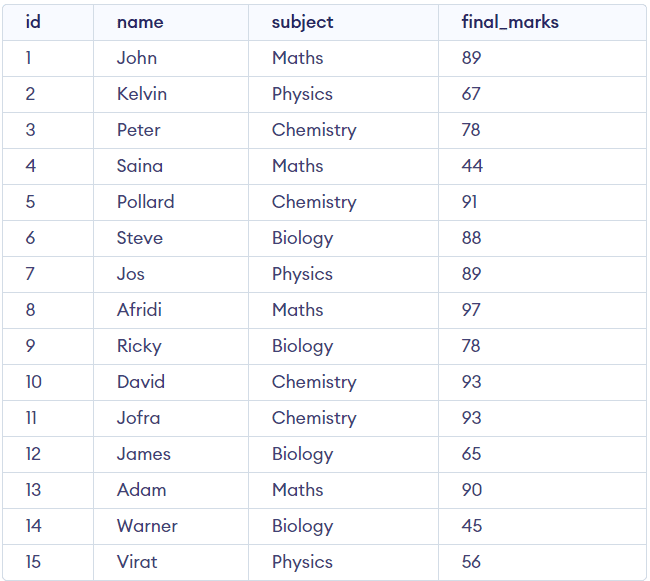
This table contains the data of several university students, containing four columns Student ID, Student Name, Subject and Final Marks out of 100.
Creating a Students Table containing 4 columns:
CREATE TABLE students
  (
     id          INT NOT NULL PRIMARY KEY,
     NAME        VARCHAR(255),
     subject     VARCHAR(30),
     final_marks INT
  );
Now, we will insert some dummy data into that table.
INSERT INTO Students (id, name, subject, final_marks)
VALUES (1, 'John', 'Maths', 89),
       (2, 'Kelvin', 'Physics', 67),
       (3, 'Peter', 'Chemistry', 78),
       (4, 'Saina', 'Maths', 44),
       (5, 'Pollard', 'Chemistry', 91),
       (6, 'Steve', 'Biology', 88),
       (7, 'Jos', 'Physics', 89),
       (8, 'Afridi', 'Maths', 97),
       (9, 'Ricky', 'Biology', 78),
       (10, 'David', 'Chemistry', 93),
       (11, 'Jofra', 'Chemistry', 93),
       (12, 'James', 'Biology', 65),
       (13, 'Adam', 'Maths', 90),
       (14, 'Warner', 'Biology', 45),
       (15, 'Virat', 'Physics', 56);
Now we will visualize our table.
SELECT *
FROM   students
Output:
We are ready to execute the analytic functions.
RANK() & DENSE_RANK()
RANK() function will assign a particular rank to each row within a partition based on the specified order. If the rows have identical values within the same partition, it assigns them the same rank.
Let’s understand it more clearly with the below example.
SELECT *,
       Rank()
         OVER (
           ORDER BY final_marks DESC) AS 'ranks'
FROM   students;
Output:
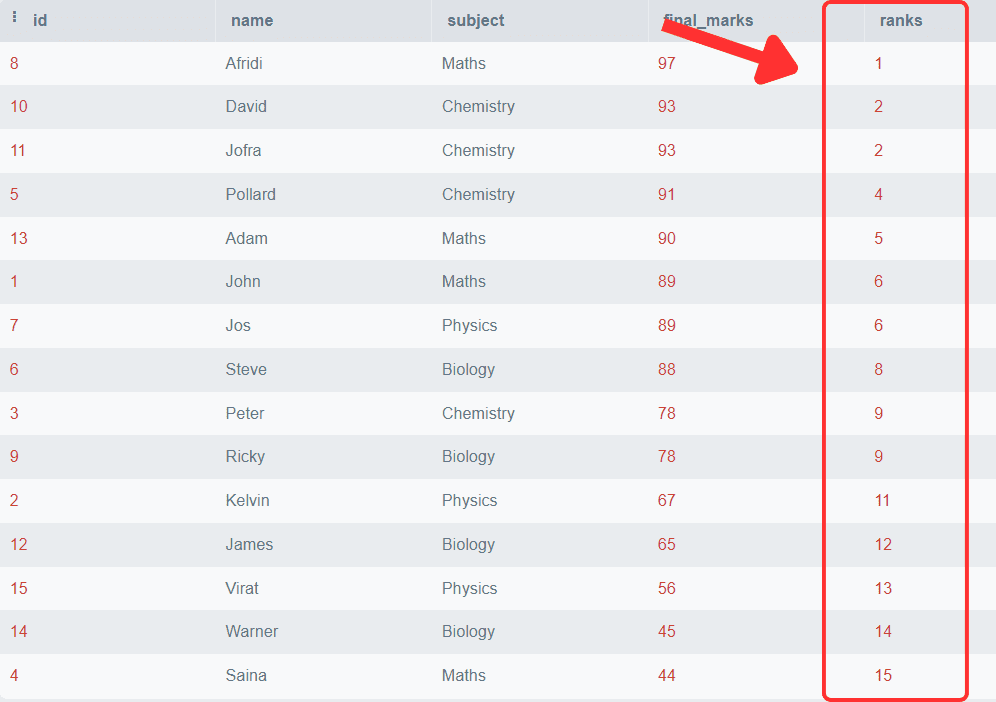
You can observe that the final marks are arranged in descending order, and a particular rank is associated with each row. You can also observe that the students with the same marks get the same rank, and the following rank after the duplicate row is skipped.
We can also find toppers of each subject, i.e. we can partition the rank based on the subjects. Let’s see how to do it.
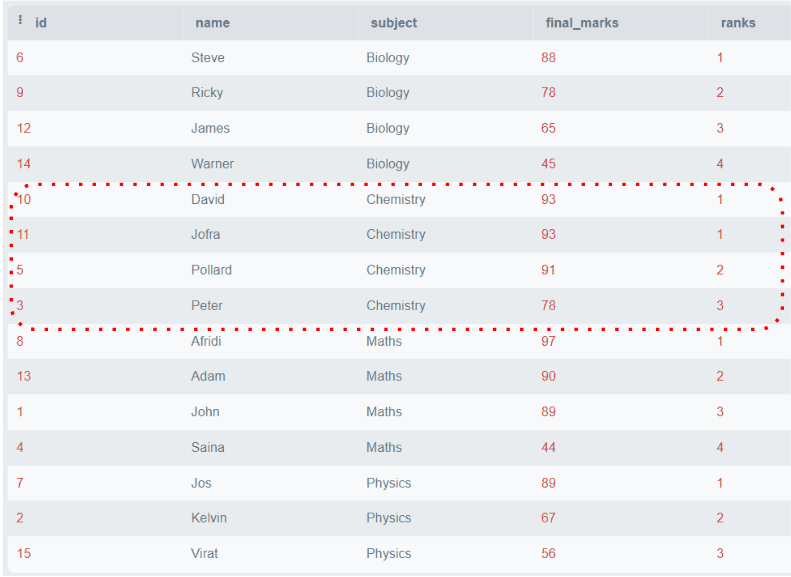
SELECT *,
       Rank()
         OVER (
           PARTITION BY subject
           ORDER BY final_marks DESC) AS 'ranks'
FROM   students;
Output:
In this example, we have partitioned the ranking based on subjects and the ranks are allocated separately for each subject.
Note: Please observe that two students got the same marks in the Chemistry subject, ranked as 1, and the rank for the next row directly starts from 3. It skips the rank of 2.
This is the feature of the RANK() function that it is not always necessary to produce ranks consecutively. The next rank will be the sum of the previous rank and the duplicate numbers.
To overcome this problem, DENSE_RANK() is introduced to work similarly to the RANK() function, but it always assigns rank consecutively. Follow the below example:
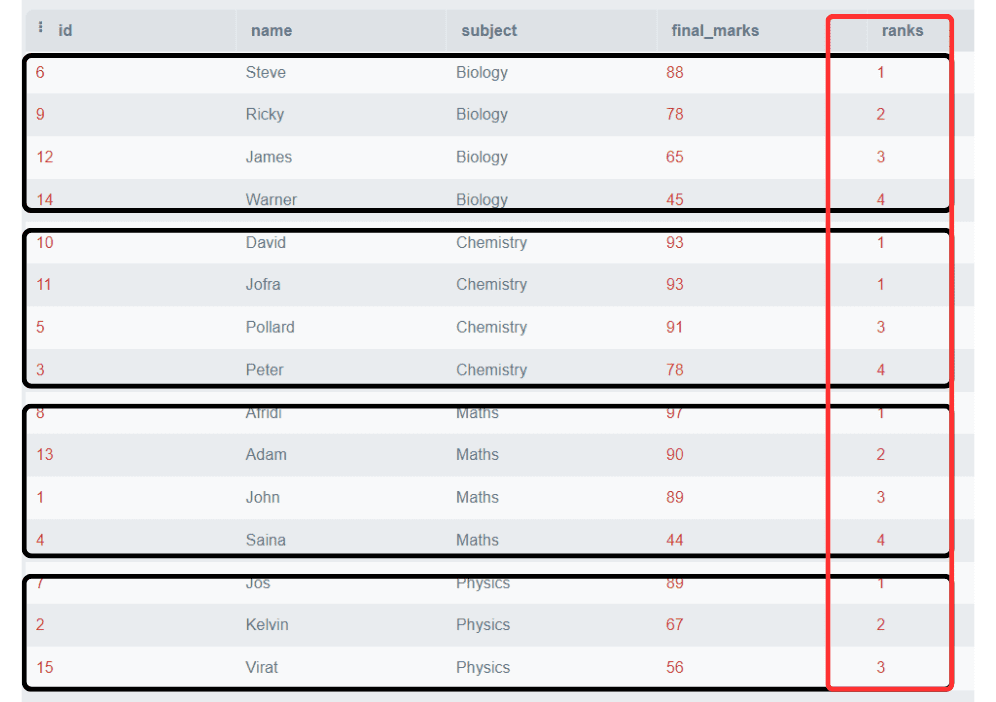
SELECT *,
       DENSE_RANK()
         OVER (
           PARTITION BY subject
           ORDER BY final_marks DESC) AS 'ranks'
FROM   students;
Output:
The above figure shows that all the ranks are consecutive, even if duplicate marks are in the same partition.
NTILE()
NTILE() function is used to divide the rows into a specified number (N) of roughly equal-sized buckets. Each row is assigned a bucket number starting from 1 to N (Total number of buckets).
We can also apply NTILE() function on a specific partition or order, which are specified in the PARTITION BY and ORDER BY clauses.
Suppose N is not perfectly divisible by the number of rows. Then the function will create buckets of different sizes with the difference of one.
Syntax:
NTILE(n) OVER (PARTITION BY c1, c2 ORDER BY c3)
The NTILE() function takes one required parameter N, i.e. the number of buckets and some optional parameters like PARTITION BY and ORDER BY clause. NTILE() will divide the rows based on the order specified by these clauses.
Let’s take an example considering our “Students” table. Suppose we want to divide the students into groups based on their final marks. We will create three groups. Group 1 will contain the students with the highest marks. Group 2 will have all the mediocre students, and Group 3 will include the students with low marks.
SELECT *,
       NTILE(3)
         OVER (
           ORDER BY final_marks DESC) AS bucket
FROM   students;
Output:
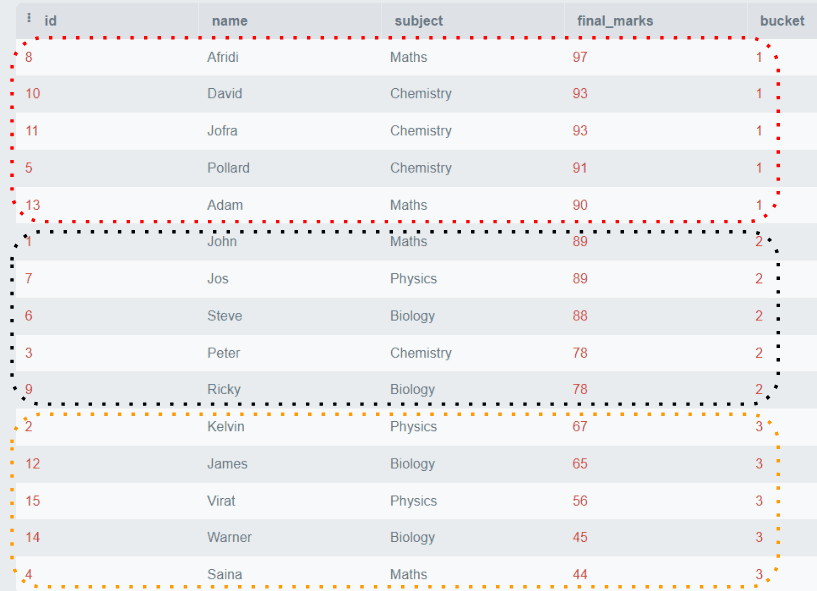
The above example shows that all the rows are ordered by final_marks and divided into three groups containing five rows per group.
NTILE() is useful when we want to divide some data into equal groups according to some specified criteria. It can be used in the applications like customer segmentation based on items purchased or categorizing employee performance, etc.
CUME_DIST()
The CUME_DIST() function finds the cumulative distribution of a particular value in each row within a partition or order specified. Cumulative Distribution Function (CDF) denotes the probability that the random variable X is less than or equal to x. It is denoted by F(x), and its mathematical formula is represented as,
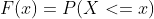
P(x) is the Probability Distribution Function.
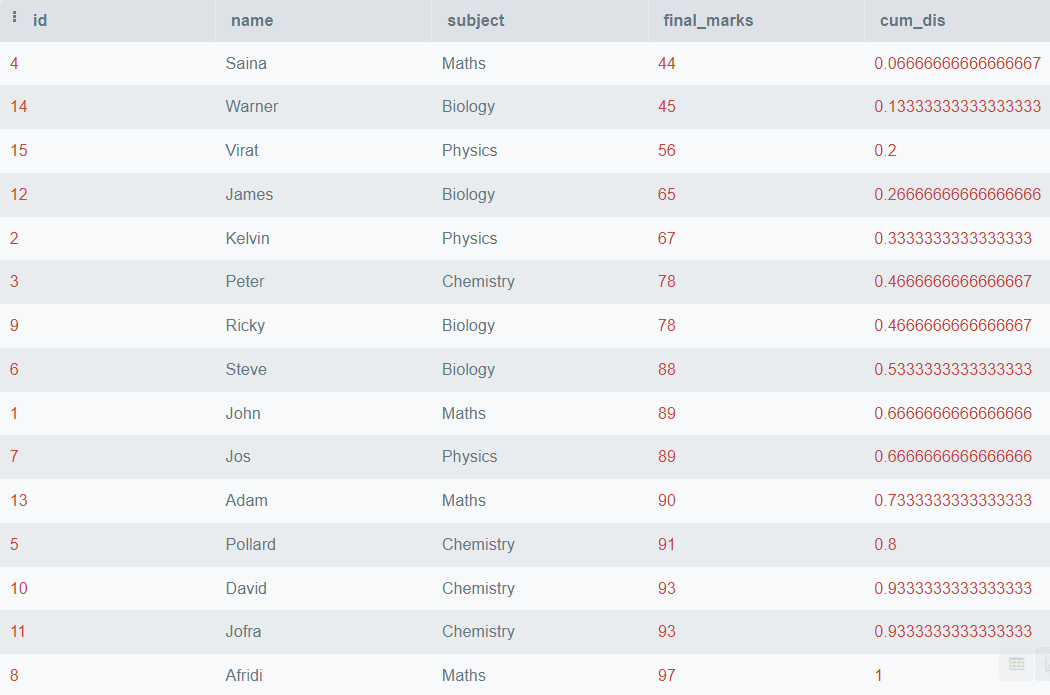
In simple language, CUME_DIST() function returns the percentage of rows whose value is less than equal to the current row value. It will help to analyze the distribution of data and also the relative position of a value with the set.
SELECT *,
       CUME_DIST()
         OVER (
           ORDER BY final_marks) AS cum_dis
FROM   students;
Output:
The above code will order all the rows based on final_marks and find the Cumulative Distribution, but if you want to partition the data based on the subjects, you can use the PARTITION BY clause. Below is an example of how to do it.
SELECT *,
       CUME_DIST()
         OVER (
           PARTITION BY subject
           ORDER BY final_marks) AS cum_dis
FROM   students;
Output:
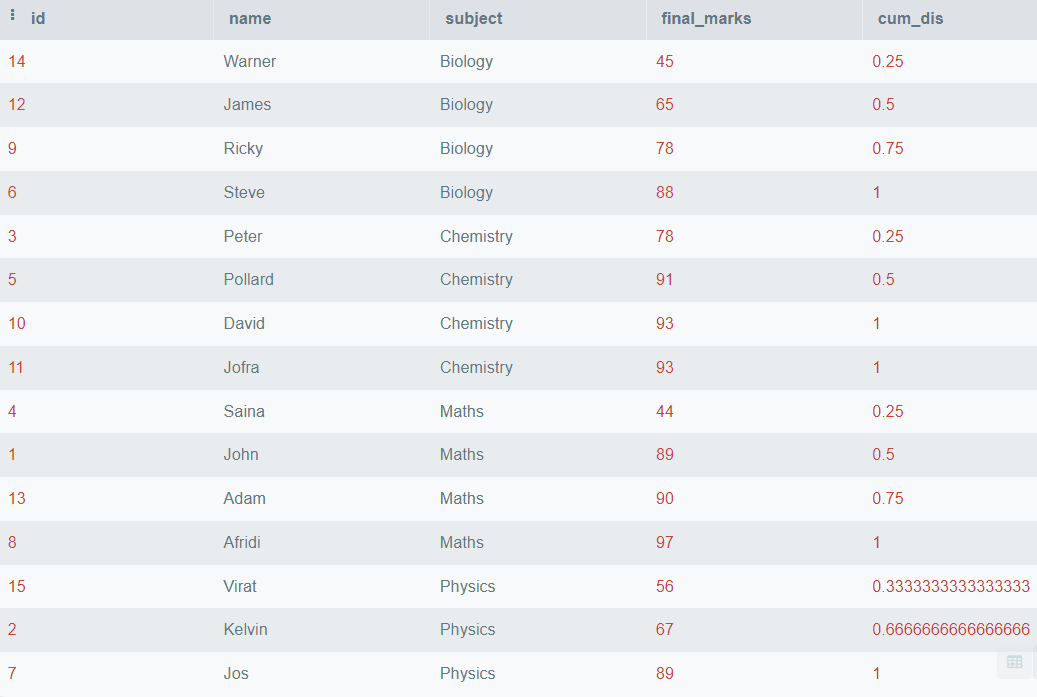
In the above output, we have seen the cumulative distribution of final_marks partitioned by the subject name.
STDDEV() and VARIANCE()
TheVARIANCE() function is used to find the variance of a given value within the partition. In statistics, Variance represents how a number is far from its mean value, or it represents the degree of spread between numbers. It is represented by ?^2.
The STDDEV() function is used to find the standard deviation of a given value within the partition. Standard Deviation also measures the variation in the data, and it equals the square root of the variance. It is represented by ?.
These parameters can help us to find dispersion and variability in the data. Let’s see how can we do it practically.
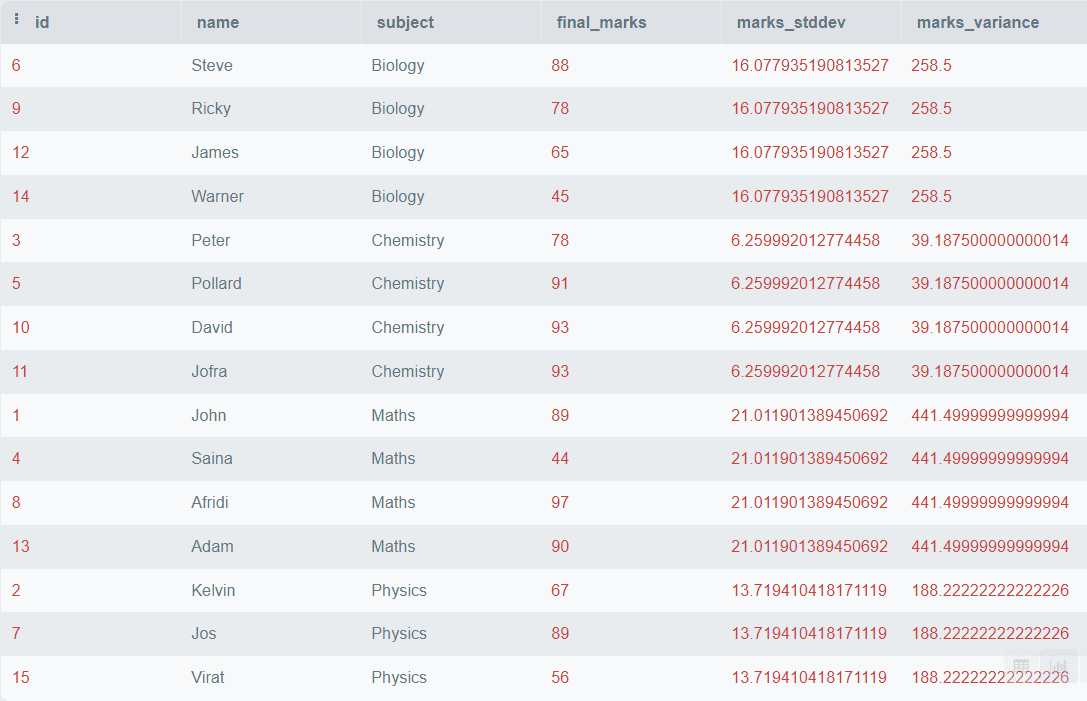
SELECT *,
       STDDEV(final_marks)
         OVER (
           PARTITION BY subject) AS marks_stddev,
       VARIANCE(final_marks)
         OVER (
           PARTITION BY subject) AS marks_variance
FROM   students;
Output:
The above output shows the Standard Variation and the Variance of the final marks for each subject.
FIRST_VALUE() and LAST_VALUE()
The FIRST_VALUE() function will output the first value of a partition based on a specific ordering. Similarly, the LAST_VALUE() function will output the last value of that partition. These functions can be used when we want to identify the first and last occurrence of a specified partition.
Syntax:
SELECT *,
       FIRST_VALUE(col1)
         OVER (
           PARTITION BY col2, col3
           ORDER BY col4) AS first_value
FROM   table_name
Conclusion
SQL Analytic Functions provide us with the functions to perform data analysis within the SQL server. Using these functions, we can unlock the true potential of the data and get valuable insights from it to increase our business. Other than the functions discussed above, there are many more excellent functions that may solve your complex problems very quickly. You can read more about these Analytical Functions from this article by Microsoft.
Aryan Garg is a B.Tech. Electrical Engineering student, currently in the final year of his undergrad. His interest lies in the field of Web Development and Machine Learning. He have pursued this interest and am eager to work more in these directions.