A/B Testing Pitfalls: What Works and What Doesn’t with Real Data
Learn why most “winning” experiments fail in production, and how top companies avoid this.
Image by Author
# Introduction
You've shipped what looks like a winning test: conversion up 8%, engagement metrics glowing green. Then it crashes in production or quietly fails a month later.
If that sounds familiar, you're not alone. Most A/B test failures don't come from bad product ideas; they come from bad experimentation practices.
The data misled you, the stopping rule was ignored, or no one checked if the "win" was just noise dressed as a signal. Here's the uncomfortable truth: the infrastructure around your test matters more than the variant itself, and most teams get it wrong.
Let's break down the four silent killers of A/B testing — from misleading data to flawed logic — and reveal the disciplined practices that separate the best from the rest.
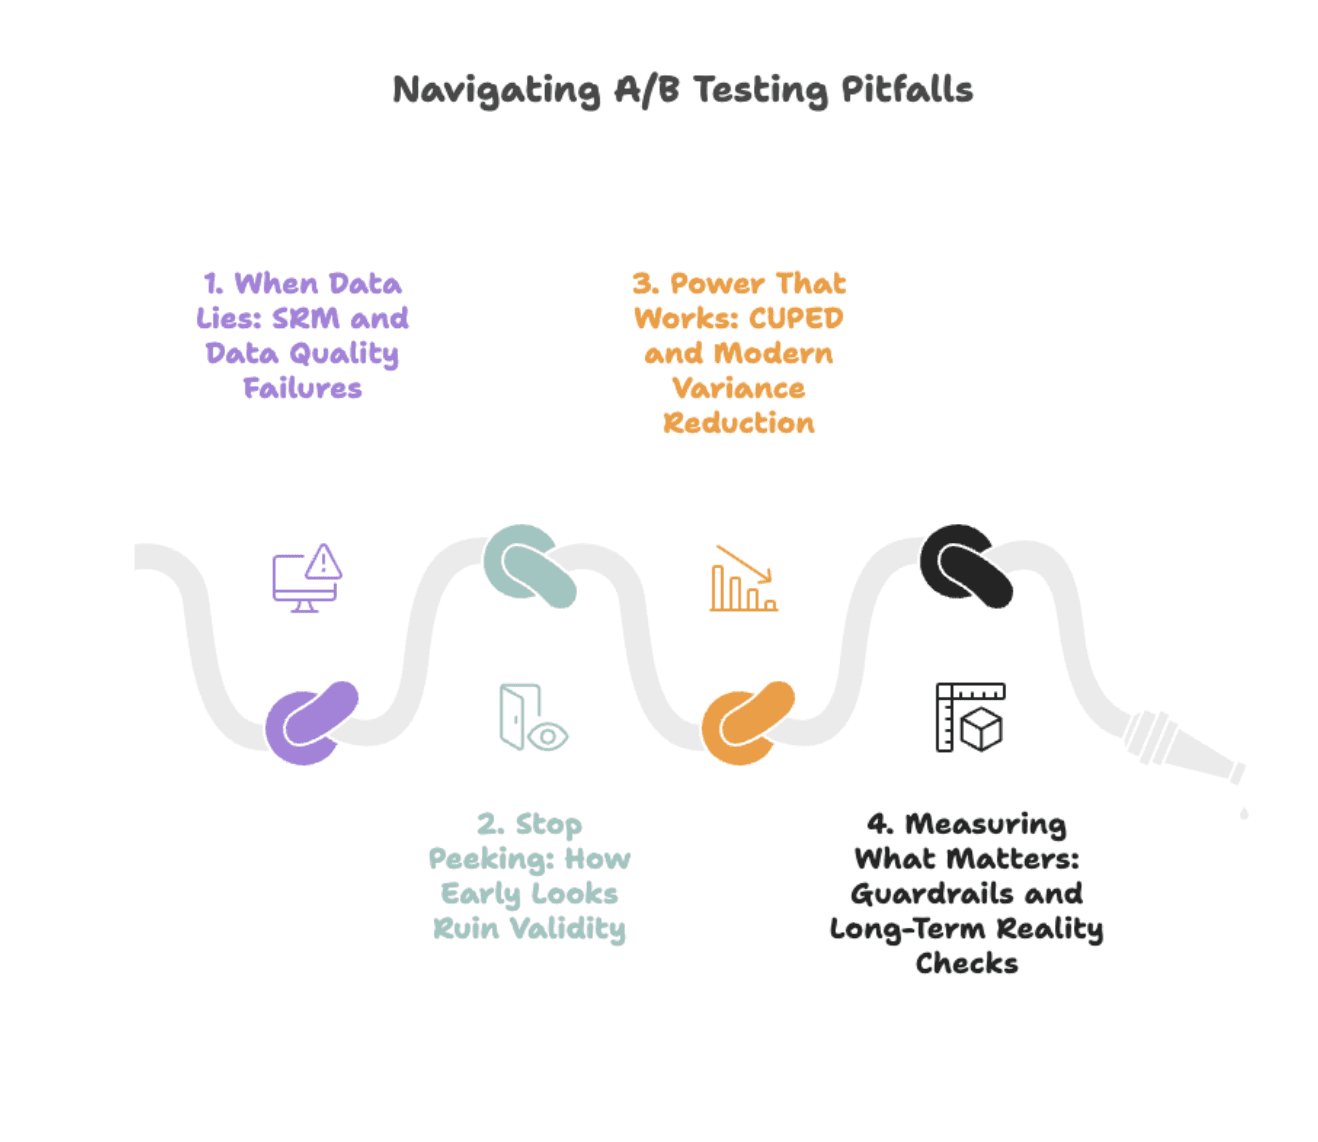
Image by Author
# When Data Lies: SRM and Data Quality Failures
Pitfall: Most "surprising" test results aren't insights; they're data-quality bugs wearing a disguise.
Sample Ratio Mismatch (SRM) is the canary in the coal mine. You expect a 50/50 split, you get 52/48. Sounds harmless. It's not. SRM signals broken randomization, biased traffic routing, or logging failures that silently corrupt your results.
Real-world case: Microsoft found that SRM signals severe data quality issues that invalidate experiment results, meaning tests with SRM often lead to wrong ship decisions.
DoorDash detected SRM after low-intent users dropped out disproportionately from one group following a bug fix, skewing results and creating phantom wins.
What to check if you have SRM:

Image by Author
- Chi-squared test for traffic splits: automate this before any analysis.
- User-level vs. session-level logging: mismatched granularity creates phantom effects.
- Time-based bucketing bugs: Monday users in control, Friday users in treatment = confounded results.
Solution: The fix isn't statistical cleverness. It's data hygiene. Run SRM checks before looking at metrics. If the test fails the ratio check, stop. Investigate. Fix the randomization. No exceptions.
Want to practice spotting data-quality issues like SRM or logging mismatches? Try a few real SQL data-cleaning and anomaly-detection challenges on StrataScratch. You'll find datasets from real companies to test your debugging and data validation skills.
Most teams skip this step. That's why most "successful" tests fail in production.
# Stop Peeking: How Early Looks Ruin Validity
Pitfall: Checking your test results every morning feels productive. It's not. It's systematically inflating your false positive rate.
Here's why: every time you look at p-values and decide whether to stop, you're giving randomness another chance to fool you. Run 20 peeks on a null effect, and you'll eventually see p < 0.05 by pure luck. Optimizely's research found that uncorrected peeking can raise false positives from 5% to over 25%, meaning one in four "wins" is noise.
How to recognize a naive approach:
- Run the test for two weeks.
- Check daily.
- Stop when p < 0.05.
- Result: You've run 14 multiple comparisons without adjustment.
Solution: Use sequential testing or always-valid inference methods that adjust for multiple looks.
Real-world case:
- Spotify's approach: Group sequential tests (GST) with alpha spending functions optimally account for multiple looks by exploiting the correlation structure between interim tests.
- Optimizely's solution: Always-valid p-values that account for continuous monitoring, allowing safe peeking without inflating error rates.
- Netflix's method: Sequential testing with anytime-valid confidence sequences switches from fixed-horizon to continuous monitoring while preserving Type I error guarantees.
If you must peek, use tools built for it. Don't wing it with t-tests.
Bottom line: Predefine your stopping rule before you start. "Stop when it looks good" isn't a rule; it's a recipe for fool's gold.
# Power That Works: CUPED and Modern Variance Reduction
Pitfall: Running longer tests isn't the answer. Running smarter tests is.
Solution: CUPED (Controlled-experiment Using Pre-Experiment Data) is Microsoft's solution to noisy metrics. The concept involves using pre-experiment behavior to predict post-experiment outcomes, then measuring only the residual difference. By removing predictable variance, you shrink confidence intervals without collecting more data.
Real-world example: Microsoft reported that for one product team, CUPED was akin to adding 20% more traffic to experiments. Netflix found variance reductions of roughly 40% on key engagement metrics. Statsig observed that CUPED reduced variance by 50% or more for many common metrics, meaning tests reached significance in half the time, or with half the traffic.
How it works:
Adjusted_metric = Raw_metric - θ × (Pre_period_metric - Mean_pre_period)
Translation: If a user spent $100/week before the test, and your test cohort averages $90/week pre-test, CUPED adjusts downward for users who were already high spenders. You're measuring the treatment effect, not pre-existing variance.
When to use CUPED?
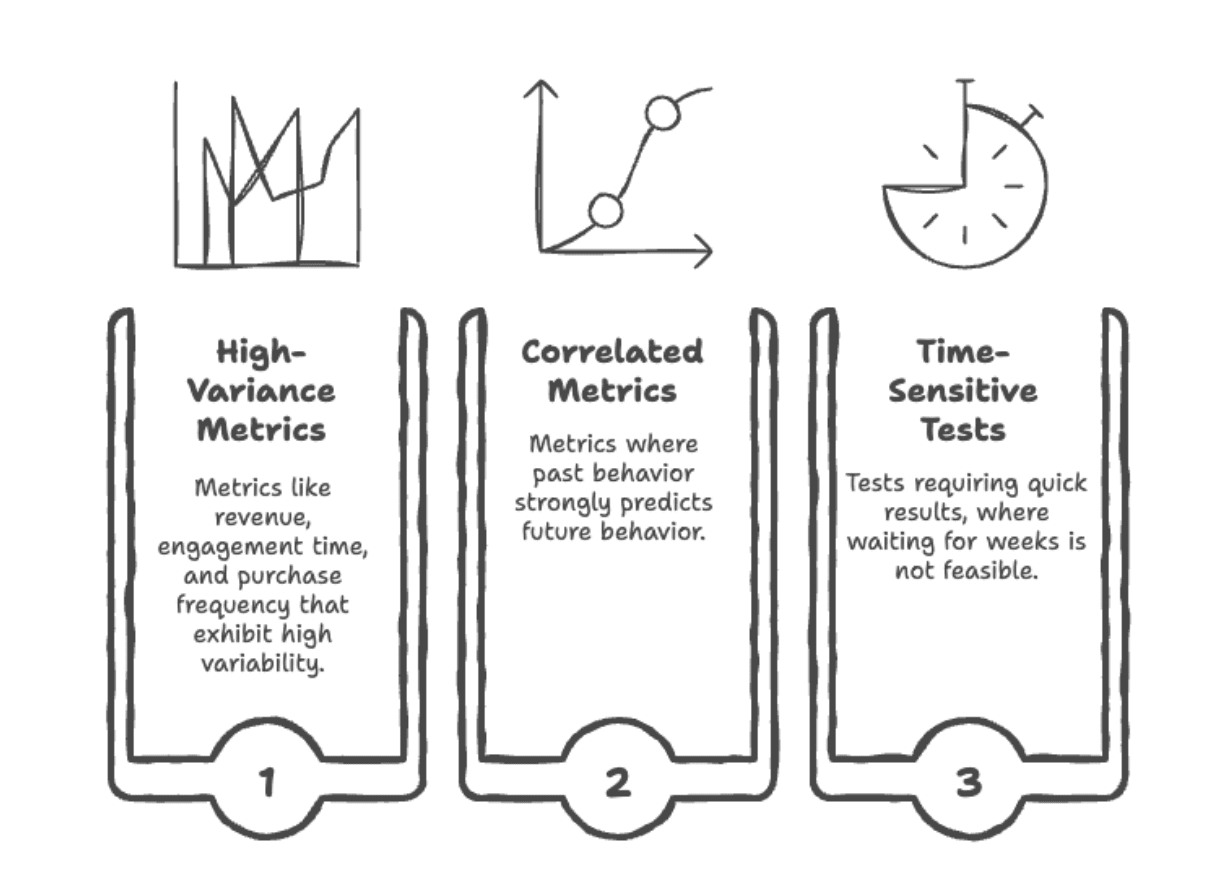
Image by Author
When not to use CUPED?
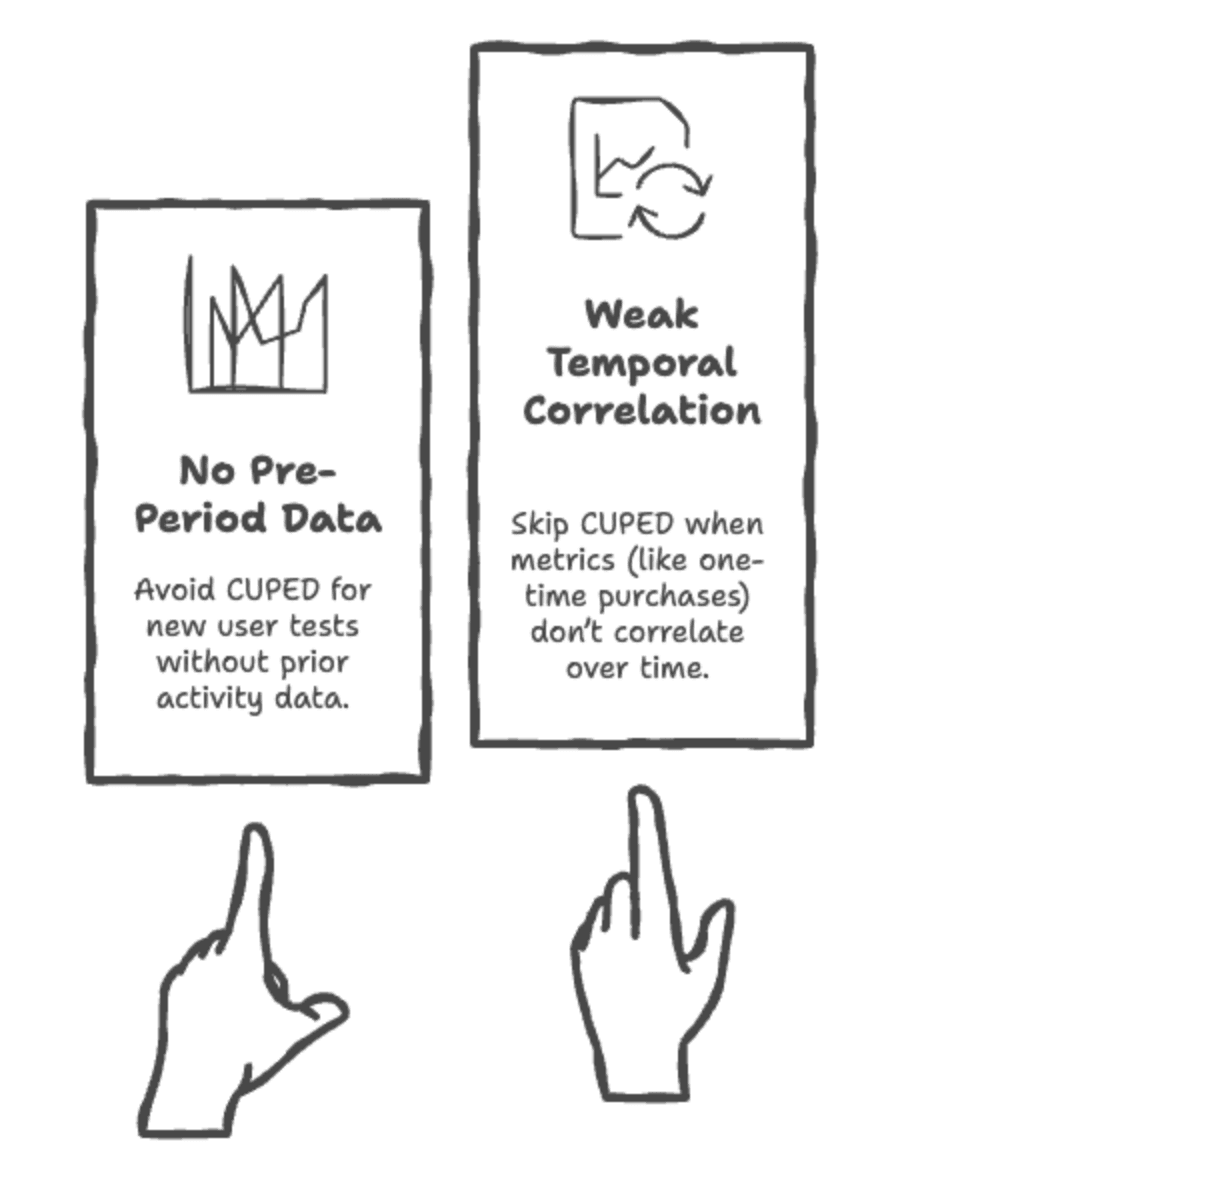
Image by Author
Newer methods like CUPAC (combining covariates across metrics) and stratified sampling push this further, but the principle stays the same: reduce noise before you analyze, not after.
Implementation note: Most modern experimentation platforms (Optimizely, Eppo, GrowthBook) support CUPED out of the box. If you're rolling your own, add pre-period covariates to your analysis pipeline; the statistical lift is worth the engineering effort.
# Measuring What Matters: Guardrails and Long-Term Reality Checks
Pitfall: Optimizing for the wrong metric is worse than running no test at all.
A classic trap: You test a feature that boosts clicks by 12%. Ship it. Three months later, retention is down 8%. What happened? You optimized a vanity metric without protecting against downstream harm.
Solution: Guardrail metrics are your safety net. They're the metrics you don't optimize for, but you monitor to catch unintended consequences:
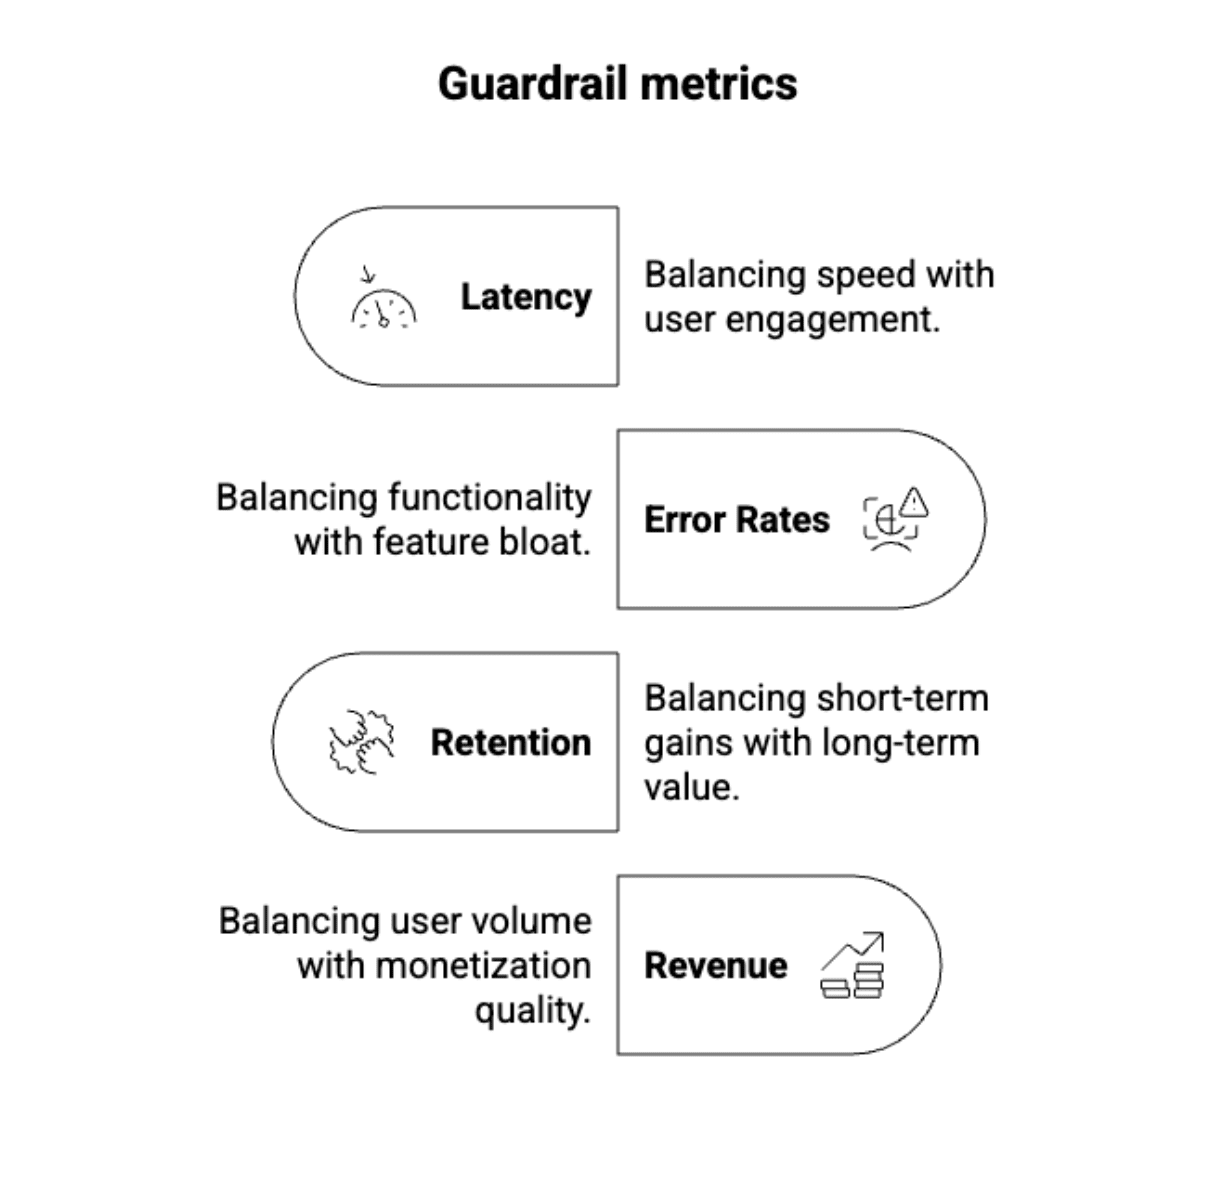
Image by Author
Real-world example: Airbnb discovered that a test increasing bookings also decreased review ratings; the change attracted more bookings but hurt long-term satisfaction. Guardrail metrics caught the problem before full rollout. Out of thousands of monthly experiments, Airbnb's guardrails flag roughly 25 tests for stakeholder review, preventing about five potentially major negative impacts each month.
How to structure guardrails:
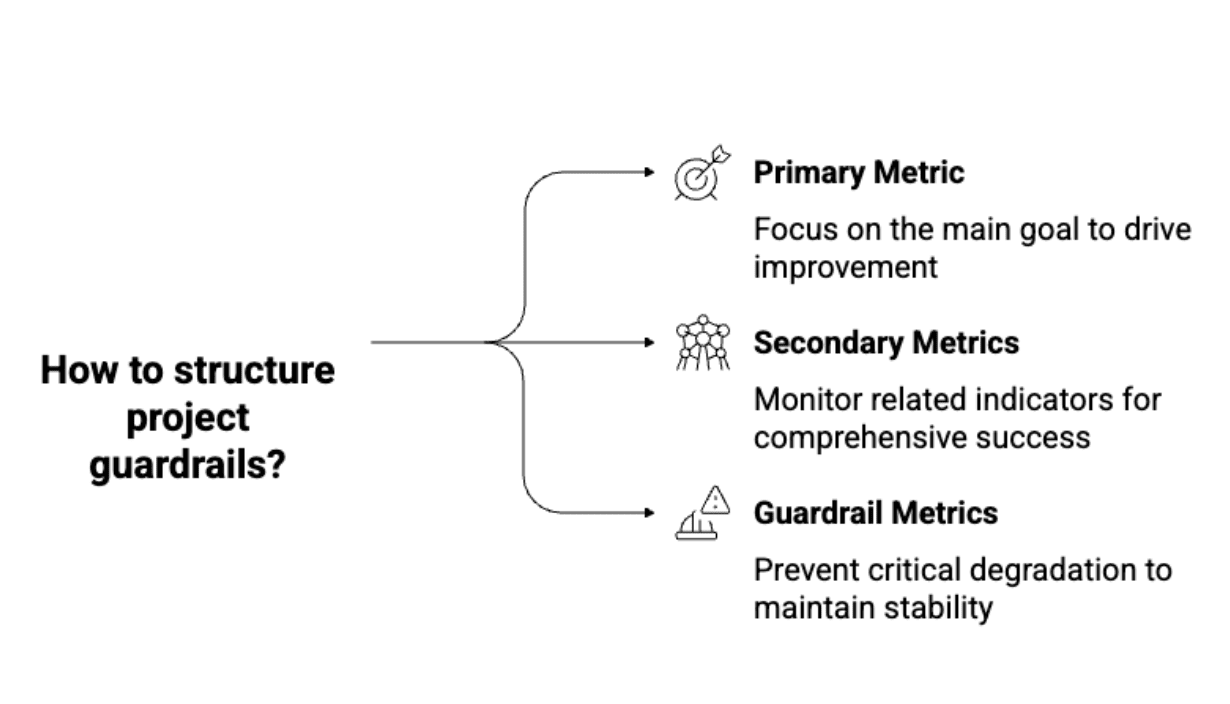
Image by Author
The novelty problem: Short-term tests capture novelty effects, not sustained impact. Users click new buttons because they're new, not because they're better. Companies use holdout groups to measure whether effects persist weeks or months after launch, typically keeping 5–10% of users in the pre-change experience while monitoring long-term metrics.
Best practice: Every test needs validation beyond the initial experiment:
- Phase 1: Standard A/B test (1–4 weeks) to measure immediate impact.
- Phase 2: Long-term monitoring with holdout groups or extended tracking to validate persistence.
If the effect disappears in Phase 2, it wasn't a real win: it was curiosity.
# What Top Experimenters Do Differently
The gap between good and great experimentation teams isn't statistical sophistication; it's operational discipline.
Here's what companies like Booking.com, Netflix, and Microsoft do that others don't:
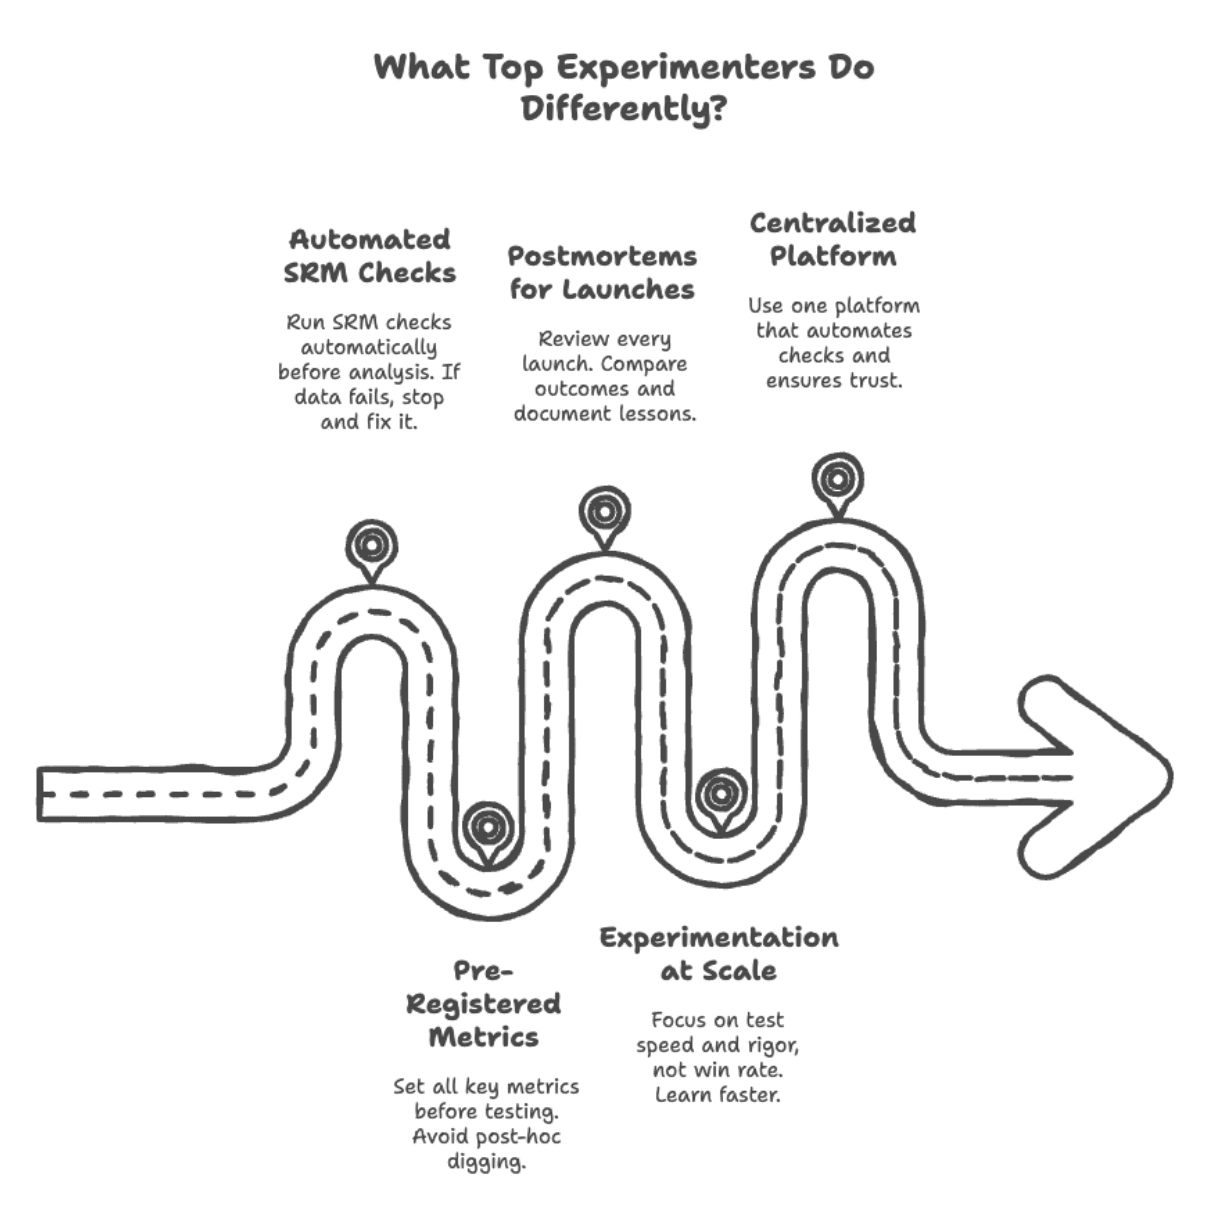
Image by Author
// Automating SRM Checks
Industry practice: Modern experimentation platforms like Optimizely and Statsig automatically run SRM tests on every experiment. If the check fails, the dashboard shows a warning. No override option. No "we'll investigate later." Fix it or don't ship.
Booking.com's experimentation culture demands that data quality issues get caught before results are analyzed, treating SRM checks as non-negotiable guardrails, not optional diagnostics.
// Pre-Registering Metrics
Best practice: Define primary, secondary, and guardrail metrics before the test starts. No post-hoc metric mining. No "let's check if it moved revenue too." If you didn't plan to measure it, you don't get to claim it as a win.
Netflix's approach: Tests include predefined primary metrics plus guardrail metrics (like customer service contact rates) to catch unintended negative consequences.
// Running Postmortems for Every Launch
Microsoft's ExP platform practice: Win or lose, every shipped experiment gets a postmortem:
- Did the effect match the prediction?
- Did guardrails hold?
- What would we do differently?
This isn't bureaucracy; it's learning infrastructure.
// Experimenting at Scale
Booking.com's results: Running 1,000+ concurrent experiments, they've learned that most tests (90%) fail, but that's the point. Testing volume isn't about wins; it's about learning faster than competitors.
Teams are measured not on win rate, but on:
- Test velocity (experiments per quarter).
- Data quality (keeping SRM rates low).
- Follow-through (% of valid wins that actually ship).
This discourages gaming the system and rewards rigorous execution.
// Building a Centralized Experimentation Platform
Great teams don't let engineers roll their own A/B tests. They build (or buy) a platform that:
- Enforces randomization correctness.
- Auto-calculates sample sizes.
- Runs SRM and power checks automatically.
- Logs every decision for audit.
Why this matters: Success in experimentation isn't about running more tests. It's about running trustworthy tests. The teams that win are the ones who make rigor automatic.
# Conclusion
The hardest truth in A/B testing isn't statistical; it's cultural. You can master sequential testing, implement CUPED, and define perfect guardrails, but none of it matters if your team checks results too early, ignores SRM warnings, or ships wins without validation.
The difference between teams that scale experimentation and teams that drown in false positives isn't smarter data scientists; it's automated rigor, enforced discipline, and a shared agreement that "it looked significant" isn't good enough.
Next time you're tempted to peek at a test or skip the SRM check, remember: the most expensive mistake in experimentation is convincing yourself the data is clean when it's not.
Nate Rosidi is a data scientist and in product strategy. He's also an adjunct professor teaching analytics, and is the founder of StrataScratch, a platform helping data scientists prepare for their interviews with real interview questions from top companies. Nate writes on the latest trends in the career market, gives interview advice, shares data science projects, and covers everything SQL.