Image by Editor
In an era where data reigns supreme, businesses and organizations are constantly on the lookout for ways to harness its power.
From the products you’re recommended on Amazon to the content you see on social media, there’s a meticulous method behind the madness.
At the heart of these decisions?
A/B testing and hypothesis testing.
But what are they, and why are they so pivotal in our data-centric world?
Let’s discover it all together!
The Magic Behind Your Screen
One important goal of statistical analysis is to find patterns in data and then apply these patterns in the real world.
And here is where Machine Learning plays a key role!
ML is usually described as the process of finding patterns in data and applying them to data sets. With this new ability, many processes and decisions in the world have become extremely data-driven.
Every time you browse through Amazon and get product recommendations, or when you see tailored content on your social media feed, there’s no sorcery at play.
It’s the result of intricate data analysis and pattern recognition.
Many factors can determine whether one might like to become a purchase. These can include previous searches, user demographics, and even the time of day to the color of the button.
And this is precisely what can be found by analyzing the patterns within data.
Companies like Amazon or Netflix have built sophisticated recommendation systems that analyze patterns in user behavior, such as viewed products, liked items, and purchases.
But with data often being noisy and full of random fluctuations, how do these companies ensure the patterns they’re seeing are genuine?
The answer lies in hypothesis testing.
Hypothesis Testing: Validating Patterns in Data
Hypothesis testing is a statistical method used to determine the likelihood of a given hypothesis to be true.
To put it simply, it’s a way to validate if observed patterns in data are real or just a result of chance.
The process typically involves:
#1. Developing Hypotheses
This involves stating a null hypothesis, which is assumed to be true and it is commonly the fact that observations are the result of chance, and an alternative hypothesis, which is what the researcher aims to prove.
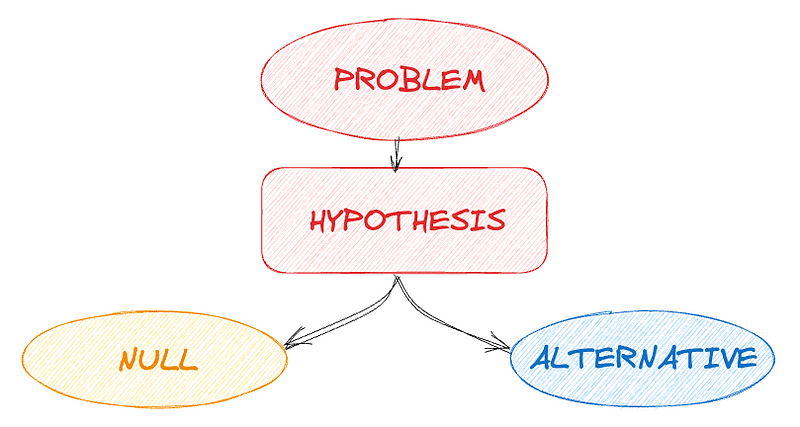
Image by Author
#2. Choosing a Test Statistic
This is the method and value which will be used to determine the truth value of the null hypothesis.
#3. Calculating the p-value
It’s the probability that a test statistic at least as significant as the one observed would be obtained assuming that the null hypothesis was true. To put it simply, it is the probability to the right of the respective test statistic.
The main benefit of the p-value is that it can be tested at any desired level of significance, alpha, by comparing this probability directly with alpha, and this is the final step of hypothesis testing.
Alpha refers to how much confidence is placed in the results. This means that an alpha of 5% means there is a 95% level of confidence. The null hypothesis is only kept when the p-value is less than or equal to alpha.
In general, lower p-values are preferred.
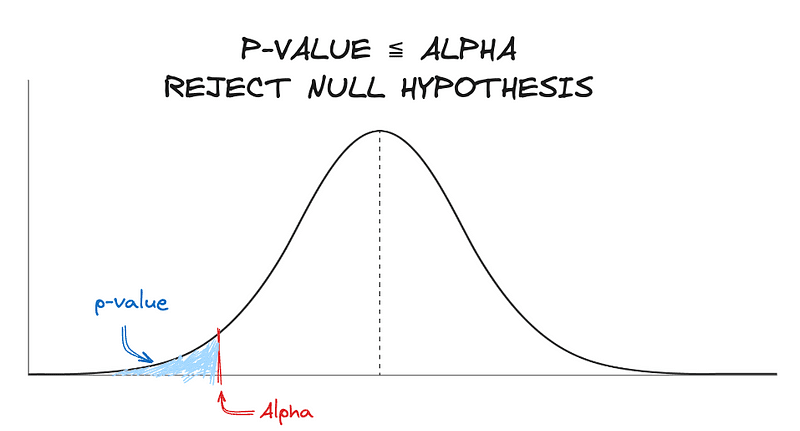
Image by Author
#4. Drawing Conclusions
Based on the p-value and a chosen level of significance with alpha, a decision is made to either accept or reject the null hypothesis.
For instance, if a company wants to determine if changing the color of a purchase button affects sales, hypothesis testing can provide a structured approach to make an informed decision.
A/B Testing: The Real-World Application
A/B testing is a practical application of hypothesis testing. It’s a method used to compare two versions of a product or feature to determine which one performs better.
This involves showing two variants to different segments of users simultaneously and then using success and tracking metrics to determine which variant is more successful.
Every piece of content a user sees needs to be fine-tuned to achieve its maximum potential. The process of A/B testing on such platforms mirrors hypothesis testing.
So… let’s imagine we are a social media and we want to understand if our users are more likely to engage when using green or blue buttons.
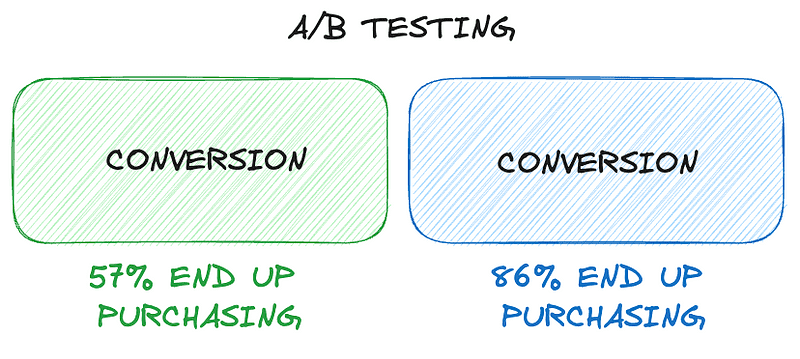
Image by Author
It involves:
- Initial Research: Understand the current scenario and determine what feature needs to be tested. In our case, the button color.
- Formulating Hypotheses: Without these, the testing campaign would be directionless. When using a blue color, users are more likely to engage.
- Random Assignment: Variations of the testing feature are randomly assigned to users. We split our users into two different randomized groups.
- Result Collection and Analysis: After the test, results are collected, analyzed, and the successful variant is deployed.
REAL A/B TESTING BUSINESS EXAMPLE
Keeping the idea that we are a social media company, we can try to describe a real case.
Objective: Increase user engagement on the platform.
Metric to Measure: Average time spent on the platform. This could be other relevant metrics like number of posts shared or number of likes.
#Step 1: Identify a Change
The social media company hypothesizes that if they redesign their share button to make it more prominent and easier to find, more users will share posts, leading to increased engagement.
#Step 2: Create Two Versions
- Version A (Null): The current design of the platform with the share button as it is.
- Version B (Alternative): The same platform but with a redesigned share button that’s more prominent.
#Step 3: Split Your Audience
The company randomly divides its user base into two groups:
- 50% of users will see Version A.
- 50% of users will see Version B.
#Step 4: Run the Test
The company runs the test for a predetermined period, say 30 days. During this time, they collect data on user engagement metrics for both groups.
#Step 5: Analyze the Results
After the testing period, the company analyzes the data:
- Did the average time spent on the platform increase for the Version B group?
#Step 6: Make a Decision
There are two main options once we have all data collected:
- If Version B outperformed Version A in terms of engagement, the company decides to roll out the new share button design to all users.
- If there is no significant difference or if Version A performed better, the company decides to keep the original design and rethink their approach.
#Step 7: Iterate
Always remember that iterating is key!
The company doesn’t stop here. They can now test other elements to continuously optimize for engagement.
It’s essential to ensure that the groups are randomly selected and that the only difference they experience is the change being tested. This ensures that any observed differences in engagement can be attributed to the change and not some other external factor.
Inferential Statistics: Beyond Just Differences
While it might seem straightforward to just compare the performance of two groups, inferential statistics, like hypothesis tests, provide a more structured approach.
For instance, when testing if a new training method improves delivery drivers’ performance, simply comparing performances before and after the training can be misleading due to external factors like weather conditions.
By using A/B testing, these external factors can be isolated, ensuring that the observed differences are truly due to the treatment.
Navigating the Data-Driven Landscape
In today’s world, where decisions are increasingly anchored in data, tools like A/B testing and hypothesis testing are indispensable. They offer a scientific approach to decision-making, ensuring that businesses and organizations don’t rely on mere intuition but on empirical evidence.
As we continue to generate more data and as technology evolves, the significance of these tools will only amplify.
Always remember, in the vast ocean of data, it’s not just about collecting information but also about learning how to deal with it and take advantage.
And with hypothesis and A/B testing, we have the compass to navigate these waters effectively.
Welcome to the fascinating world of data-driven decisions!
Josep Ferrer is an analytics engineer from Barcelona. He graduated in physics engineering and is currently working in the Data Science field applied to human mobility. He is a part-time content creator focused on data science and technology. You can contact him on LinkedIn, Twitter or Medium.