Hypothesis Testing Explained
This brief overview of the concept of Hypothesis Testing covers its classification in parametric and non-parametric tests, and when to use the most popular ones, including means, correlation, and distribution, in the case of one sample and two samples.

What is Hypothesis Testing?
According to Jim Frost, Hypothesis Testing is a form of inferential statistics that allows us to draw conclusions about an entire population based on a representative sample [..] In most cases, it is simply impossible to observe the entire population to understand its properties. The only alternative is to collect a random sample and then use statistics to analyze it [1].
When performing Hypothesis Testing, firstly, a hypothesis must be formulated. An example of a hypothesis is “there is a correlation between height and gender in a population,” or “there is a difference between two groups of a population.”
Usually, the thesis to be demonstrated is called the Alternative Hypothesis (HA), and its opposite is the Null Hypothesis (H0). In practice, the Null Hypothesis states that there is nothing new happening in the population.
In the previous examples, Null Hypotheses could be formulated as follows: there is no correlation between height and gender in the population, and there is not a difference between the two groups. The objective of Hypothesis Testing is to verify if the Null Hypothesis can be rejected or not. In general, rejecting the Null Hypothesis does not automatically mean that the alternative hypothesis is accepted. However, in some cases, rejecting the Null Hypothesis can imply that the Alternative Hypothesis can be accepted.
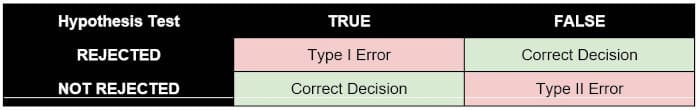
When performing a Hypothesis Test, two types of errors could occur:
- Type-I Error: reject the Null Hypothesis when it is actually true.
- Type-II Error: accept the Null Hypothesis when it is actually false.
The following table resumes Type I and Type 2 Errors:
Types of Hypothesis Tests
Hypothesis Tests can be classified into two big families [2]:
- Parametric Tests, if samples follow a normal distribution. In general, samples follow a normal distribution if their mean is 0 and variance is 1.
- Non-Parametric Tests, if samples do not follow a normal distribution.
Depending on the number of samples to be compared, two families of Hypothesis Tests can be formulated:
- One Sample, if there is just one sample, which must be compared with a given value
- Two Samples, if there are two or more samples to be compared. In this case, possible tests include correlation and difference between samples. In both cases, samples can be paired or not. Paired samples are also called dependent samples, while not paired samples are also called independent samples. In paired samples, natural or matched couplings occur.
Usually, parametric tests have the corresponding non-parametric test, as well described in [3].
The diagram featured at the top of this article reviews how to choose the right Hypothesis Test according to the sample.
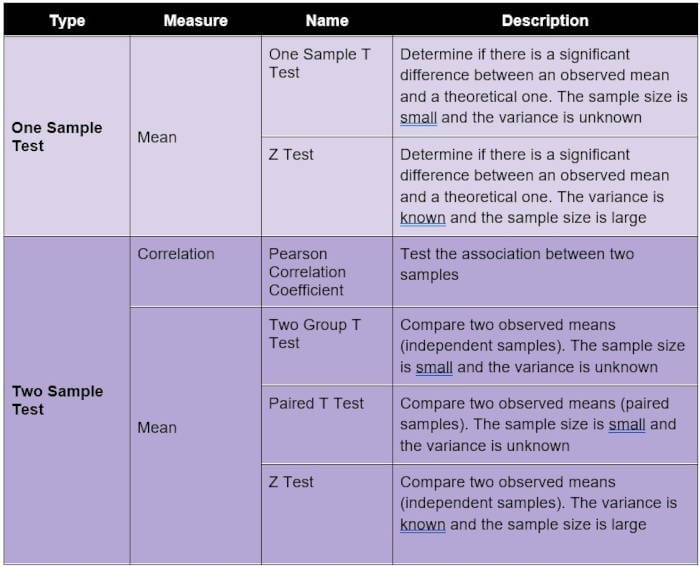
Parametric Tests
As already said, Parametric Tests assume a normal distribution in the data. The following table describes some of the most popular parametric tests and what they measure.
Non-Parametric Tests
Non-Parametric Tests do not make any assumptions on distribution in the data. The following table describes some of the most popular non-parametric tests and what they measure.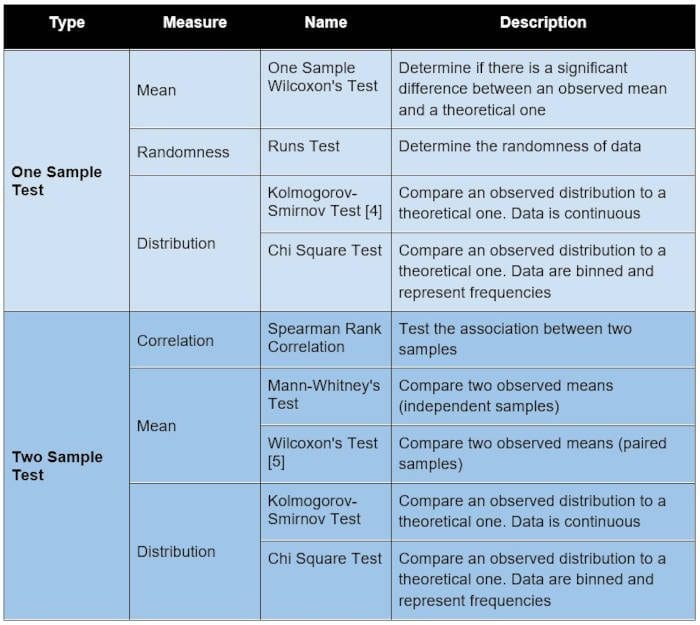
Summary
In this short article, I have described the concept of the Hypothesis Test, as well as the most popular tests and when they can be used.
For those who still have difficulty understanding hypothesis tests, there is a Python library, called easy-ht [6], which runs the main hypothesis tests without any knowledge of statistics. A tutorial on how to use easy-ht is available at this link.
References
[1] Statistical Hypothesis Testing Overview https://statisticsbyjim.com/hypothesis-testing/statistical-hypothesis-testing-overview/
[2] What Is The Difference Between Parametric And Non-Parametric Statistics? https://sourceessay.com/what-is-the-difference-between-parametric-and-non-parametric-statistics/
[3] Which statistical Test should you use? https://help.xlstat.com/s/article/which-statistical-test-should-you-use?language=en_US
[4] Kolmogorov–Smirnov test https://en.wikipedia.org/wiki/Kolmogorov%E2%80%93Smirnov_test
[5] Wilcoxon Test https://www.investopedia.com/terms/w/wilcoxon-test.asp
[6] easy-ht https://pypi.org/project/easy-ht/
Angelica Lo Duca (Medium) (@alod83)works as a post-doc at the Institute of Informatics and Telematics of the National Research Council (IIT-CNR) in Pisa, Italy. She is a professor of "Data Journalism" for the Master degree course in Digital Humanities at the University of Pisa. Her research interests include Data Science, Data Analysis, Text Analysis, Open Data, Web Applications, and Data Journalism, applied to society, tourism, and cultural heritage. She used to work on Data Security, Semantic Web, and Linked Data. Angelica is also an enthusiastic tech writer.