A/B Testing: A Comprehensive Guide
A/B testing is a method of comparing two versions of a web page, app, or other product to see which one performs better. This article covers the basics of A/B testing, how to design and run an effective experiment, and how to analyze and interpret the results.
A/B testing, also known as “split testing” or “randomized controlled trial” is a method of comparing two versions of a web page, app, or other product to see which one performs better. The basic idea of A/B testing is to divide your users into two groups: group A and group B. Group A (control variant) sees the original version of your product, while group B (test variant) sees a modified version with one or more changes. The changes can be anything from the color of a button, the layout of a page, the wording of a headline, backend algorithm powering your search result or the offer of a promotion. You then measure how each group behaves, such as how long users stay on your product, how many pages they visit, how many actions they take, or how much revenue they generate. By comparing the outcomes of each variant, you can determine which one is more effective at achieving your goal. If there are 2 variants it is referred to as A/B test and when there are more than 2 variants it is often referred to as A/B/C or A/B/N tests.
By running A/B tests, you can make data-driven decisions that improve your product and your business outcomes. An effective A/B test is one where you feel confident in making decisions based on the results. In this article, we will go over the basics of A/B testing, how to design and run an effective experiment, and how to analyze and interpret the results.
A/B Testing Can Help You Answer Questions Like:
- Which headline attracts more clicks?
- Which layout increases engagement?
- Which offer boosts sales?
- Which feature reduces churn?
When to Run A/B Tests?
There is no definitive answer to this question, as it depends on your goals, resources, and context. If you are wondering how new features would impact user engagement and impact key business metrics, A/B testing is a perfect candidate. However, some general guidelines are:
- Run A/B tests when you have enough traffic and conversions to get reliable results.
- Run A/B tests when you have a clear hypothesis and a measurable outcome.
- Run A/B tests when you have enough time to run them properly to avoid common pitfalls such as peeking, stopping too early, or running too many tests at once.
- Run A/B tests when you are ready to act on the results.
Let’s say you join as a Product Manager from company Contoso. You believe that changing the color of the BUY button would result in improved engagement and higher number of units sold. As a Product Manager you have an intuition that changing the color to blue would result in higher sales. Sometimes your intuition is correct and sometimes it’s wrong. How will you know this? Which is why your goal is to gather user insights into how the color of the button would impact user experience and key business metrics like revenue.
The steps involved in Running A/B Experimentation could be broken down as follows:
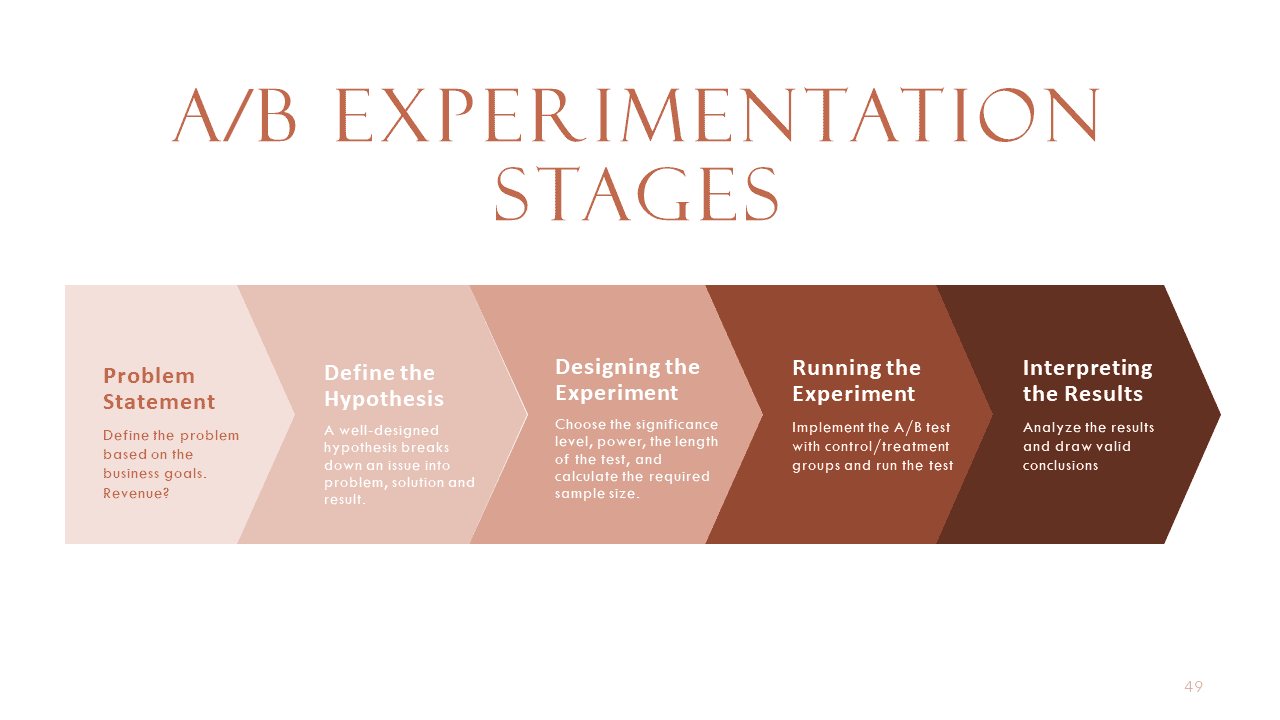
Problem Statement
A problem statement is a clear and concise description of the issue that needs to be addressed by an A/B experiment. It should include the current situation, the desired outcome, and the gap between them. A well-defined problem statement helps to focus the experiment design, align the stakeholders, and measure the success of the experiment. Before running an A/B experiment, it is important to define the problem statement to avoid wasting resources, time, and effort on irrelevant or invalid tests. Depending on the industry the problem statement could differ.
Some examples of problem statements depending on the industry are:
| Travel Companies like Expedia, Booking.com |
|
| Media Companies like Netflix, Hulu |
|
| E-Commerce Company like Amazon, Walmart |
|
| Social Media Companies like Instagram, Facebook |
|
Define the Hypothesis
What is a Hypothesis? A hypothesis in A/B experimentation is a testable statement that predicts how a change in a website or app will affect a certain metric or user behavior.
The three steps of defining the Hypothesis include:
- We know we have [this problem] based on [evidence].
- You believe we should implement [this change] to achieve [this outcome] as this would improve [this problem].
- We know we have achieved [this outcome] when we see [this metric] change.
Examples of a Hypothesis include:
- We are seeing [lesser number of units sold] on E-Commerce website through [sales data] for the last year.
- We believe that Incorporating social proof elements, such as showcasing the number of people who have purchased a particular product within a specific time frame[for example, “X” people purchased in the last 24 hours], can create a sense of urgency and [influence visitors to make a purchase]. This psychological trigger taps into the fear of missing out and [encourages potential buyers to convert].
- We know we have achieved [higher conversions] when we see [revenue increase/units sold increase].
Null Hypothesis ( ): The average revenue per day per user between the baseline and variant treatments are the same.
Alternate Hypothesis (): The average revenue per day per user between the baseline and variant treatments are different.
Significance level: : Lower the significance level more statistical significance that the difference between control and variant didn’t happen by chance.
Statistical Power: : Probability of detecting an effect if the alternate hypothesis is true.
Designing the Experiment
To run a successful experiment, you need to collaborate with different teams and follow some steps. First, you need to define your key metric, which is a quantitative measure that reflects how well you are achieving your goals. For example, if you want to test whether changing the color of the buy button on your website affects the sales, your key metric would be the revenue per user per month. This metric captures the effect of the color change on the user behavior and the business outcome. Second, you need to work with the UX team to design two versions of the buy button: one with the original color and one with the new color. These are called the control variant and the test variant. The UX team can help you ensure that the design is consistent, appealing and user-friendly. Third, you need to work with the engineering team to implement and deploy the two variants on your website. The engineering team can help you ensure that the code is bug-free, secure and scalable. Fourth, you need to work with the data team to set up a monitoring system that tracks and collects the key metric data from both variants. The data team can help you ensure that the data is accurate, reliable and accessible. Fifth, you need to decide how to randomize the users who visit your website into either the control group or the test group. Randomization is important because it ensures that the two groups are statistically similar and that any difference in the key metric is due to the color change and not some other factors. You can use different methods of randomization, such as cookie-based, user ID-based or IP-based. Sixth, you need to determine how many users you need in each group to detect a significant difference in the key metric. This is called the sample size and it depends on several factors, such as the expected effect size, the standard deviation of the key metric, the significance level and the power of the test. You can use a formula or a calculator to estimate the sample size based on these factors.
Running the Experiment
The next step in the experimentation process is to launch your experiment to a subset of your users and monitor its performance. You should start with a low exposure rate and gradually increase it as you gain confidence in your experiment. You should also collect data on the key metrics that you defined in your hypothesis and track how they change over time. To help you with this, you should partner with the Dev team to build a dashboard that displays the metric values and their statistical significance. You should avoid peeking at the results and drawing premature conclusions before the experiment is over. You should also run your experiment for a sufficient duration to ensure that you have enough data to make a valid decision. Depending on your traffic volume and conversion rate, this could take days, weeks, or months.
Interpreting the Results
Before you launch any change based on your experiment, you need to perform some sanity checks to ensure that your data is reliable and valid. Sanity checks are quality control measures that help you detect any errors or anomalies in your data collection or analysis process. For example, you can check if the traffic allocation was done correctly, if the invariant metrics were consistent across the experiment groups, and if there were any external factors that could have influenced the results. If you find any issues with your data, you should discard it and rerun the experiment with the correct setup.
Once you have verified that your data is trustworthy, you can proceed to launch the change. To do this, you need to analyze your results and draw conclusions based on your hypothesis and success metrics. You can use statistical methods such as hypothesis testing, confidence intervals, and effect size to compare the performance of your variations and see if there is a clear winner or a tie. If there is a winner, you can implement the winning variation on your website or app and end the experiment. If there is a tie, you may need to run another experiment with a different hypothesis or a larger sample size to get more conclusive results.
Poornima Muthukumar is a Senior Technical Product Manager at Microsoft with over 10 years of experience in developing and delivering innovative solutions for various domains such as cloud computing, artificial intelligence, distributed and big data systems. I have a Master's Degree in Data Science from the University of Washington. I hold four Patents at Microsoft specializing in AI/ML and Big Data Systems and was the winner of the Global Hackathon in 2016 in the Artificial Intelligence Category. I was honored to be on the Grace Hopper Conference reviewing panel for the Software Engineering category this year 2023. It was a rewarding experience to read and evaluate the submissions from talented women in these fields and contribute to the advancement of women in technology, as well as to learn from their research and insights. I was also a committee member for the Microsoft Machine Learning AI and Data Science (MLADS) June 2023 conference. I am also an Ambassador at the Women in Data Science Worldwide Community and Women Who Code Data Science Community.