A Comprehensive Guide to Essential Tools for Data Analysts
Data analyst tools encompass programming languages, spreadsheets, BI, and big data tools. Here are 9ish tools that cover all the tasks of data analysts well.
Image by author
When you think of data analysis, what are the four main tasks you always have to do? Forget about those fancy infographics showing the data analysis cycle; let’s keep it very simple: you get the data, you manipulate it, you analyze it, and you visualize it.
Hopefully, you won’t want to do that by using the abacus and shifting through the papyrus scrolls. Nothing against being retro, but let’s at least embrace the electricity. Possibly also some other nice tools that all those tech guys and gals created to earn money. Sorry, help us in our data analysis journey.
My sarcasm aside, there are some really useful tools for data analysts that allow for data to be used and analyzed very elegantly.
I have already written about some of them when I covered the most useful tools for data scientists. Now, it’s time to do the same for data analyst tools.
Data Analyst Tools Overview
Most tools I’ll discuss can do everything data analysts do, from fetching and manipulating data, to analyzing and visualizing it.
Of course, they’re not equally good at all those tasks. So, I tried to rank their use in the overview below. This should help you understand when to use what tool.
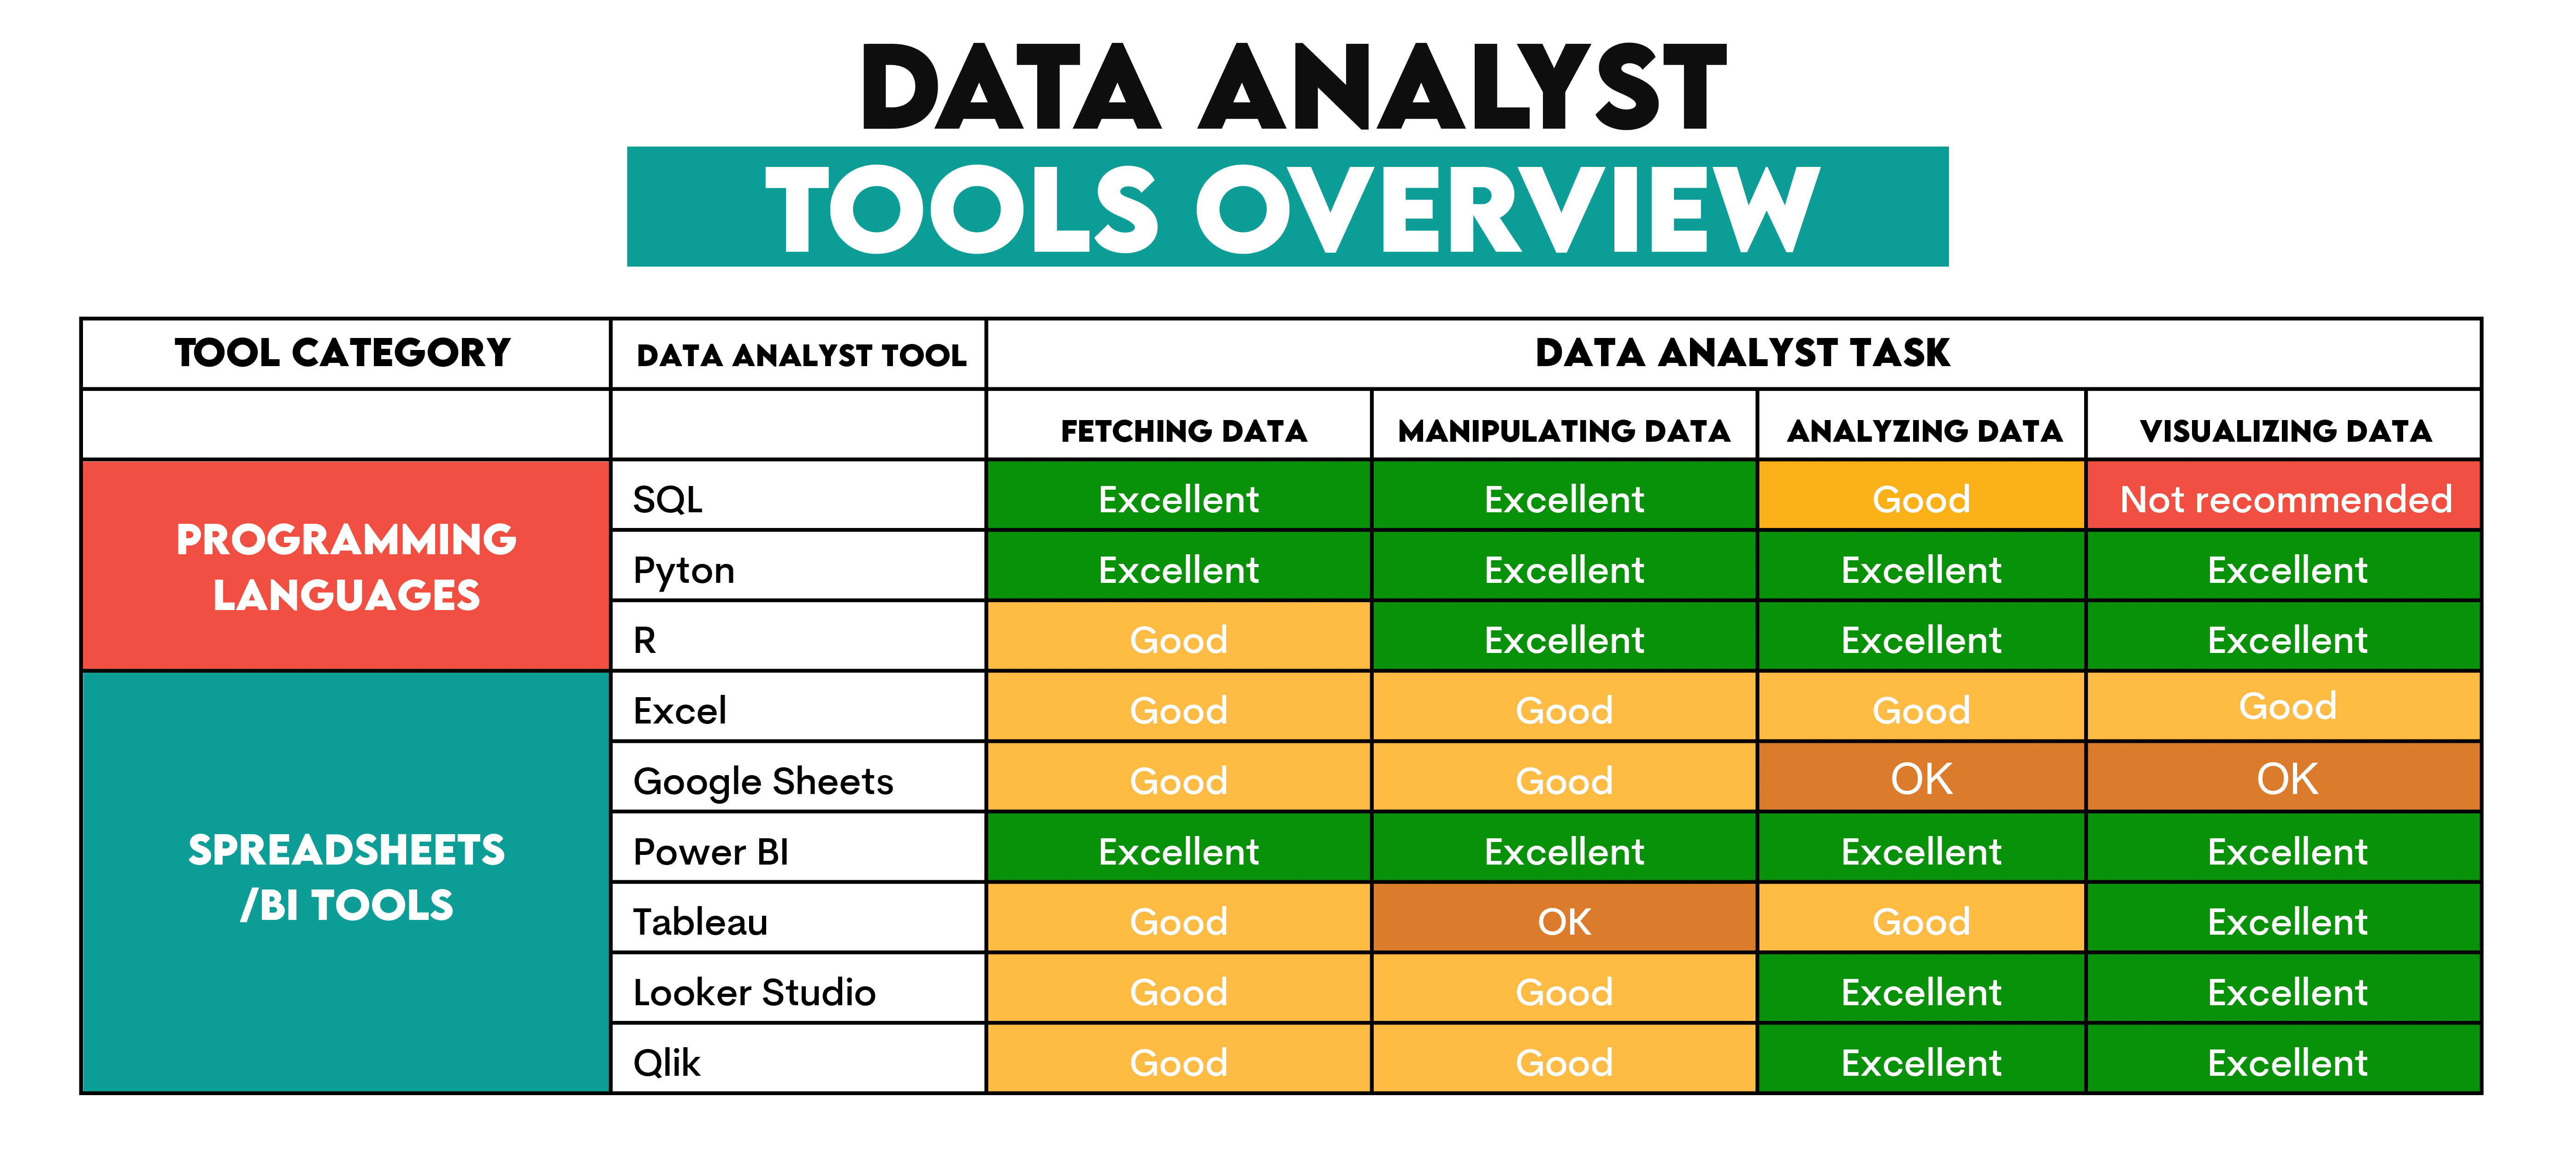
In the broadest sense, the data analyst tools can be categorized into programming languages and spreadsheets/BI tools.
Programming Languages
1. SQL
Use: Fetching, manipulating, analyzing data
Description: SQL is the ultimate master in querying data saved in relational databases. It’s specifically designed for extracting and manipulating data and making changes to data (such as inserting, updating, or deleting) directly in the database. It’s designed for precisely that purpose, and it fulfills it brilliantly!
It’s also quite good at analyzing data. However, it can show its limitations compared to the programming languages below.
2. Python
Use: Fetching, manipulating, analyzing, visualizing data
Description: Python is a general-purpose language, a darling of data scientists and data analysts. It’s relatively easy to learn and has plenty of specific-purpose libraries for data analysis tasks.
Data analysts typically write Python code in Jupyter Notebook directly or through the services such as Google Colab or Anaconda. There are also some other similar tools, such as Sage Maker, which is nothing but Amazon’s version of Jupyter Notebook.
Using notebooks means you can code and view your code’s output step-by-step. This is much easier than the traditional coding in IDEs and code editors.
What makes Python so flexible is a wide range of libraries for different purposes.
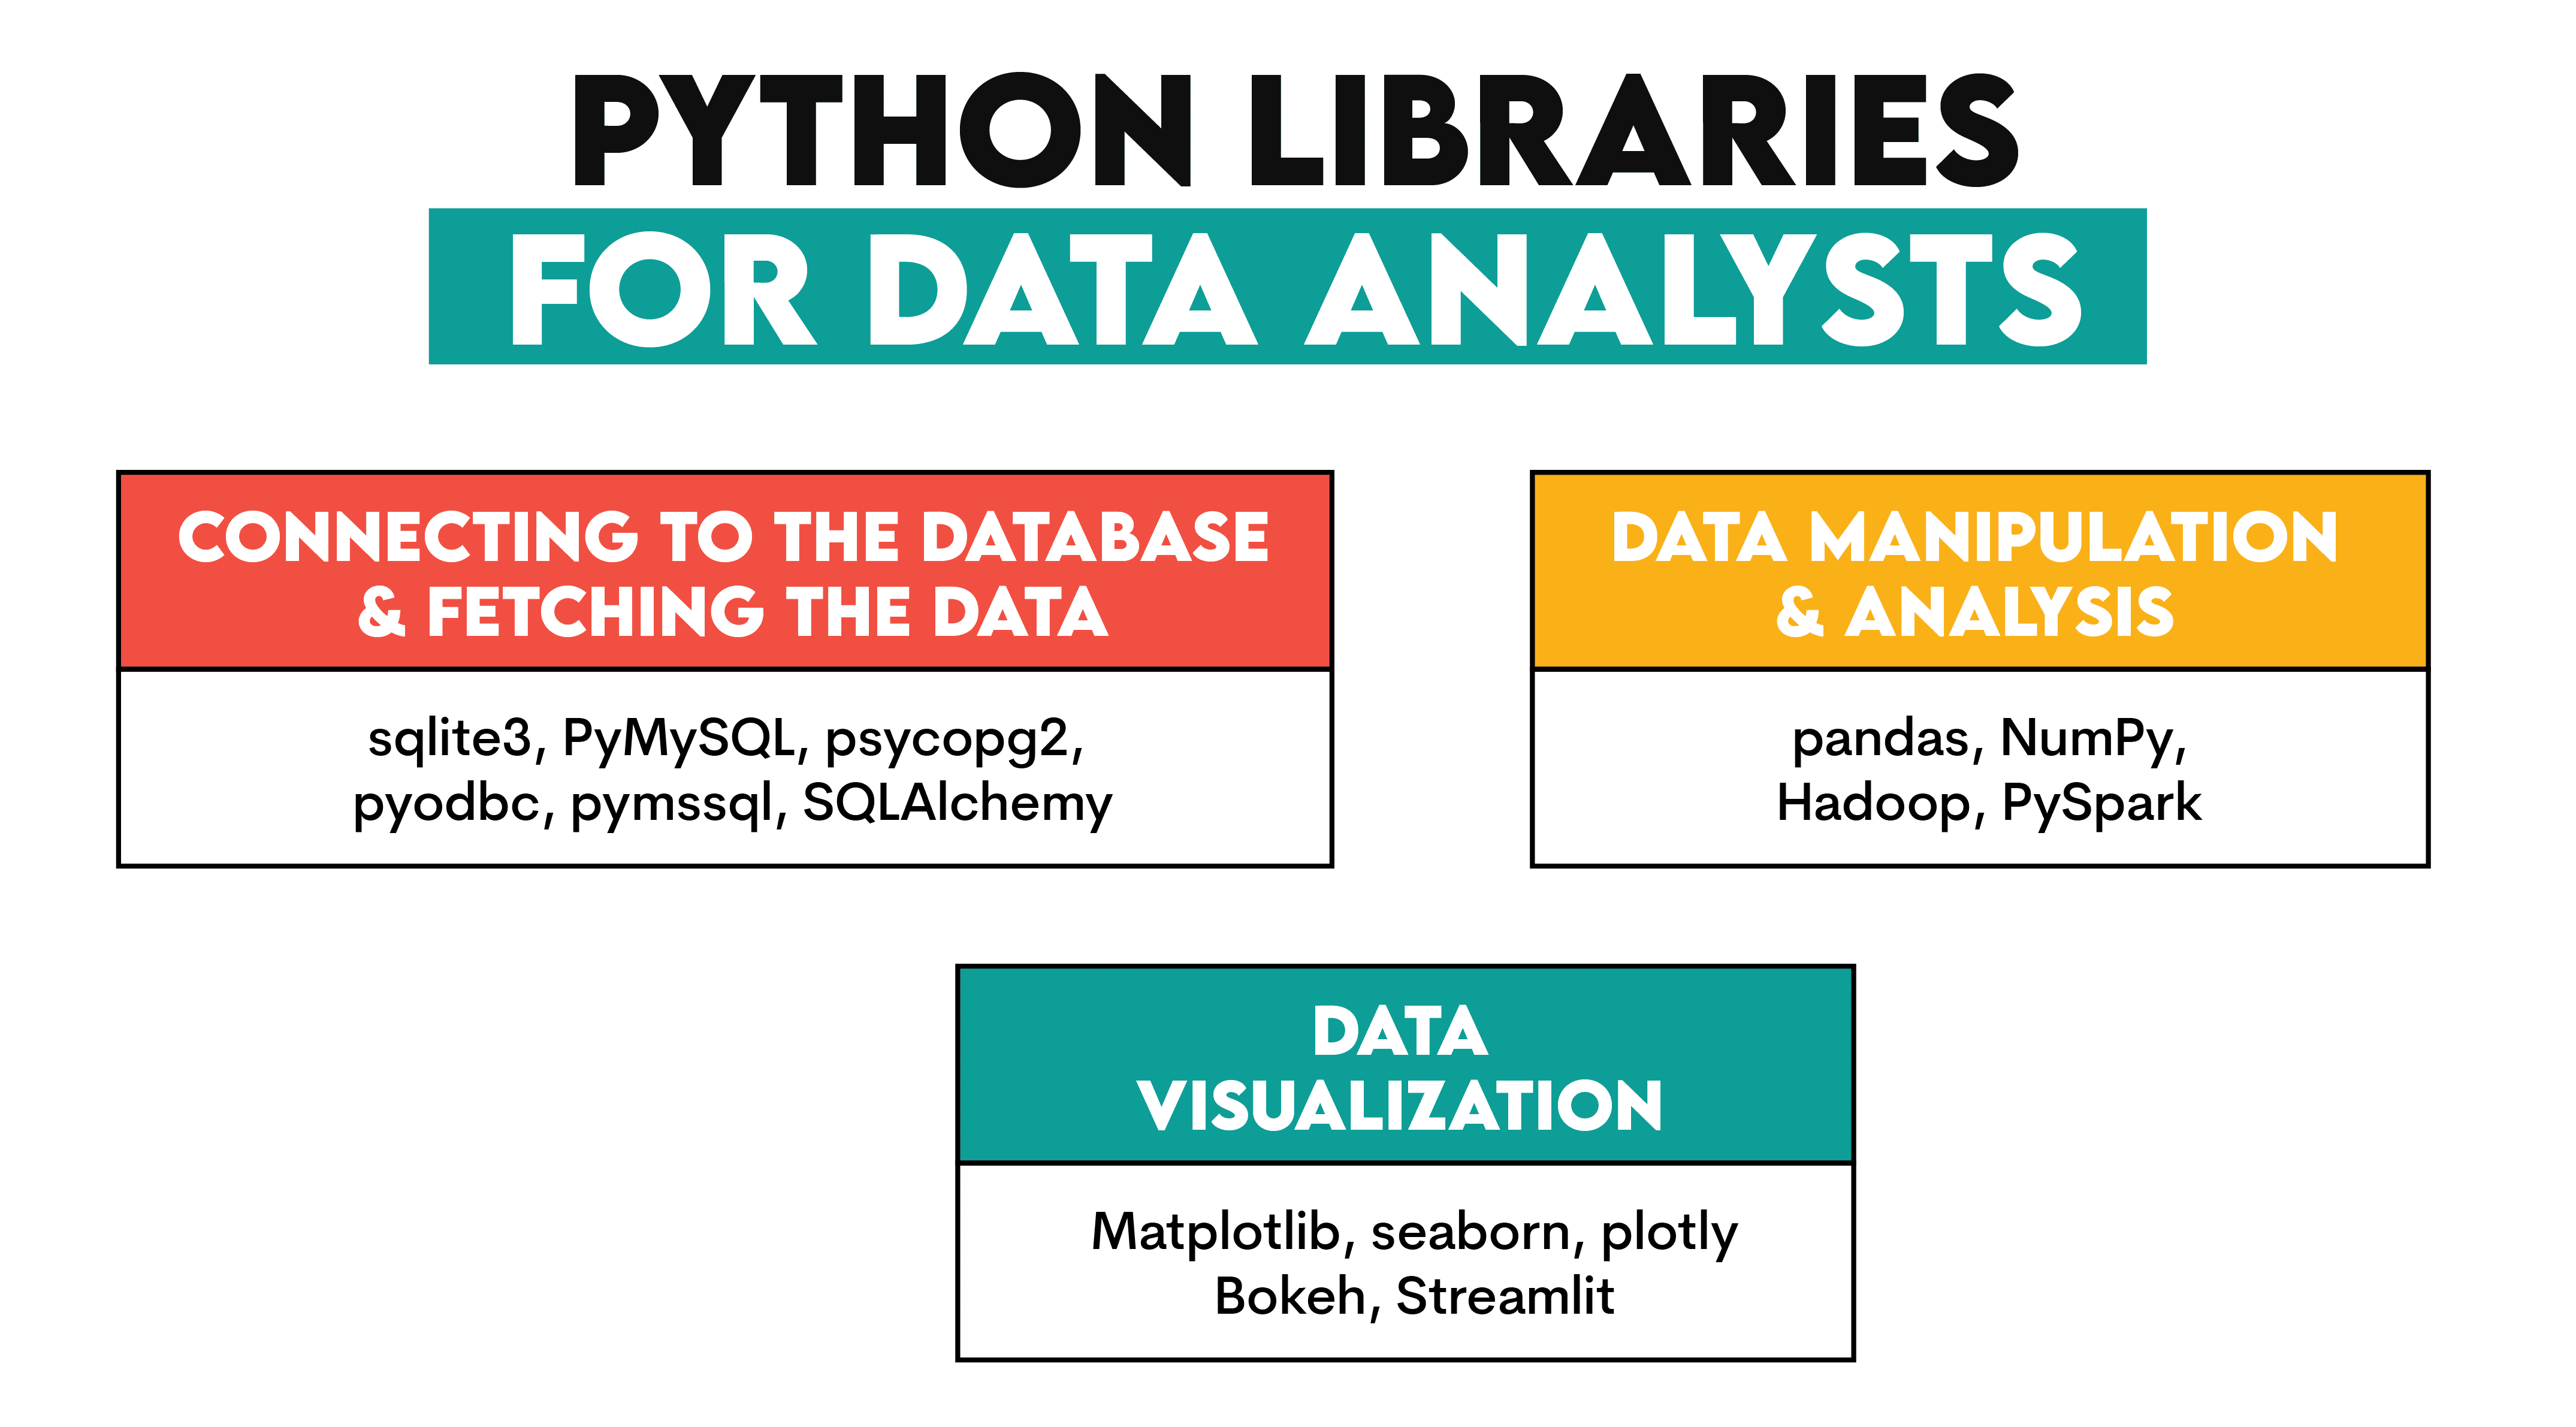
With Python, you can connect to a database and fetch the data via various toolkits:
- sqlite3 – A built-in Python library for accessing databases.
- PyMySQL – A Python library for connecting to MySQL.
- psycopg2 – An adapter for the PostgreSQL database.
- pyodbc & pymssql - Python driver for SQL Server.
- SQLAlchemy – The database toolkit for Python and object-relational mapper.
It also has excellent libraries designed specifically for data manipulation and analysis:
- pandas – For manipulating and analyzing data using data structures such as DataFrames and Series
- NumPy – For mathematical operations and working with arrays.
- Hadoop – For faster processing of big data, with data analysis usually done via Apache Pig or Apache Hive
- PySpark – For big data processing and analysis at enterprises.
Regarding the data visualization, commonly used Python libraries are:
- Matplotlib – A plotting library offering some basic but not too beautiful 2D visualizations.
- seaborn – A fancier library for making much sexier visualizations.
- plotly – For interactive visualizations.
- Bokeh – For interactive visualizations.
- Streamlit – For creating interactive web applications.
3. R
Use: Fetching, manipulating, analyzing, visualizing data
Description: R is a programming language designed for statistical analysis and visualization. So, yes, it’s great at those two tasks. But do not worry; it can also fetch and manipulate data.
Data analysts don’t use it that often – SQL and Python are usually enough, especially when combined – so it’s optional for you.
While R's library ecosystem is not as rich as Python’s, it still has some very good libraries for data analyst tasks.
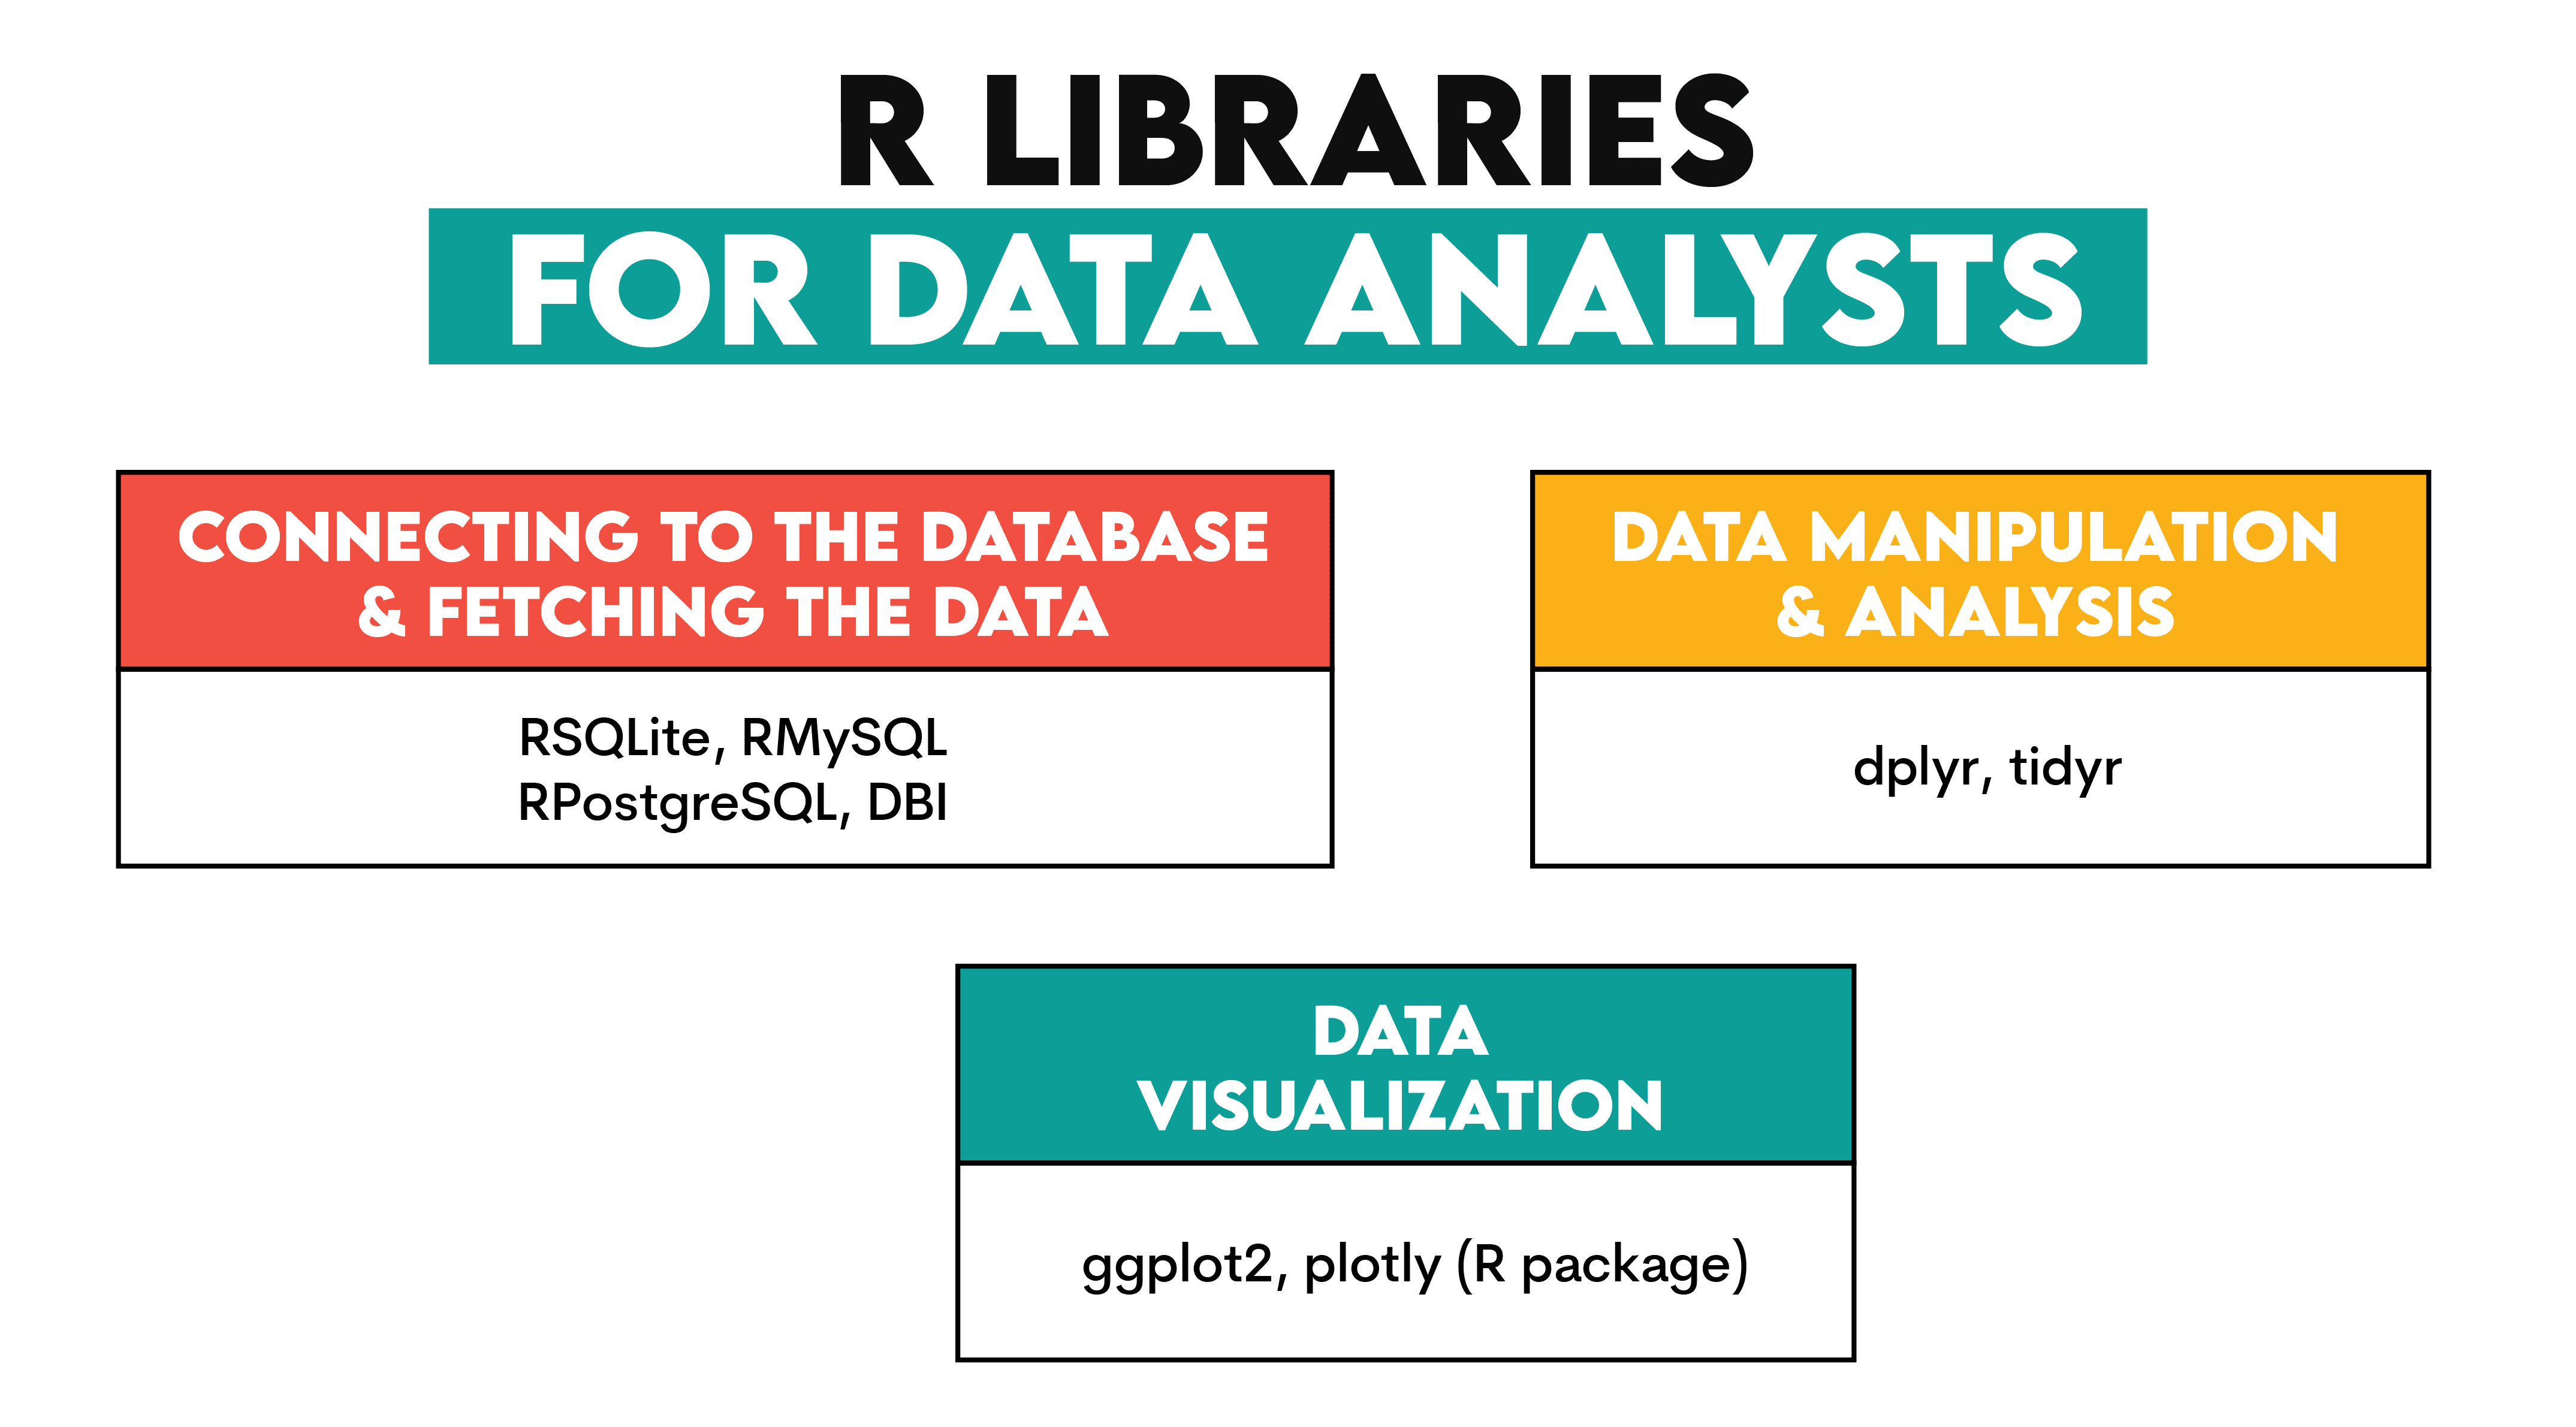
To query databases in R, you have these popular tools at your disposal.
- RSQLite – An R interface for SQLite.
- RMySQL – For accessing MySQL.
- RPostgreSQL - For accessing PostgreSQL.
- DBI - An R interface for connecting to databases.
The two main libraries for data manipulation and analysis in R are:
Finally, the standard data visualization features can be extended by:
Spreadsheets & Visualization Tools for Data Analysts
4. Excel/Google Sheets
Use: Fetching, manipulating, analyzing, visualizing data
Description: Be snide all you want, but Microsoft Excel is still one of the most commonly used tools by data analysts, and for a reason. It allows you to import data from external sources, including CSV and databases. Additionally, you can use Power Query to query databases directly from Excel.
Its various features and built-in formulas allow you to manipulate and do quick analysis. Excel also has visualization capabilities, where you can create quite informative graphs.
Google Sheets is a Google version of Excel and it offers similar capabilities.
5. Power BI
Use: Fetching, manipulating, analyzing, visualizing data
Description: It’s quite similar to Excel. You can think of it as Excel on steroids. It does everything Excel does, only on a more sophisticated level. This is especially so when it comes to data manipulation, analysis, and visualization.
Power BI allows you to model, manipulate, and analyze data using drag-and-drop and the DAX and M languages. As a BI tool, it excels at data visualization dashboards.
Since it’s a Microsoft product, Power BI integrates well with other Microsoft products, such as Azure, Office 365, and Excel.
6. Tableau
Use: Visualizing data
Description: Tableau is marketed as a BI and analytics software, so this is what it does. However, I think it especially shines when it comes to data visualization. You can make attractive and interactive visualizations and do so easily by using Tableau’s drag-and-drop interface.
7. Looker Studio
Use: Fetching, manipulating, analyzing, visualizing data
Description: This is (now) a Google tool, part of Google Cloud. It’s particularly well suited for data analysis and visualization. Its unique feature is the use of the LookML language for data modeling. This data analyst tool easily integrates with other Google Cloud services and big data tools in general.
8. Qlik
Use: Fetching, manipulating, analyzing, visualizing data
Description: Qlik is used by data analysts for all their typical tasks. It can connect to various data sources, so you can easily load data in the tool. Manipulating and analyzing data is unique to Qlik, as it uses the Associative Big Data Index, which makes exploring connections across different data sources much easier.
As for data visualization, Qlik is known for its interactive data visualization capabilities.
Conclusion
These eight (nine, if you count Excel and Google Sheets as two) tools are essential for every data analyst. While some are designed for a specific task within data analysis, most can do everything you need: query data, manipulate it, analyze it, and visualize it.
The tools can be conceptually divided into programming languages, and spreadsheets & BI tools. Depending on your technical skills, data at your disposal, and analysis requirements, you’ll use all or some of these tools.
But be sure you’ll need to know at least 2-3 tools, no matter where you work as a data analyst.
Nate Rosidi is a data scientist and in product strategy. He's also an adjunct professor teaching analytics, and is the founder of StrataScratch, a platform helping data scientists prepare for their interviews with real interview questions from top companies. Nate writes on the latest trends in the career market, gives interview advice, shares data science projects, and covers everything SQL.