Leveraging Geospatial Data in Python with GeoPandas
A comprehensive introduction to geospatial data analysis with GeoPandas.
Spatial data consists of records associated with locations. This data can come from GPS tracks, earth observation imagery, and maps. Each spatial data point can be precisely placed on a map using coordinate reference systems like latitude/longitude pairs for exact placement on maps, which enables us to investigate relationships among them.
Spatial data's true potential lies in its ability to connect data points and their respective locations, creating endless possibilities for advanced analysis. Geospatial data science is an emerging field within data science that seeks to harness geospatial information and extract valuable insights through spatial algorithms and advanced techniques such as machine learning or deep learning to draw meaningful conclusions about what events have taken place and their causes. Geospatial data science gives us insight into where events happen as well as why they happen.
GeoPandas is an open-source Python package specifically tailored for working with information. It expands upon pandas' array of datatypes by providing spatial operations on geometric objects - which facilitates spatial analyses in Python using pandas' data-manipulation tool, pandas. Since GeoPandas is built upon Pandas it offers an easy path for professionals familiar with Python syntax to become acquainted with GeoPandas syntax quickly.
1. Installing GeoPandas
We have to install the GeoPandas package to be able to use it. However, it is critical to note that GeoPandas depends on other libraries that must be installed to use it without problems. These dependencies are shapely, Fiona, pyproj, and rtree.
There are two ways you can download the GeoPandas package. First, you can use conda to install the GeoPandas conda package. This method is recommended as it will provide the dependencies of GeoPandas without the need to install them on your own. You can run the following command to install GeoPandas:
conda install geopandas
The second method is to use pip which is the standard package installer in Python. However, using this method will require installing the rest of the mentioned dependencies.
pip install geopandas
Once the GeoPandas package is installed you can import it into your Python code using the following command:
import geopandas as gpd
2. Reading & Writing Spatial Data
GeoPandas is used to read spatial data and convert it into GeoDataFrame. However, it is important to note that there are two main types of spatial data:
- Vector data: The vector data describes the features of the geography of earth locations using discrete geometry using the following terms point, line, and polygon.
- Raster data: The raster data encodes the world as a surface represented by a grid. Each pixel of this grid is represented by a continuous value or categorical class.
GeoPandas mainly works with vector data. However, it can be used in conjunction with other Python packages to handle raster data, such as rasterio. You can use the powerful geopandas.read_file() function to read most of the vector-based spatial data. There are two main data types of vector-based partial data:
- Shapefile: Shapfile is the most common data format and is considered the industry-level data type. It consists of three files that are compressed and usually provided as a zip file:
The .shp file: This file contains the shape geometry.
The .dbf file: This file holds attributes for each geometry,
The .shx file: This is the shape index file that helps link the attributes to the shapes.
- GeoJSON: This is a new file format of geospatial data released in 2016. Since it consists of only a single file it is easier to use it compared to the Shapefile.
In this article, we will use the geopandas.read_file() function to read a GeoJSON file hosted in GitHub containing geospatial data about the different districts of the city of Barcelona.
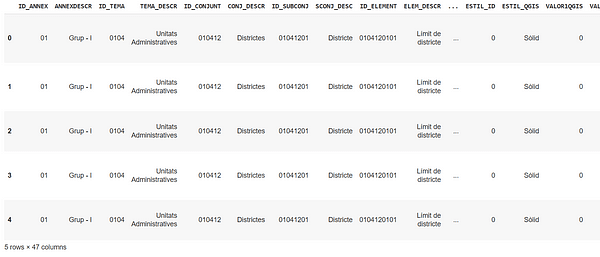
Let first start by loading the data and printing the first five columns of it using the code below:
url = 'https://raw.githubusercontent.com/jcanalesluna/bcn-geodata/master/districtes/districtes.geojson'
districts = gpd.read_file(url)
districts.head()
Next, to write the data into a file we can use the GeoDataFrame.to_file() function to write the data into a Shapefile by default but you can convert it into GeoJSON using the driver parameter.
districts.to_file("districts.geojson", driver="GeoJSON")
3. GeoDataFrames Properties
Since GeoDataFrames is a subclass of pandas DataFrame it inherits a lot of its properties. However, there are some differences the main difference is that it can store geometry columns (also known as GeoSeries) and perform spatial operations. The geometry column in a GeoDataFrame can contain various types of vector data, including points, lines, and polygons. However, only one column is considered the active geometry, and all spatial operations will be based on that column.
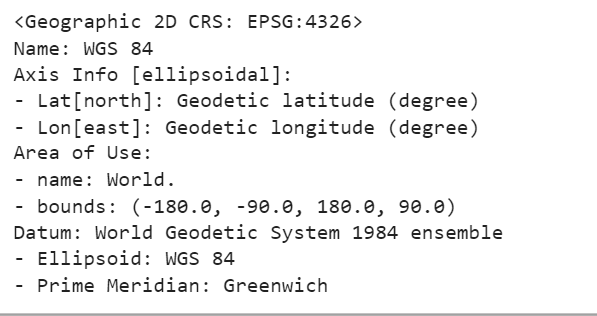
Another critical feature of it is that every column comes with its associated CRS information that tells us where the candidates are located on Earth. The reason why this feature is critical is that if you need to combine two spatial datasets you will need to make sure that they are expressed in the same CRS otherwise you will get the wrong results. The CRS information is stored in the crs attribute in GeoPandas:
districts.crs
Now that we have set the right projected CRS, we’re ready to explore the attributes of GeoDataFrames.
4. Exploring GeoDataFrames
GeoPandas has four useful methods and attributes that can be used to explore the data. We will explore these four methods:
- Area
- Centroid
- Boundary
- Distance
4.1. Area
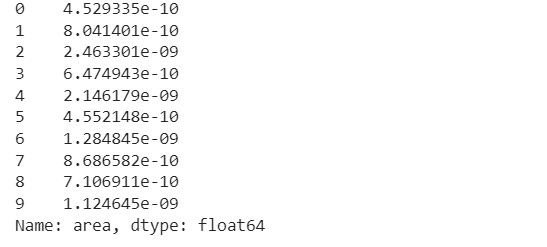
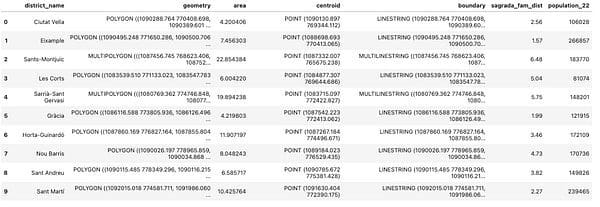
The area attribute returns the calculated area of a geometry. In the example below we will calculate the area of every district in km2.
districts['area'] = districts.area / 1000000
districts['area']
4.2. Centroid
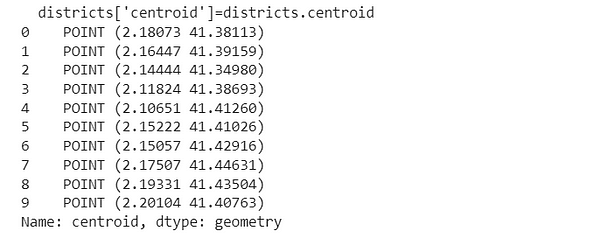
The second attribute is the centroid which returns the center point of the geometry. In the code snippet below we will add a new column and save the centroid for each district:
districts['centroid']=districts.centroid
districts['centroid']
4.3. Boundary
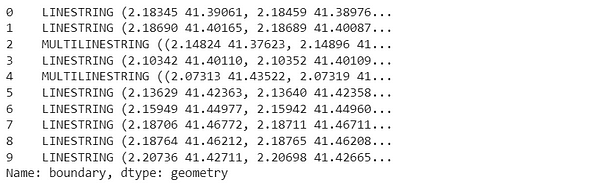
The third method is the boundary attribute which calculates the boundary of a polygon for every district. The code below returns it and saves it into a separate column:
districts['boundary']=districts.boundary
4.4. Distance
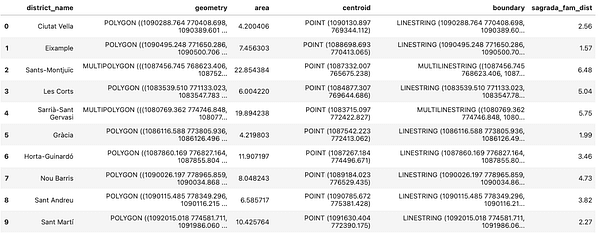
The distance method calculates the minimum distance from a certain geometry to a specific location. So for example in the code below we will calculate the distance from the Sagrada Familia church to the centroids of every district in Barcelona. After that, we will add the distance in km2 and save it in a new column.
from shapely.geometry import Point

sagrada_fam = Point(2.1743680500855005, 41.403656946781304)
sagrada_fam = gpd.GeoSeries(sagrada_fam, crs=4326)
sagrada_fam= sagrada_fam.to_crs(epsg=2062)
districts['sagrada_fam_dist'] = [float(sagrada_fam.distance(centroid)) / 1000 for centroid in districts.centroid]
5. Plotting Data with GeoPandas
Plotting and visualizing your data is a critical step to better understand your data. Plotting with GeoPandas is the same as plotting with Pandas pretty easy and super forward. This is done through the GeoDataFrame.plot() function that is built on the matplotlib python package.
Let's start by exploring Barcelona by plotting a basic plot for its districts:
ax= districts.plot(figsize=(10,6))
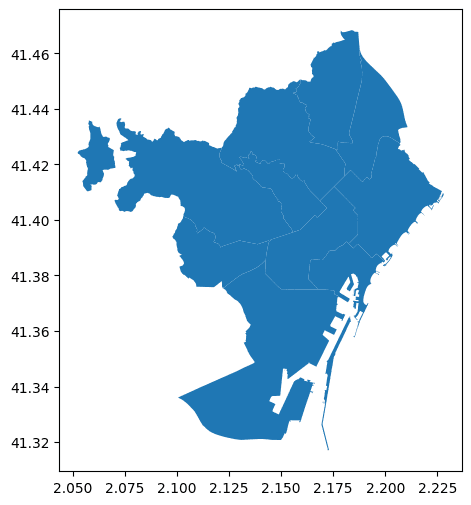
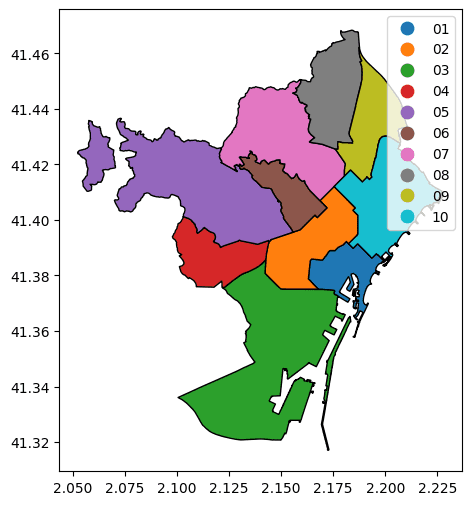
This is a very basic plot that does not tell us a lot of information. However, we can make it more informative by coloring each district with a different color.
ax= districts.plot(column='DISTRICTE', figsize=(10,6), edgecolor='black', legend=True)
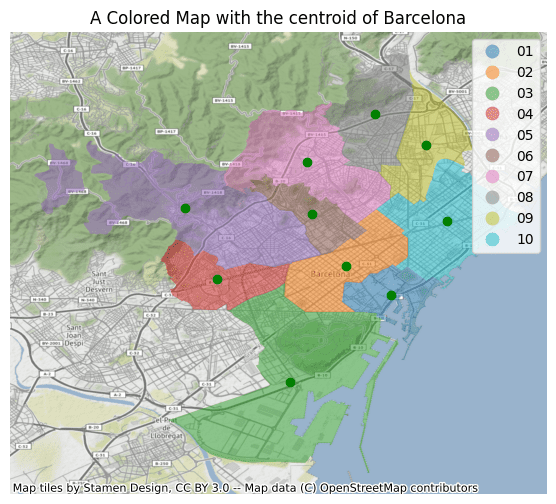
Finally, we can add more information to our plot by adding the centroids of the districts.
import contextily
import matplotlib.pyplot as plt

ax= districts.plot(column='DISTRICTE', figsize=(12,6), alpha=0.5, legend=True)
districts["centroid"].plot(ax=ax, color="green")
contextily.add_basemap(ax, crs=districts.crs.to_string())
plt.title('A Colored Map with the centroid of Barcelona')
plt.axis('off')
plt.show()
Next, we will explore a very important feature of GeoPandas which is the spatial relation and how they can relate to each other.
6. Defining Spatial Relationships
Geospatial data relate to each other in space. GeoPandas uses pandas and shapely packages for spatial relationships. This section covers common operations. There are two main ways to merge GeoPandas DataFrames which are attribute and spatial joins. In this section, we will explore both of them.
6.1.Attribute Joins
Attribute joins allow you to join two GeoPandas DataFrames using non-geometry variables which makes it similar to the regular join operations in Pandas. The joining operation is done using the pandas.merge() method as shown in the example below. In this example, we will join the Barcelona population data to our geospatial data to add more information to it.
import pandas as pd
pop =pd.read_csv('2022_padro_sexe.csv', usecols=['Nom_Districte','Nombre'])
pop = pd.DataFrame(pop.groupby('Nom_Districte')['Nombre'].sum()).reset_index()
pop.columns=['NOM','population_22']
districts = districts.merge(pop)
districts
6.2. Spatial Joins
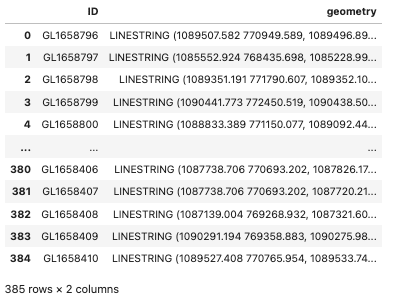
On the other hand spatial joins merge dataframes based on spatial relationships. In the example below we will identify the districts that have bicycle lanes. We will first load the data as shown in the code below:
url = 'https://opendata-ajuntament.barcelona.cat/resources/bcn/CarrilsBici/CARRIL_BICI.geojson'
bike_lane = gpd.read_file(url)
bike_lane = bike_lane.loc[:,['ID','geometry']]
bike_lane.to_crs(epsg=2062, inplace=True)
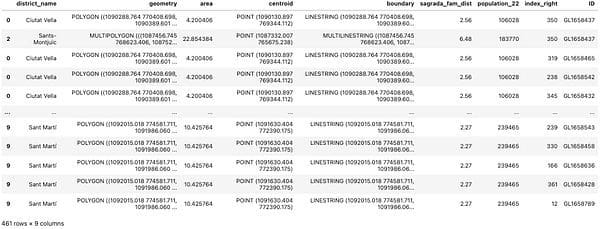
To spatially join two dataframes we can use the sjoin() function. The sjoin() function takes four main arguments: the first one is the GeoDataFrame, the second argument is the GeoDataFrame that we will add to the first GeoDataFrame, the third argument is the type of join and the final argument is the predicate which defines the spatial relation we want to use to match the two GeoDataFrames. The most common partial relationships are intersects, contains, and within. In this example, we will the intersects parameter.
lanes_districts = gpd.sjoin(districts, bike_lane, how='inner', predicate='intersects')
lanes_districts
In this article, I introduced you to Geospatial data analysis using the open-source GeoPandas library. We started with downloading the GeoPandas package, and then we discussed different types of Geospatial data and how to load them. Finally, we will explore basic operations to get your hands on the geospatial dataset. Although there is still to explore with the geospatial data analysis, this blog acts as a starting point in your learning journey.
Youssef Rafaat is a computer vision researcher & data scientist. His research focuses on developing real-time computer vision algorithms for healthcare applications. He also worked as a data scientist for more than 3 years in the marketing, finance, and healthcare domain.