9 Must-Have Datasets for Investigating Recommender Systems
Gain some insight into a variety of useful datasets for recommender systems, including data descriptions, appropriate uses, and some practical comparison.
Lab41 is currently in the midst of Project Hermes, an exploration of different recommender systems in order to build up some intuition (and of course, hard data) about how these algorithms can be used to solve data, code, and expert discovery problems in a number of large organizations. Anna’s post gives a great overview of recommenders which you should check out if you haven’t already.
The ideal way to tackle this problem would be to go to each organization, find the data they have, and use it to build a recommender system. But this isn’t feasible for multiple reasons: it doesn’t scale because there are far more large organizations than there are members of Lab41, and of course most of these organizations would be hesitant to share their data with outsiders. Instead, we need a more general solution that anyone can apply as a guideline.
In order to build this guideline, we need lots of datasets so that our data has a potential stand-in for any dataset a user may have. To that end we have collected several, which are summarized below. Some of them are standards of the recommender system world, while others are a little more non-traditional. These non-traditional datasets are the ones we are most excited about because we think they will most closely mimic the types of data seen in the wild.
Before we get started, let me define a few terms that I will use to describe the datasets:
- Item: A thing that is recommended, whether it be a product, movie, webpage, or piece of information.
- User: A person who rates items and receives recommendations for new items.
- Rating: An expression of preference by a user in regards to items. Ratings can be binary (like/dislike), integer (1 to 5 stars), or continuous (any value on some interval). Additionally, there are implicit ratings which record only whether a user interacted with an item.
Datasets
MovieLens
The MovieLens dataset was put together by the GroupLens research group at my my alma mater, the University of Minnesota (which had nothing to do with us using the dataset). MovieLens is a collection of movie ratings and comes in various sizes. We make use of the 1M, 10M, and 20M datasets which are so named because they contain 1, 10, and 20 million ratings. The largest set uses data from about 140,000 users and covers 27,000 movies. In addition to the ratings, the MovieLens data contains genre information—like “Western”—and user applied tags—like “over the top” and “Arnold Schwarzenegger”. These genre labels and tags are useful in constructing content vectors. A content vector encodes information about an item—such as color, shape, genre, or really any other property—in a form that can be used by a content-based recommender algorithm.
The data that makes up MovieLens has been collected over the past 20 years from students at the university as well as people on the internet. MovieLens has a website where you can sign up, contribute your own ratings, and receive recommendations for one of several recommender algorithms implemented by the GroupLens group.
The datasets are available here.
Jester
What do you get when you take a bunch of academics and have them write a joke rating system? Jester! (Disclaimer: That joke was about as funny as the majority of the jokes you’ll find in the Jester dataset. You’ve been warned!) Jester was developed by Ken Goldberg and his group at UC Berkeley (my other alma mater; I swear we were minimally biased in dataset selection) and contains around 6 million ratings of 150 jokes. Like MovieLens, Jester ratings are provided by users of the system on the internet. You can contribute your own ratings (and perhaps laugh a bit) here.
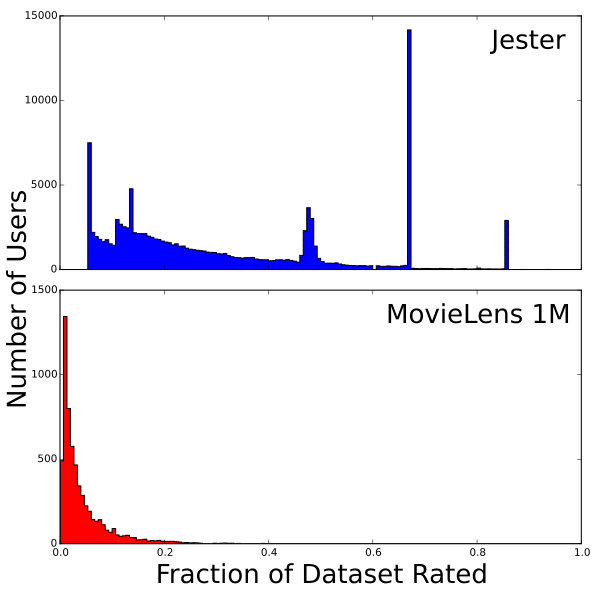
Compared to the other datasets that we use, Jester is unique in two aspects: it uses continuous ratings from -10 to 10 and has the highest ratings density by an order of magnitude. By ratings density I mean roughly “on average, how many items has each user rated?” If every user had rated every item, then the ratings density would be 100%. If no one had rated anything, it would be 0%. Jester has a density of about 30%, meaning that on average a user has rated 30% of all the jokes. MovieLens 1M, as a comparison, has a density of 4.6% (and other datasets have densities well under 1%). Of course it is not so simple. Not every user rates the same number of items. Instead some users rate many items and most users rate a few. This can be seen in the following histogram:
The dataset is available here.
Book-Crossings
Book-Crossings is a book ratings dataset compiled by Cai-Nicolas Ziegler based on data from bookcrossing.com. It contains 1.1 million ratings of 270,000 books by 90,000 users. The ratings are on a scale from 1 to 10, and implicit ratings are also included.
The Book-Crossings dataset is one of the least dense datasets, and the least dense dataset that has explicit ratings.
The dataset is available here.
Last.fm
Last.fm provides a dataset for music recommendations. For each user in the dataset it contains a list of their top most listened to artists including the number of times those artists were played. It also includes user applied tags which could be used to build a content vector.
Last.fm’s data is aggregated, so some of the information (about specific songs, or the time at which someone is listening to music) is lost. However, it is the only dataset in our sample that has information about the social network of the people in it.
The dataset is available here.
Wikipedia
Wikipedia is a collaborative encyclopedia written by its users. In addition to providing information to students desperately writing term papers at the last minute, Wikipedia also provides a data dump of every edit made to every article by every user ever. This dataset has been widely used for social network analysis, testing of graph and database implementations, as well as studies of the behavior of users of Wikipedia. One can also view the edit actions taken by users as an implicit rating indicating that they care about that page for some reason and allowing us to use the dataset to make recommendations.
As Wikipedia was not designed to provide a recommender dataset, it does present some challenges. One of these is extracting a meaningful content vector from a page, but thankfully most of the pages are well categorized, which provides a sort of genre for each. The challenge of building a content vector for Wikipedia, though, is similar to the challenges a recommender for real-world datasets would face. So we view it as a good opportunity to build some expertise in doing so.
The full history dumps are available here.
OpenStreetMap
OpenStreetMap is a collaborative mapping project, sort of like Wikipedia but for maps. Like Wikipedia, OpenStreetMap’s data is provided by their users and a full dump of the entire edit history is available. Objects in the dataset include roads, buildings, points-of-interest, and just about anything else that you might find on a map. These objects are identified by key-value pairs and so a rudimentary content vector can be created from that. However, the key-value pairs are freeform, so picking the right set to use is a challenge in and of itself. Some of the key-value pairs are standardized and used identically by the editing software—such as “highway=residential”—but in general they can be anything the user decided to enter—for example “FixMe!!=Exact location unknown”.
The full OpenStreetMap edit history is available here.
Python Git Repositories
The final dataset we have collected, and perhaps the least traditional, is based on Python code contained in Git repositories. We wrote a few scripts (available in the Hermes GitHub repo) to pull down repositories from the internet, extract the information in them, and load it into Spark. From there we can build a set of implicit ratings from user edits.
We currently extract a content vector from each Python file by looking at all the imported libraries and called functions. In the future we plan to treat the libraries and functions themselves as items to recommend.
Comparison
The various datasets all differ in terms of their key metrics. A summary of these metrics for each dataset is provided in the following table:
| Dataset | Users | Items | Ratings | Density | Rating Scale |
|---|---|---|---|---|---|
| Movielens 1M | 6040 | 3883 | 1,000,209 | 4.26% | [1-5] |
| Movielens 10M | 69,878 | 10,681 | 10,000,054 | 1.33% | [0.5-5] |
| Movielens 20M | 138,493 | 27,278 | 20,000,263 | 0.52% | [0.5-5] |
| Jester | 124,113 | 150 | 5,865,235 | 31.50% | [-10, 10] |
| Book-Crossing | 92,107 | 271,379 | 1,031,175 | 0.0041% | [1, 10], and implicit |
| Last.fm | 1892 | 17632 | 92,834 | 0.28% | Play Counts |
| Wikipedia | 5,583,724 | 4,936,761 | 417,996,366 | 0.0015% | Interactions |
| OpenStreetMap (Azerbaijan) | 231 | 108,330 | 205,774 | 0.82% | Interactions |
| Git (Django) | 790 | 1757 | 13,165 | 0.95% | Interactions |
Bio: Alexander Gude is currently a data scientist at Lab41 working on investigating recommender system algorithms. He holds a BA in physics from University of California, Berkeley, and a PhD in Elementary Particle Physics from University of Minnesota-Twin Cities.
About: Lab41 is a “challenge lab” where the U.S. Intelligence Community comes together with their counterparts in academia, industry, and In-Q-Tel to tackle big data. It allows participants from diverse backgrounds to gain access to ideas, talent, and technology to explore what works and what doesn’t in data analytics. An open, collaborative environment, Lab41 fosters valuable relationships between participants.
Original. Reposted with permission.
Related: