Teaching the Data Science Process
Understanding the process requires not only wide technical background in machine learning but also basic notions of businesses administration; here I will share my experience on teaching the data science process.
By Balázs Kégl, Data scientist, co-creator of RAMP.
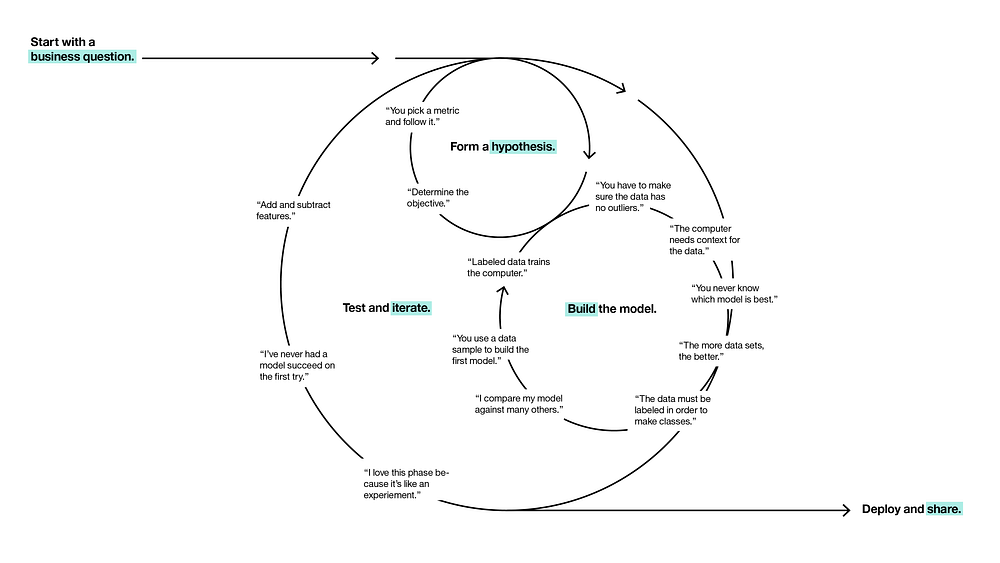
The cyclical process of data science (source).
Curricula for teaching machine learning have existed for decades and even more recent technical subjects (deep learning or big data architectures) have almost standard course outlines and linearized storylines. On the other hand, teaching support for the data science process has been elusive, even though the outlines of the process have been around since the 90s. Understanding the process requires not only wide technical background in machine learning but also basic notions of businesses administration. I have elaborated on the organizational difficulties of data science transformation stemming from these complexities in a previous essay; here I will share my experience on teaching the data science process.
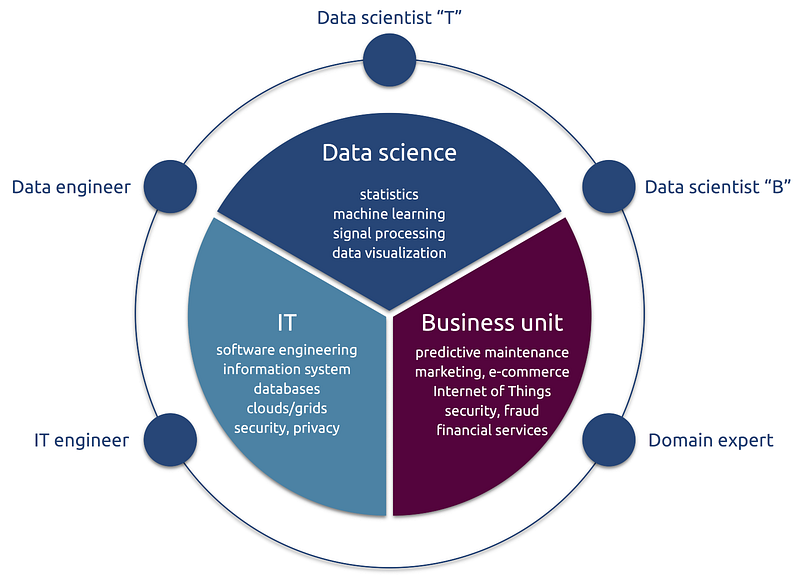
The data science ecosystem. Data scientists “B” is in key position in formalizing the business problem and designing the data science workflow.
Building around the workflow
I recently had the opportunity to try some experimental pedagogical techniques on about hundred top tier engineering students from Ecole Polytechnique. The central concept of the course was the data science workflow.
- Designing the workflow, its elements, the score(s) to optimize, connecting the workflow to the business data scientist side.
- Optimizing the workflow, connecting it to the technical data scientist side.
None of these two can be taught using linearized narratives in slide-based lectures. I built the course around our RAMP concept using our platform. To learn workflow optimization, students participated in five RAMPs, designed to challenge them on different scientific workflows and on different data science problems. To learn workflow design, I covered a couple of data-driven business cases, gave students a linear guide with specific questions to answer to, and asked them to build business cases and data science workflows in group projects. I used the RAMP starting kits as samples: limiting the infinite design space helped students to structure the projects.
Using RAMPs as teaching support
The RAMP was originally designed for a collaborative prototyping tool that makes efficient use of the time of data scientists in solving the data analytics segment of domain science or business problems. We then realized very soon that it is equally valuable for training novice data scientists. The main design feature we needed to change was complete openness. To be able to grade students based on individual performance, we needed to close the leaderboard. In the closed phase students see each other’s scores but not each other’s codes. We grade them using a capped linear function of their score. This typically 1–2 week long closed phase is followed by a “classical” open RAMP in which we grade students based on their activities and their ability of generating diversity and improving their own closed phase score.
The collective performance of the students was nothing short of spectacular. In all five RAMPs they beat not only the baseline but also the single day hackaton scores that we organized to test the workflows, with typically 30–50 top data scientists and domain scientists participating.
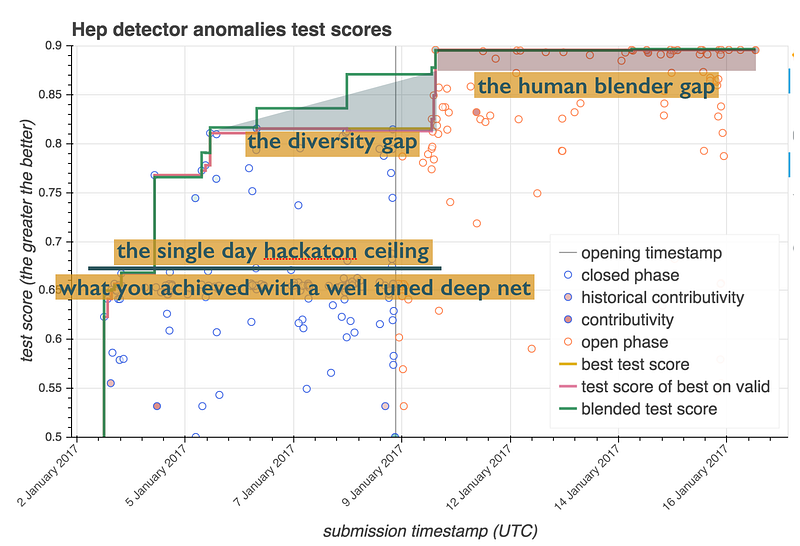
Score vs submission timestamp of the first classroom RAMP. Blue and red circles represent submissions in the closed and open phases, respectively. The pink curve is the current best score and the green curve is the performance of the best model blend. The top 10% of the students outperformed both the data science researchers (single day hackaton) and the best deep neural nets, even in the closed phase. They then outperformed state-of-the-art automatic model blending when combining each other’s solutions in the open phase.
I was also happy to see that in the open phase novice/average students caught up to the top by studying and reusing the solutions coming in the closed phase from the top 10–20% of the students. Another pleasant surprise was that direct blind copying was very rare: students genuinely tried to improve upon each other’s code.
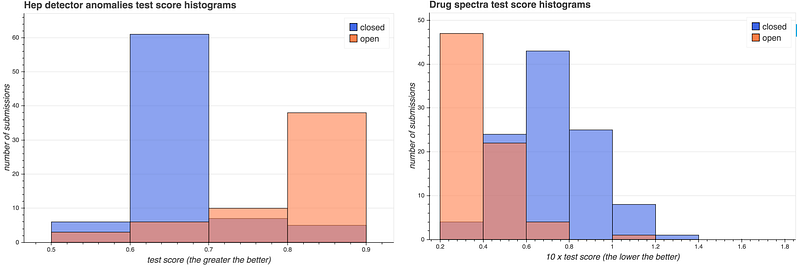
Score distributions in classroom RAMPs. The blue and red histograms represent submissions in the closed and open phases, respectively (the darker histogram is the overlap). The histograms indicate that novice/average students catch up to the top 10% in the open phase by profiting from the open code.
We will be analyzing these rich results and writing papers in domain sciences (see this paper for a first example), data science, and management science. This technical report contains some more details, and here are my slides from the recent DALI workshop on the data science process.
Teaching workflow design using business cases
As I explained in my previous essay, the main roadblock in non-IT companies launching data science projects is not lack of well-prepared data, not the infrastructure, not even the lack of trained data scientists, but the lack of a well-defined data-driven business cases. Worse: this problem is usually discovered after the initial investments into the data lake, the Hadoop server, and the data science team. A well prepared data (process) scientist who can go early into this transition and turn the project on its head may save millions to even a mid-size company.
To train students for this role, I started the course by an extended discussion of a mockup predictive maintenance case. The standardized questions everybody needed to answer in their projects helped students to go from a broadly described business case towards a well defined prediction score, error measure, and data collection strategy.
- What do we want to predict and how do we measure the quality of the prediction?
- How will a better prediction improve the selected KPI?
- You want to have decision support, a fully automated system, or just to know the factors which are important? How will the agent use the system?
- What should be the quantitative prediction?
- How (using what score) do we measure success? How does the (possibly asymmetric) prediction error converts into cost or decreased KPI?
- What data do we need to develop a predictor?
- What effort do we need to collect that data?
- Given the data source(s) and the prediction goal, what would be the workflow and the workflow elements?
- How often the model will have to be retrained?
I further structured their projects by asking them to produce a starting kit, modeled after the five RAMPs that they encountered. Each starting kit contained
- a data set,
- example workflow elements filling the designed workflow,
- a unit test implementing the workflow, which can be used to test the workflow elements, and
- a Jupyter notebook that describes the scientific or business problem (answering the questions above), reads, manipulates, explores, and visualizes the data, explains the data analytics workflow, and provides and explains initial working solutions for each workflow element.
The course contained a lot of Q&A, discussing other business cases (both successful and failed ones), and explaining various possible workflows and workflow elements.
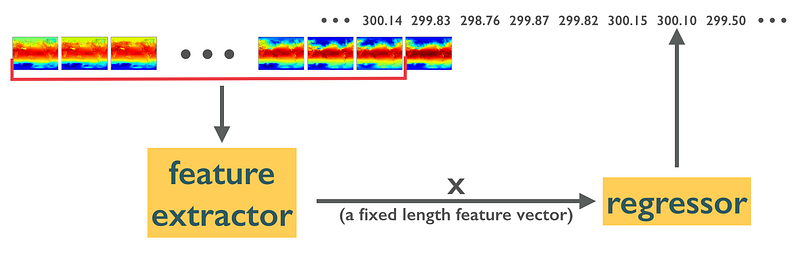
A time series forecasting workflow for predicting El Nino.
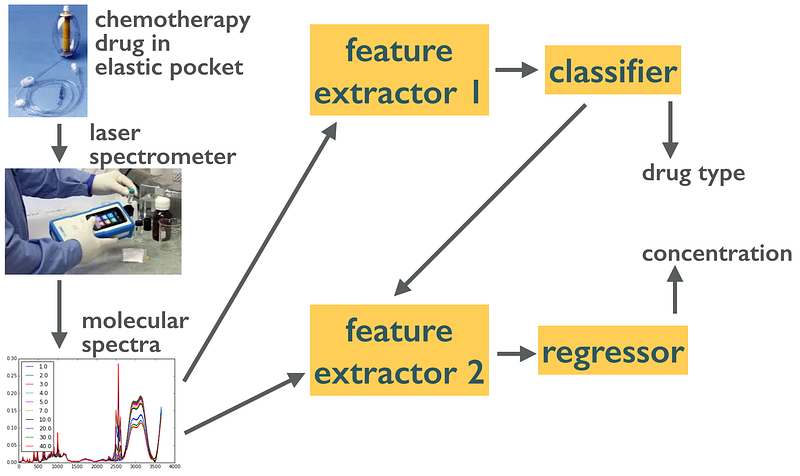
A multi-criteria workflow for classifying and quantifying chemotherapy drugs for noninvasive quality control.
Since students were free to choose any available data set, data collection was mostly a non-issue. Workflows were relatively simple, so almost all teams delivered working starting kits. On the other hand, many times students fell into the trap of trying to find a business case for a “nice” data set. About half of the teams at least attempted to design a meaningful business case. The top 3 teams (out of 22) delivered top notch products:
- A manufacturing process control product working out the asymmetric cost of false positives and false negatives using well-calibrated cost of maintenance, cost of production, satisfaction cost, and margin. The team showed improvement above several baselines (checking none, checking all, checking randomly).
- A product sold to massively multiplayer online games. The goal was to predict whether a player is human or a bot. These games lose money when bots compete with their own offline business that sells characters and features for real money, by collecting those automatically in the game and selling them on the black market. The team worked out the business case by considering the asymmetric classification error.
- A product that could be sold either to taxi companies or Uber, predicting demand for taxi rides per hour and area in Manhattan. The team converted prediction into value by estimating the number of available rides times the profit per ride.
Bio: Balázs Kégl is a senior research scientist at CNRS and head of the Center for Data Science of the Université Paris-Saclay. He is co-creator of RAMP (www.ramp.studio).
Original. Reposted with permission.
Related: