Mining Twitter Data with Python Part 7: Geolocation and Interactive Maps
The final part of this 7 part series explores using geolocation and interactive maps with Twitter data.
By Marco Bonzanini, Independent Data Science Consultant.
Geolocation is the process of identifying the geographic location of an object such as a mobile phone or a computer. Twitter allows its users to provide their location when they publish a tweet, in the form of latitude and longitude coordinates. With this information, we are ready to create some nice visualisation for our data, in the form of interactive maps.
This article briefly introduces the GeoJSON format and Leaflet.js, a nice Javascript library for interactive maps, and discusses its integration with the Twitter data we have collected in the previous parts of this tutorial (see Part 4 for details on the rugby data set).
GeoJSON
GeoJSON is a format for encoding geographic data structures. The format supports a variety of geometric types that can be used to visualise the desired shapes onto a map. For our examples, we just need the simplest structure, a Point. A point is identified by its coordinates (latitude and longitude).
In GeoJSON, we can also represent objects such as a Feature or aFeatureCollection. The first one is basically a geometry with additional properties, while the second one is a list of features.
Our Twitter data set can be represented in GeoJSON as aFeatureCollection, where each tweet would be an individual Featurewith its one geometry (the aforementioned Point).
This is how the JSON structure looks like:
{
    "type": "FeatureCollection",
    "features": [
        {
            "type": "Feature",
            "geometry": {
                "type": "Point",
                "coordinates": [some_latitude, some_longitude]
            },
            "properties": {
                "text": "This is sample a tweet",
                "created_at": "Sat Mar 21 12:30:00 +0000 2015"
            }
        },
        /* more tweets ... */
    ]
}
From Tweets to GeoJSON
Assuming the data are stored in a single file as described in the first chapter of this tutorial, we simply need to iterate all the tweets looking for the coordinates field, which may or may not be present. Keep in mind that you need to use coordinates, because the geo field is deprecated (seethe API).
This code will read the data set, looking for tweets where the coordinates are explicitely given. Once the GeoJSON data structure is created (in the form of a Python dictionary), then the data are dumped into a file called geo_data.json:
# Tweets are stored in "fname"
with open(fname, 'r') as f:
    geo_data = {
        "type": "FeatureCollection",
        "features": []
    }
    for line in f:
        tweet = json.loads(line)
        if tweet['coordinates']:
            geo_json_feature = {
                "type": "Feature",
                "geometry": tweet['coordinates'],
                "properties": {
                    "text": tweet['text'],
                    "created_at": tweet['created_at']
                }
            }
            geo_data['features'].append(geo_json_feature)

# Save geo data
with open('geo_data.json', 'w') as fout:
    fout.write(json.dumps(geo_data, indent=4))
Interactive Maps with Leaflet.js
Leaflet.js is an open-source Javascript library for interactive maps. You can create maps with tiles of your choice (e.g. from OpenStreetMap or MapBox), and overlap interactive components.
In order to prepare a web page that will host a map, you simply need to include the library and its CSS, by putting in the head section of your document the following lines:
<link rel="stylesheet" href="http://cdnjs.cloudflare.com/ajax/libs/leaflet/0.7.3/leaflet.css" />
<script src="http://cdnjs.cloudflare.com/ajax/libs/leaflet/0.7.3/leaflet.js"></script>
Moreover, we have all our GeoJSON data in a separate file, so we want to load the data dynamically rather than manually put all the points in the map. For this purpose, we can easily play with jQuery, which we also need to include:
<script src="http://code.jquery.com/jquery-2.1.0.min.js"></script>
The map itself will be placed into a div element:
<script src="http://code.jquery.com/jquery-2.1.0.min.js"></script><!-- this goes in the <head> -->
<style>
#map {
    height: 600px;
}
</style>
<!-- this goes in the <body> -->
<div id="map"></div>
We’re now ready to create the map with Leaflet:
// Load the tile images from OpenStreetMap var mytiles = L.tileLayer('http://{s}.tile.osm.org/{z}/{x}/{y}.png', { attribution: '© <a href="http://osm.org/copyright">OpenStreetMap</a> contributors' }); // Initialise an empty map var map = L.map('map'); // Read the GeoJSON data with jQuery, and create a circleMarker element for each tweet // Each tweet will be represented by a nice red dot $.getJSON("./geo_data.json", function(data) { var myStyle = { radius: 2, fillColor: "red", color: "red", weight: 1, opacity: 1, fillOpacity: 1 }; var geojson = L.geoJson(data, { pointToLayer: function (feature, latlng) { return L.circleMarker(latlng, myStyle); } }); geojson.addTo(map) }); // Add the tiles to the map, and initialise the view in the middle of Europe map.addLayer(mytiles).setView([50.5, 5.0], 5);
A screenshot of the results:
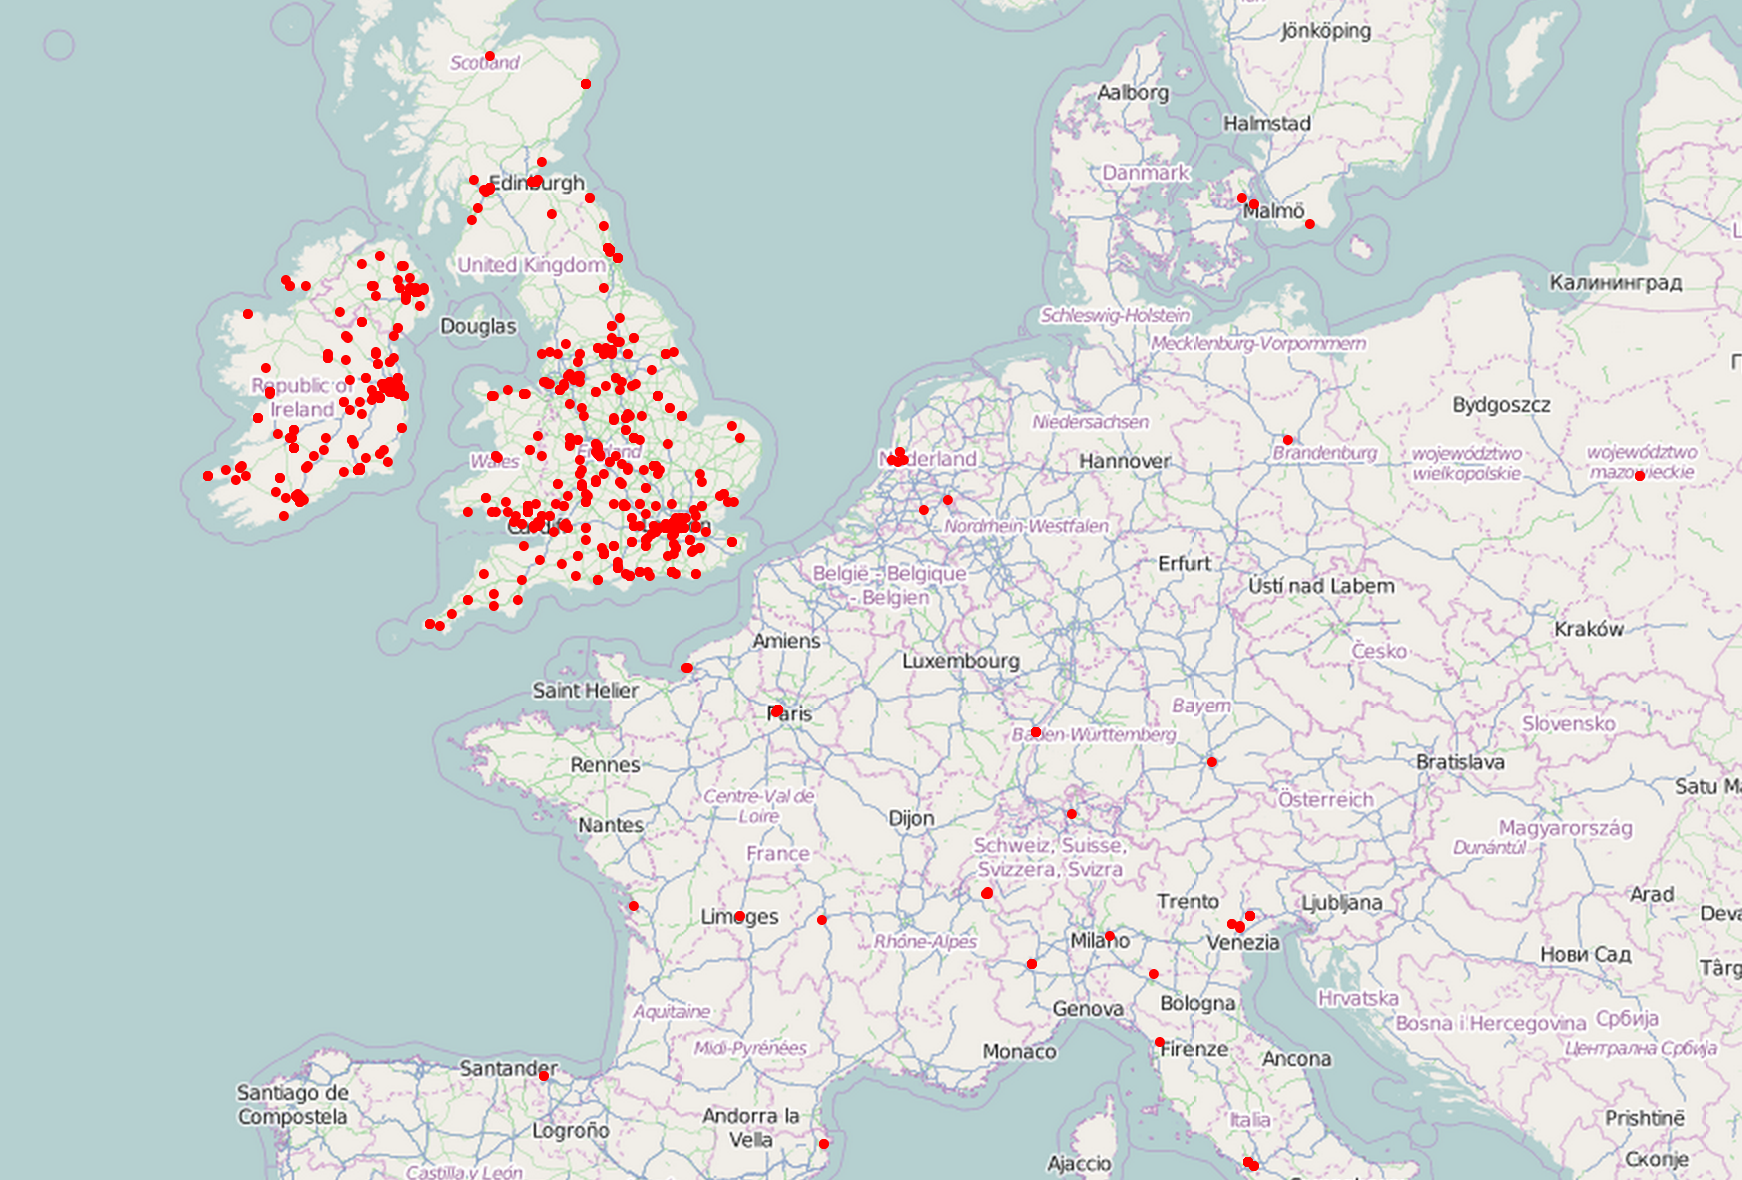
The above example uses OpenStreetMap for the tile images, but Leaflet lets you choose other services. For example, in the following screenshot the tiles are coming from MapBox.
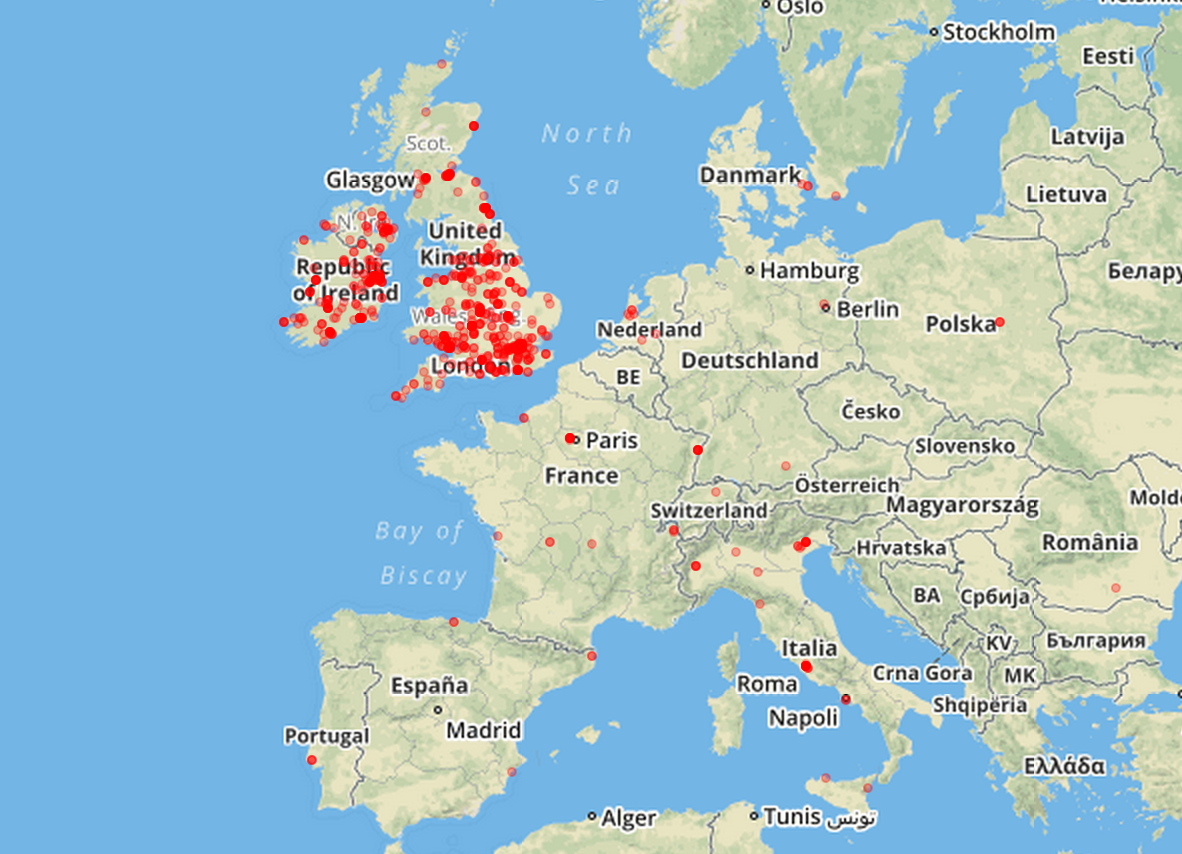
You can see the interactive maps in action here:
Summary
In general there are many options for data visualisation in Python, but in terms of browser-based interaction, Javascript is also an interesting option, and the two languages can play well together. This article has shown that building a simple interactive map is a fairly straightforward process.
With a few lines of Python, we’ve been able to transform our data into a common format (GeoJSON) that can be passed onto Javascript for visualisation. Leaflet.js is a nice Javascript library that, almost out of the box, lets us create some nice interactive maps.
Bio: Marco Bonzanini is a Data Scientist based in London, UK. Active in the PyData community, he enjoys working in text analytics and data mining applications. He's the author of "Mastering Social Media Mining with Python" (Packt Publishing, July 2016).
Original. Reposted with permission.
Related: