What makes a data visualization successful?
Data visualisation gives very important insights about the data. But it is subjective to the goal of analysis & area of application. Let’s see how.
By Evelyn Münster, Data Visualization Designer.
Data visualizations can have very different goals and functions depending on the area of application. Success must therefore be measured against different quality criteria, depending on the task.
When used in data analysis, success means, that a data scientist can identify the structures and patterns that she needs for the next step.
In reporting, success means that an employee can read and understand the information relevant to him or her easily.
Communication is about telling a story or deepening the details of a story.
With data products, it is sometimes important to explain complexity, but sometimes also to hide or simplify it.
Even if the goals are different, you can still see a recurring mode of operation:
- There is a system that leaves traces in the form of data. The system is not visible, a black box. For example, the stream of visitors to a website.
- Now the data structure is encoded into a visual form.
- When reading, the reader has to decode it again. In doing so, he recognizes data and its structure in order to form a mental model of the underlying system.
- With the help of his mental model, the reader can now understand the system.
He can adapt his actions and decisions accordingly.
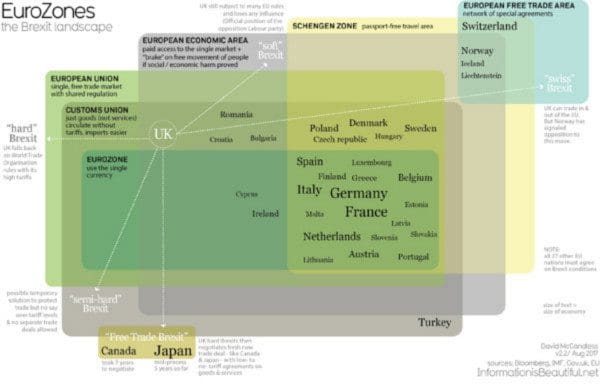
Fig. 1: Brexit landscape. Source: David McCandless, InformationIsBeautiful.net
A nice example of a mental model is the Brexit landscape (Fig. 1). At least in my case, it has made my rather simple mental model of the EU considerably more precise.
What could possibly go wrong?
In each of the steps, of course, some things can go awry, so that in the end the black box for the reader remains completely or partially present. Avoiding such mistakes is not trivial.
Data visualization best practices can help here. But it also has a lot to do with creativity, intuition and experience to elicit the right form from the data. It is a design task, and not a problem that can be solved with technology.
I often see data products where a lot of effort has been put into data science and big data technology, but the data visualization design has been completely forgotten. And here I mean Data Visualization Design, not UI Design. I always find this a pity, because the makers are not even aware of how much potential they are giving away here.
But how do you find out whether a visualization is successful? A good graphic is often difficult to distinguish from a bad one. Clues such as completeness of the desired features or aesthetics are often used as criteria, but in my experience they are not suitable for judging a visualization.
Someone with experience in data visualization can see many problem areas at first glance, but it is often impossible to find out whether the task is performed optimally without deep background knowledge and user tests.
Quantifiable success
In some cases, however, it is possible to test or measure the desired result, i. e. the action that follows the examination of the visualization.
Depending on the type of application, this could be:
- Performance: An action can be executed faster
- Error rate: Fewer errors in decisions or more precise control
- Virality: An article is often shared, much discussed
- Interactivity: Longer engagement with a story, more interaction
- Opinion-forming: The opinion of a group has been changed (politics, science)
- Conversions: The recipient has been convinced of a product and buys it
Of course, this is not possible for every application. Applications with very well-defined goals are generally suitable for measuring success.
But where are the success stories?
In fact, data visualization lacks quantified success stories. Well-known experts such as Enrico Bertini, Stephen Few or Andy Kirk have long criticised this. The reasons for this can only be speculated. Sometimes the success may be too obvious to measure, sometimes too difficult to measure. It is also often not possible to talk publicly about data products because both the data and the UI are proprietary.
However, there are a number of outstanding data visualizations whose success has never been measured, but is palpable.

Ancel Keys’ Seven Countries Study
Even simple visualizations can be very successful. With this scatterplot from 1953, the scientist Ancel Keyes laid the foundation for our distrust of fat. After another ten years of his persistent promotion, the entire nutritional science was convinced that fat, especially saturated fat, was unhealthy.
The study is a fake: Keys had collected data in 22 countries, but then only published the six (later seven) countries where there was a relationship between rate of death from heart disease and total fat intake (as a percentage of calories).
Source: https://thescienceofnutrition.wordpress.com/tag/seven-countries-study/
Hans Rosling
Let my dataset change your mindset, TED Talk
Hans Rosling’s lectures are legendary data performances that make our obsolete stereotypes about developing countries crumble. Rosling gave me a much more precise and optimistic view of the world.
US Gun Deaths in 2013

This terrifying and at the same time magical visualization by Periscopic shows the lost years of life of all people shot dead in the USA. Periscopic has created a viral content, which has been widely discussed across all media.
What is really warming the world?

Similarly, this masterful “scrollytelling” story at Bloomberg by Eric Roston and Blacki Migliozzi, has strongly influenced public opinion on the causes of climate change and is repeatedly referenced and discussed.
I would certainly be pleased if the power of well-done visualizations would be recognized and used by more people. I find it particularly exciting to work in areas that are currently difficult to approach, such as physics, law or business administration.
Bio: As a Data Visualization Designer, Evelyn Münster, is a multidisciplinary thinker on the crossroads of data analysis, data visualization and UX design. She has been developing interactive data visualization tools for science and business since 2008. Her passion is solving tough visualization challenges for data products and business intelligence. Signup for her data visualization newsletter here.
Related:
- The Value of Exploratory Data Analysis
- It’s Getting Hot In Here: Data Science vs Fake News
- Are physicians worried about computers machine learning their jobs?