Python Data Preparation Case Files: Group-based Imputation
The second part in this series addresses group-based imputation for dealing with missing data values. Check out why finding group means can be a more formidable action than overall means, and see how to accomplish it in Python.

This is the second post in this series on Python data preparation, and focuses on group-based imputation.
The Refresher
While the first post demonstrated a simple manner for imputing missing values, based on the same variable's mean, this isn't really the most complex approach to filling in missing values. Suppose, as in our dataset example (see the first post), we have customers in 4 states, and we are interested in using residence in these states as a means to treating customers as distinct groups, and filling in missing values accordingly. This is a more nuanced approach.
A bit more specifically, let's use the mean account balance of customers in a given state to determine the value to use for other customer missing balance values in the same state.
I won't go into any more detail about the mock data or task; feel free to look at the first post for the requisite background. Also, grab the dataset here (as it sits after the first post's exercises).
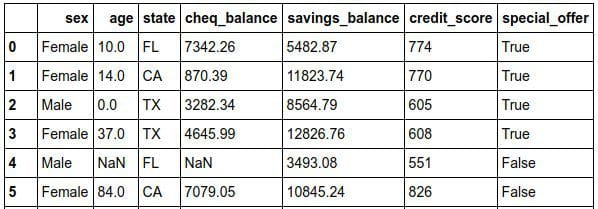
Figure 1: Mock bank dataset for our exercise (after exercise 1).
The Process
The process is pretty cut and dry this time out, as we only have a single task.
Imputing Missing Account Balances
We will assume that our domain experts have concluded that missing account balances are best replaced with the mean account balances of customers in the same state (lending to why we had to drop instances with missing state values). This will be done for both checking and savings accounts.
First, let's have a look at the current state of missing values in our dataset.
import pandas as pd
import numpy as np

# Importing the dataset
dataset_filename = 'mock_bank_data_original.csv'
df = pd.read_csv(dataset_filename)

# Summarize missing values
print 'Null values by variable:'
print '------------------------'
df.isnull().sum()
Null values by variable:
------------------------
sex                108
age                107
state                0
cheq_balance        23
savings_balance     91
credit_score         0
special_offer        0
dtype: int64
Our checking account balance (pardon the 'q'; I'm Canadian) and savings account balances have 23 and 91 missing values, respectively.
The Code
First, let's compare the by-state balance means with the overall mean (prior to imputation), for interest's sake.
print 'Overall cheq_balance mean:', df['cheq_balance'].mean().round(2)
print 'Overall savings_balance mean:', df['savings_balance'].mean().round(2)

Overall cheq_balance mean: 4938.91
Overall savings_balance mean: 9603.64
print 'cheq_balance mean by state:'
print '---------------------------'
print df.groupby(['state']).mean().groupby('state')['cheq_balance'].mean().round(2)

cheq_balance mean by state:
---------------------------
state
CA    4637.23
FL    4993.99
NY    4932.80
TX    5175.78
Name: cheq_balance, dtype: float64
print 'savings_balance mean by state:'
print '------------------------------'
print df.groupby(['state']).mean().groupby('state')['savings_balance'].mean().round(2)

savings_balance mean by state:
------------------------------
state
CA     9174.56
FL     9590.59
NY    10443.61
TX     9611.70
Name: savings_balance, dtype: float64
Though perhaps not as dramatic as hoped, it should be clear to see why such group-based imputation is a valid approach to a problem such as this. The mean savings account balance difference between California ($9174.56) and New York ($10443.61), for example, is nearly $1270. Taking an overall mean of $9603.64 to fill in missing values would not provide the most accurate picture. This goes to goodness of fit.
Let's go ahead and fill in these missing values by using the Pandas 'groupby' and 'transform' functionality, along with a lambda function. We then round the result in the line of code beneath.
# Replace cheq_balance NaN with mean cheq_balance of same state
df['cheq_balance'] = df.groupby('state').cheq_balance.transform(lambda x: x.fillna(x.mean()))
df.cheq_balance = df.cheq_balance.round(2)

# Replace savings_balance NaN with mean savings_balance of same state
df['savings_balance'] = df.groupby('state').savings_balance.transform(lambda x: x.fillna(x.mean()))
df.savings_balance = df.savings_balance.round(2)
That's it. Our pertinent missing values are now filled in with the mean values of those in the same state.
Checking the results:
Null values by variable:
------------------------
sex                108
age                107
state                0
cheq_balance         0
savings_balance      0
credit_score         0
special_offer        0
dtype: int64
Bingo!
Now let's save the dataset for next time.
# Output modified dataset to CSV
df.to_csv('mock_bank_data_original_PART2.csv', index=False)
That's it for this exercise. We still have to deal with 'sex' and 'age' variable missing values. Next time we will look at regression-based imputation to help deal with one of these.
Related: