 7 Steps to Mastering Data Preparation with Python
 7 Steps to Mastering Data Preparation with Python
Follow these 7 steps for mastering data preparation, covering the concepts, the individual tasks, as well as different approaches to tackling the entire process from within the Python ecosystem.
Data preparation, cleaning, pre-processing, cleansing, wrangling. Whatever term you choose, they refer to a roughly related set of pre-modeling data activities in the machine learning, data mining, and data science communities.
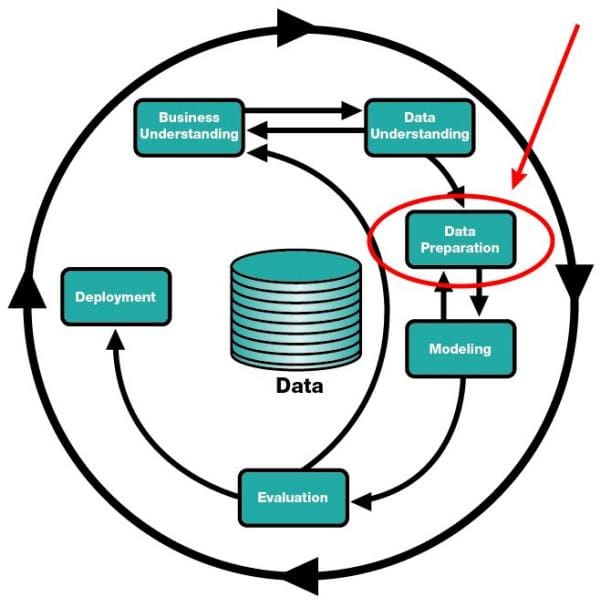
Data preparation in the CRISP-DM model.
For example, the all-knowing Wikipedia defines data cleansing as:
...is the process of detecting and correcting (or removing) corrupt or inaccurate records from a record set, table, or database and refers to identifying incomplete, incorrect, inaccurate or irrelevant parts of the data and then replacing, modifying, or deleting the dirty or coarse data. Data cleansing may be performed interactively with data wrangling tools, or as batch processing through scripting.
Data wrangling, for comparison, is defined by Wikipedia as:
...the process of manually converting or mapping data from one "raw" form into another format that allows for more convenient consumption of the data with the help of semi-automated tools. This may include further munging, data visualization, data aggregation, training a statistical model, as well as many other potential uses. Data munging as a process typically follows a set of general steps which begin with extracting the data in a raw form from the data source, "munging" the raw data using algorithms (e.g. sorting) or parsing the data into predefined data structures, and finally depositing the resulting content into a data sink for storage and future use.
While I would first point out that I am not thrilled with the term "data sink," I would go on to say that it is "identifying incomplete, incorrect, inaccurate or irrelevant parts of the data and then replacing, modifying, or deleting the dirty or coarse data" in the context of "mapping data from one 'raw' form into another..." all the way up to "training a statistical model" which I like to think of data preparation as encompassing, or "everything from data sourcing right up to, but not including, model building." That is the vague-yet-oddly-precise definition we'll move forward with.
Keep in mind, however, that this article covers one particular set of data preparation techniques, and additional, or completely different, techniques may be used in a given circumstance, based on requirements. You should find that the prescription held herein is one which is both orthodox and general in approach.
Step 1: Preparing for the Preparation
First, let's stress what everyone else has already told you: it could be argued that this data preparation phase is not a preliminary step prior to a machine learning task, but actually an integral component (or even a majority) of what a typical machine learning task would encompass. For our purposes, however, we will separate the data preparation from the modeling as its own regimen.
As Python is the ecosystem, much of what we will cover will be Pandas related. For the uninitiated, Pandas is a data manipulation and analysis library, is one of the cornerstones of the Python scientific programming stack, and is a great fit for many of the tasks associated with data preparation.
Data preparation can be seen in the CRISP-DM model shown above (though it can be reasonably argued that "data understanding" falls within our definition as well). We can also equate our data preparation with the framework of the KDD Process -- specifically the first 3 major steps -- which are selection, preprocessing, and transformation. We can break these down into finer granularity, but at a macro level, these steps of the KDD Process encompass what data wrangling is.
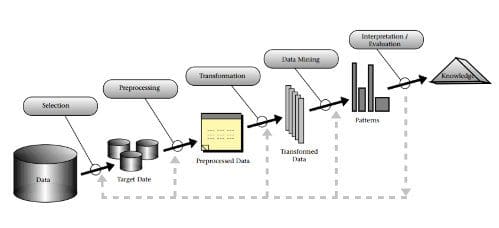
The KDD Process.
While readers should be able to follow this guide with few additional resources, for those interested in a more holistic take on Pandas, helpful information can be found in the following:
- 10 Minutes to pandas, Pandas documentation
- Intro to pandas data structures, by Greg Reda
- Modern Pandas (in 7 parts), by Tom Augspurger
For some feedback on the data preparation process from 3 insiders -- Sebastian Raschka, Clare Bernard, and Joe Boutros -- read this interview before moving on:
Step 2: Exploratory Data Analysis
Exploratory data analysis (EDA) is an integral aspect of any greater data analysis, data science, or machine learning project. Understanding data before working with it isn't just a pretty good idea, it is a priority if you plan on accomplishing anything of consequence. In her article The Value of Exploratory Data Analysis, Chloe Mawer explains:
At a high level, EDA is the practice of using visual and quantitative methods to understand and summarize a dataset without making any assumptions about its contents. It is a crucial step to take before diving into machine learning or statistical modeling because it provides the context needed to develop an appropriate model for the problem at hand and to correctly interpret its results.
The basic gist is that we need to know the makeup of our data before we can effectively select predictive algorithms or map out the remaining steps of our data preparation. Throwing our dataset at the hottest algorithm and hoping for the best is not a strategy.
Knowing our requirements are also important: if having a human-readable output is a high priority in order reason our results, using a neural network is likely not going to cut it. A decision tree may be not provide the highest classification accuracy in a given scenario, but perhaps any such sacrifice in accuracy would be acceptable in exchange for a decipherable process (and cue the hate mail).
Chloe states that EDA usually involves a combination of the following methods:
- Univariate visualization of and summary statistics for each field in the raw dataset
- Bivariate visualization and summary statistics for assessing the relationship between each variable in the dataset and the target variable of interest (e.g. time until churn, spend)
- Multivariate visualizations to understand interactions between different fields in the data
- Dimensionality reduction to understand the fields in the data that account for the most variance between observations and allow for the processing of a reduced volume of data
- Clustering of similar observations in the dataset into differentiated groupings, which by collapsing the data into a few small data points, patterns of behavior can be more easily identified
It should be noted that her article stresses the importance of visualization in the EDA process, as opposed to simple summarization alone. Also, we won't spend much time on the more advanced aspects of EDA (dimensionality reduction & clustering of observations) in this step, as I hope to write something more in-depth on these topics in the near future.
For a more complete overview of why EDA is important (and often not given its fair credit), read Chloe's article.
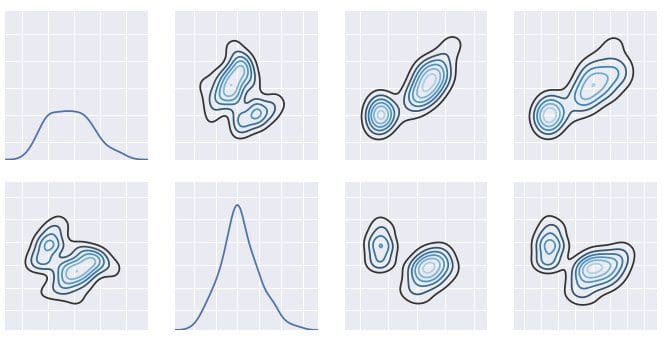
An excerpt of a distribution visualization of the iris dataset.
For an example exploratory data analysis process as applied to the Titanic dataset, read:
- Titanic EDA, by Tarek Dib
To get an idea of using Seaborn, a statistical data visualization library, to visualize a dataset distribution see:
- Visualizing the distribution of a dataset, Seaborn documentation
A pair of additional libraries which may be useful for data exploration:
- Dora - Tools for exploratory data analysis in Python, by Nathan Epstein
- pandas-profiling - Create HTML profiling reports from pandas DataFrame objects, by Jos Polfliet
For a quick word on categorical data, see the following:
- Qualitative Research Methods for Data Science?, by Kevin Gray
- Generating a wordcloud in Python, by Andreas Mueller
Step 3: Dealing with Missing Values
There are all sorts of strategies for dealing with missing data, and none of them are applicable universally. Some people will say "never use instances which include empty values." Others will argue "never use an attribute's mean value to replace missing values." Conversely, you may hear more complex methods endorsed wholesale, such as "only first clustering a dataset into the number of known classes and then using intra-cluster regression to calculate missing values is valid."
Listen to none of this. "Never" and "only" and other inflexible assertions hold no value in the nuanced world of data finessing; different types of data and processes suggest different best practices for dealing with missing values. However, since this type of knowledge is both experience and domain based, we will focus on the more basic strategies which can be employed.

Another one of those pesky missing values.
Some common methods for dealing with missing values include:
- dropping instances
- dropping attributes
- imputing the attribute mean for all missing values
- imputing the attribute median for all missing values
- imputing the attribute mode for all missing values
- using regression to impute attribute missing values
As mentioned above, clearly the type of modeling methods being employed will have an effect on your decision -- for example, decision trees are not amenable to missing values. Additionally, you could technically entertain any statistical method you could think of for determining missing values from the dataset, but the listed approaches are tried, tested, and commonly used approaches.
As our discussion here is Python and Pandas based, here is relevant information:
- Working with missing data, Pandas documentation
- pandas.DataFrame.fillna, Pandas documentation
There are a lot of ways to accomplish filling missing values in a Pandas DataFrame with what it is you want them replaced with. Here are a few basic examples:
For some additional views on dealing with missing values, particularly imputation, see:
- How to Treat Missing Values in Your Data: Part I, by Jacob Joseph
- How to Treat Missing Values in Your Data: Part II, by Jacob Joseph