Interpreting a data set, beginning to end
Detailed knowledge of your data is key to understanding it! We review several important methods that to understand the data, including summary statistics with visualization, embedding methods like PCA and t-SNE, and Topological Data Analysis.
Machine learning may rescue you from some disasters, but there are times when it won’t help. At some point,the model’s accuracy has to be improved. That’s when it hits that understanding and exploring a data set is critically important.
To build a powerful machine learning system, it’s vital to be familiar with the dataset, know feature distributions, identify important and unimportant features, discover trends and relationships among the features and so on. Don’t jump into modelling before digging into the data.Remember that the quality of the output depends on the quality of input.Garbage in, garbage out.
Data scientists spend much of their time on data preparation before they jump into modelling, because understanding, generating and selecting useful features impacts model performance. It helps the data scientists to check assumptions required for fitting models.In addition to understanding the input data set, it’s also important to understand the data generated throughout the model building process—e.g. different exploration and visualization techniques can be used on the activation data of Deep Q-Networks (DQNs).
Depending on size and type of data, understanding and interpreting data sets can be challenging. It’s impossible to understand the data set and make conclusions just looking at the first or randomly selected 100 observations from millions of them. Don’t expect to plot statistics for each feature if the data has thousands of variables. It’s better to have a handful of features or a way to summarize them. And remember that each variable can’t be treated in a similar way if the data has heterogeneous variables.
What can be done? Use different exploratory data analysis and visualization techniques to get a better understanding. This includes summarizing main data set characteristics, finding representative or critical points and discovering relevant features. After gaining an overall understanding of the data set, you can think about which observations and features to use in modeling.
Summary statistics with visualization
Summary statistics help to analyze information about the sample data. It indicates something about the continuous (interval) and discrete (nominal) data set variables. Analyze those variables individually or together because they can help find: unexpected values; proportion of missing values compared to the whole data set; skewness and other issues. The distribution of feature values across different features can be compared, as can feature statistics for training and test data sets. This helps uncover differences between them.
Be careful about summary statistics. Excessive trust of summary statistics can hide problems in the data set. Consider using additional techniques for a full understanding.
Example-based explanations
Assume the data set has millions of observations with thousands of variables. It’s challenging to understand this data without any abstraction. One approach to solve this problem is to use example-based explanations; techniques that can help pick important observations and dimensions. They can help interpret highly complex big data sets with different distributions.
The techniques available to solve this problem include finding observations and dimensions to characterize, to criticize and to distinguish the data set groups.
- Characterize: As humans, we usually use representative examples from the data for categorization and decision making. Those examples, usually called prototypes, are observations that best describe dataset categories. They can be used to interpret categories since it is hard to make interpretations using all the observations in a certain category.
- Criticize: Finding prototypes alone is not sufficient to understand the data since it overgeneralizes. There may be variations among shared features in a certain group that can’t be captured by prototypes. We need to show exceptions (criticisms) to the rules. Those observations can be considered as minority observations very different from the prototype, but still belonging in the same category.
In the illustrations below, robot pictures in each category consist of robots with different head and body shapes. Robots in costumes can also belong to one of those categories, although they can be very different from a typical robot picture. Those pictures are needed to understanding the data since they are important minorities.
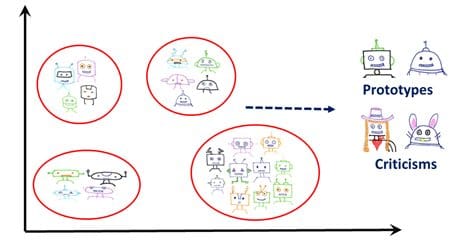
Been Kim's work in this area focuses on finding those minorities while finding prototypes using an unsupervised technique called maximum mean discrepancy (MMD) critic.
- Distinguish: Finding representatives may not always be enough. If the number of features is high, it will still be hard to understand the selected observations. This is because humans cannot comprehend long and complicated explanations. The explanations need to be simple.
The most important features for those selected observations must be considered. Subspace representation is a solution to that problem. Using the prototype and subspace representation helps in interpretability. One method that can be used to achieve this is Bayesian Case Model (BCM),an unsupervised learning method where the underlying data is modelled using a mixture model and a set of features that are important for each cluster.
In addition to understanding important features, it’s also necessary to understand differences between clusters for many applications such as differential diagnosis. For that, find distinguishing dimensions in the data. A mind the gap model (MGM) combines extractive and selective approaches and reports a global set of distinguishable dimensions to assist with further exploration.
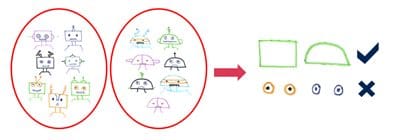
In the above example, by looking at the features extracted from different robot pictures we can say that shape of the head is a distinguishing dimension. However, we can’t say that for eyes since they look very similar.
Embedding techniques
An embedding is a mapping from discrete values, such as words or observations, to vectors. Different embedding techniques help visualize lower-dimensional representation. Embeddings can be in hundreds of dimensions. The common way to understand them is to project them into two or three dimensions. They are useful for many things:
- Use them to explore local neighborhoods. It may help to explore the closest points to a given point to make sure that they are related to each other. Select those points and do further analysis. Use them to understand the behavior of a model.
- Use them to analyze the global structure, seeking groups of points. This helps find clusters and outliers.
There are many methods for obtaining embedding, including:
- Principal component analysis: It’s a linear deterministic algorithm to capture the data variation in as few dimensions as possible.This is an effective algorithm to reduce dimensionality of data, especially if strong linear relationships exist among variables.

It can be used to highlight the variations and eliminate dimensions. It’s possible to retain the first few principal components that consider a significant amount of variation if needed to interpret the data. Remaining principal components account for trivial amounts of variance. They should not be retained for interpretability and analysis.
- T-distributed stochastic neighbor embedding (t-SNE): a dimension reduction algorithm that tries to preserve local neighborhoods in the data. It is nonlinear and nondeterministic; and allows creation of 2 or 3D projections. T-SNE finds structures that other methods may miss.

It’s very useful to visualize and interpret datasets, but there are many things that require caution. While preserving local structure, it may distort global structure. If more information is needed about t-SNE, check out a great article at distill.pub, “How to Use t-SNE Effectively.”
Using t-SNE embeddings can help reduce the dimension of the data and find structures. However, if it’s a very large data set, understanding the projections can still be hard. It’s useful to check the geometry of the data to get a better understanding.
Topological data analysis (TDA)
Topology studies geometric features preserved when we deform the object without tearing it. Topological data analysis provides tools to study the geometric features of data using topology. This includes detecting and visualizing features, and the statistical measures related to those. Geometric features can be distinct clusters, loops and tendrils in the data. If there is a loop in this network, the conclusion is that a pattern occurs periodically.
Mapper algorithms in TDA are useful for data visualization and clustering. Topological networks of a data set can be created in which nodes are the group of similar observations and the edges connect the nodes if they have a common observation.
Conclusion
When it comes to understanding and interpreting data, there is no one solution that fits all.Pick the one that best meets your need. When there’s big raw data, use representative examples to explain the underlying distribution. If it’s a wide data set, find the important dimensions to understand the representative samples because listing all features of representative samples will be difficult to understand.
Ultimately, it’s the data scientist’s job to use available tools to solve the mystery and explain in comprehensible ways.
Bio: Ilknur Kaynar Kabul is a scientist and manager at SAS, working at the intersection of computer science, statistics and optimization. Her work involves building scalable machine learning algorithms that help solve big data problems. Kabul is co-founder of the North Carolina chapter of Women in Machine Learning and Data Science. She holds a doctorate of computer science from the University of North Carolina.
Related:
- 5 reasons data analytics are falling short
- Gainers and Losers in Gartner 2018 Magic Quadrant for Data Science and Machine Learning Platforms
- 5 of Our Favorite Free Visualization Tools