Feature Engineering for Machine Learning: 10 Examples
A brief introduction to feature engineering, covering coordinate transformation, continuous data, categorical features, missing values, normalization, and more.
Feature engineering in machine learning is a method of making data easier to analyze. Data in the real world can be extremely messy and chaotic. It doesn’t matter if it is a relational SQL database, Excel file or any other source of data. Despite being usually constructed as tables where each row (called sample) has its own values corresponding to a given column (called feature), the data may be hard to understand and process. To make the reading of the data easier for our machine learning models and thanks to that increase its performance, we can conduct feature engineering.
What is Feature Engineering?
Feature engineering in machine learning is a process of transforming the given data into a form which is easier to interpret. Here, we are interested in making it more transparent for a machine learning model, but some features can be generated so that the data visualization prepared for people without a data-related background can be more digestible. However, the concept of transparency for the machine learning models is a complicated thing as different models often require different approaches for the different kinds of data.
Feature Engineering Example: Coordinates
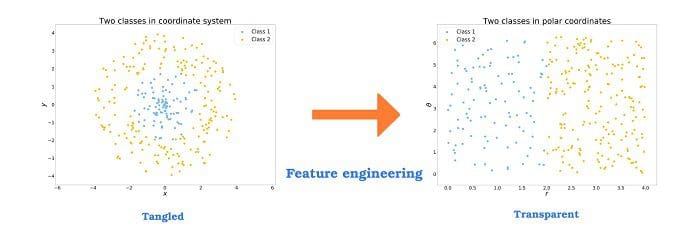
To understand the idea of feature engineering, we can consider a simple example. In the plot below, we see two classes of points. Imagine that you have a warehouse located at the point of and it is profitable to supply clients only in some limited distance. From the human perspective, it is easy to understand that we need to consider the points in some limited radius from the warehouse. This requires a combination of the two given features.
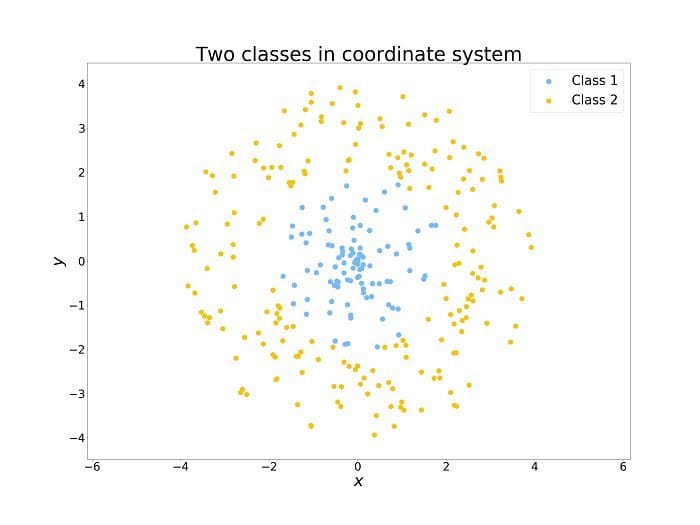
But this is not so obvious for algorithms. For example, the decision tree based algorithms take into consideration only one feature at a time and divide the set into one part where the values of a considered feature are higher than an arbitrary threshold and the second part where values are lower. To divide the space as above it would require a lot of such splits.
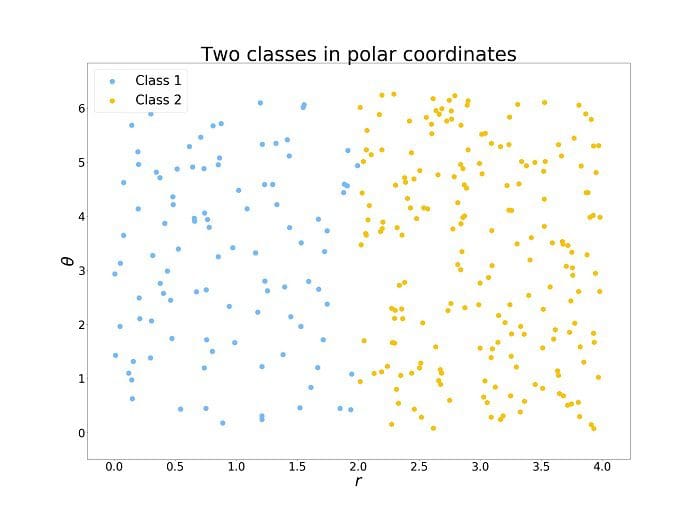
However, we can perform a simple transformation of coordinates which we were taught in high school. The transformation is from the so-called cartesian coordinates system (x, y) to the polar coordinates system (r, 0). Here, we use the following transformation:
![]()
And now, it is easy to see for a human and it is easy as well for an algorithm to analyze the data. Dividing the set with a split along r at the threshold r split = 2. Obviously, this is a trivial example and with the real data, it is rarely that simple, but this shows the potential of proper feature engineering for machine learning.
Feature Engineering Example: Continuous data
The most common type of data is continuous data. It can take any values from a given range. For example, it can be the price of some product, the temperature in some industrial process or coordinates of some object on the map.
Feature generation here relays mostly on the domain data. For example, we can subtract the warehouse price from the shelf one to calculate the profit or we can calculate the distance between two locations on the map.
The new possible features are limited only by the available features and known mathematical operations.
Feature Engineering Example: Categorical features
The second most popular data type is categorical data, meaning features which can take on values from a limited set of values. Often the feature can take only a single value.
It can happen otherwise, but in the case, such a feature is usually split into a set of features. For example, gender according to the ISO/IEC 5218 standard can take one of four values: not known, male, female, and not applicable.
Codes and one-hots
The problem with this kind of data is that algorithms are not designed to process textual data.
A standard workaround for this problem is categorical codes. For each category, we introduce an integer number representing it.
For example, the mentioned gender categories standard is encoded by 0, 1, 2 and 9 correspondingly. But sometimes for either visualization or model efficiency, we can construct different encoding. Instead of a single feature with several levels, we can have several boolean features where only one can take on the True value.
This is called one-hot encoding and is especially popular with neural networks.
Feature Engineering Example: Missing values
In the real world, it is sometimes impossible to acquire some data. Or the data is lost somewhere in the processing pipeline.
Due to that, there are usually some missing values in our data. Handling them is an art in itself. This part of the data processing is called data cleaning and often is considered to be a separate process.
Nonetheless, when creating some new features, we need to remember about it as the missing values can be hidden under different names and values. Some programming languages and libraries have a special object for such values. It is usually represented by “NaN” - not a number, but often some arbitrarily chosen values can be used instead.
For example, in a column of positive integers, the missing values can be encoded as “-1”. But this can be inconvenient when we calculate the mean of this feature without a previous analysis of its values.
Other times, the missing values can be replaced with “0” what enables one to calculate the sum without complications, but it prevents us from generating a new feature with dividing by the value.
One more common option is filling the missing values with the mean or the median calculated from the present values. But once again, if we compute the average again we will get a different value, so there will be a serious difference between a new feature based on the true mean and the miscalculated. These examples show the never changing truth - know your data! And this is important during the feature engineering as well.
That was missing!
One common practice is to introduce a boolean feature indicating whether a given sample had a missing value in the given feature.
It takes on either True if it was missing or False in the case where everything was in order. It lets the machine learning model know if it should treat the given value as a trustworthy one or should work around it.
Feature Engineering Example: Normalization
Another of the common feature engineering methods is bringing the data into a given interval. Why would we do it? The first reason is trivial, as computations on a bounded range of numbers prevent some numerical inaccuracies and limit the computational power required. The second reason is that some machine learning algorithms can handle that data better when it is normalized. There are several approaches to normalization of the data.
Standard normalization
In nature and in the human society, many things are governed by the normal (Gaussian) distribution. That is why we introduce normalization characteristic to the distribution. It is given by the following equation:
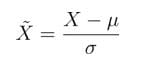
Here the X is our new feature. It is acquired by subtracting the mean value of the old feature from every sample of the old feature and then dividing it by the standard deviation which tells us about how wide is the spread of values of the feature. This brings the value of X into an interval of [-1,1].
Feature scaling
An alternative normalization can be done by subtracting the minimal value Xmin from the feature and then dividing by its range given as Xmax - Xmin. This gives us:
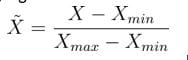
This normalization maps the given feature into the interval [0,1].
Right normalization for the model
As we mentioned, different models require different normalization in order to work efficiently. For example, in the case of the k-nearest neighbors, the scale of a particular feature plays a role of a weight. The bigger are the values the more important is the feature. In the case of the neural networks, normalization is not important for the final performance results per se, but it speeds up the training. On the other hand, the decision tree based algorithms neither benefit, nor get hurt by the normalization.
The right normalization for the problem
Sometimes the right normalization comes not from some general statistical or computational considerations, but from the domain knowledge. For example, in the modeling of some physical systems depending on temperature, it would be definitely fruitful to introduce either the Kelvin temperature scale as it enables some simple relations in the data. The domain knowledge is always handy in data science.
Feature Engineering Example: Date and Time
The next common data type group are all different formats of dates and time. The problem here is that it can vary by the format a lot.
For example, the data can be given either by some formatted string of text or by a standardized date class which exists in the given language or library. The standards and formats can vary among different organizations and regions of the world as well. For example, every European gets irritated while dealing with an American-formatted date, i. e. 10.27.2018.
It could easily lead to some misunderstandings or an underperforming model if the formats DD/MM/YYYY and MM/DD/YYYY were put in the same dataset as simple strings. Once again, the problem is that data is not a straightforward numerical data. It cannot be directly fed into a machine learning model.
The easiest way is to split the data into three integer features representing the day, the month and the year. But this is not the end. We can also construct some cultural-related features. For example, whether the day is a day of the weekend or it is a holiday. Other options are time or days elapsed from a certain event or intervals between consecutive events. Furthermore, time goes the same way.
It can be represented by hours, minutes, and seconds. But it can be converted into seconds only or can be measured from a certain event. For example, actually, most software uses the 00:00:00 UTC of the 1st of January 1970th as the beginning of time and it is a good start for the feature engineering process.
Example: tinkering the dates
As for example, we can take a dataset where dates play an important role. This is a dataset from the Blue Book for Bulldozers competition.
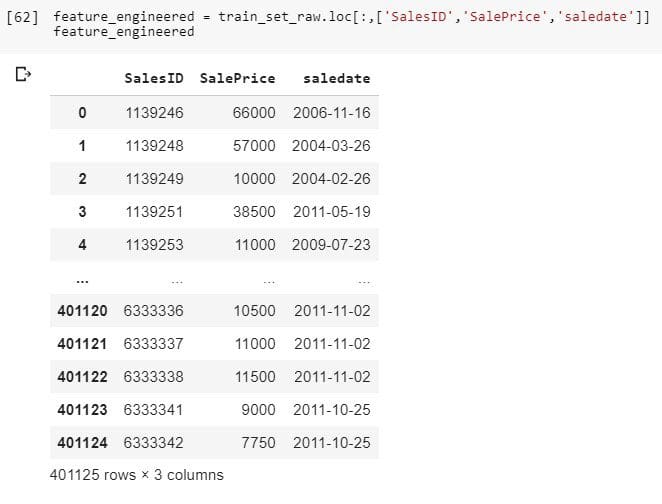
Here, we load the dataset with help of Pandas library available in Python. For the transparency, we take only three features. SalesID is how we identify the transaction and SalePrice is what we are supposed to predict. Besides that, in the dataset, we can find further information on the sold machines and the date of the sale. We can play a bit with the date.
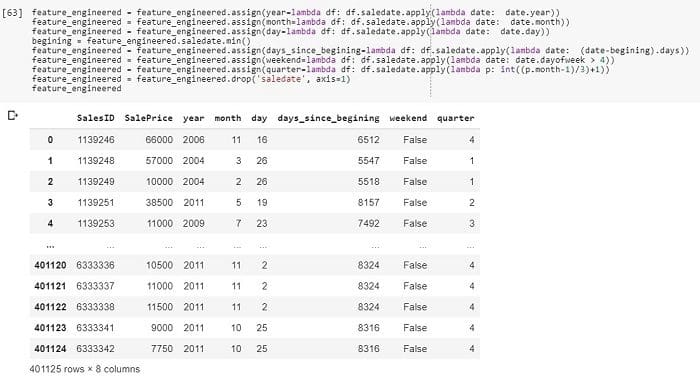
By a few simple lines of code, we changed the date column into six model-readable features which can be used to extract more information about the sales.
Feature Engineering Example: Text
The texts in computers are encoded by the numerical ASCII codes. This might sound like an easy thing to process. But nothing could be more wrong!
Extracting information from text relays on the language structure meaning relation among letters in words and words among themselves in the sentence. This spans a whole branch of an interdisciplinary field called Natural Language Processing (NLP).
Many developments were made in order to extract the information more easily. As this is a subject for at least another article or a whole book, we are not going to discuss it here.
Categorical from textual
Instead of processing the whole texts, we can split it into single words and try to find the ones with most occurrences.
For example, we may have access to a database of some Human Resource department. One of the fields in there may be the academic title. We can find there many things like Bachelor of Engineering, Master of Science, and Doctor of Philosophy. But there will be many more. What we can extract from this are words like bachelor, master, and doctor without the specific field. These span let’s say a four-level (together with no title) categorical feature of the education level.
A similar example is a full name with a title. In such a field, we can find phrases like Mr. Alan Turing, Mrs. Ada Lovelace, and Miss Skłodowska. We can extract the titles Mr., Mrs. or Miss that indicate the gender and the marital status. As you see, there are plenty of ways to use the textual data without using the full power of NLP which can be very computationally expensive.
Feature Engineering Example: Graphics
Visual data is the second kind of data which could be discussed in a separate article, at least if not in a whole monography.
Problems with analyzing this kind of data troubled scientists for decades. A whole field of Computer Vision grew around it. But what is worth mentioning is that a few years ago due to the deep learning revolution a simple way of analyzing images arose.
Convolutional Neural Networks (CNNs) let a user with not much domain knowledge neither in general Computer Vision (CV) nor in a given subject find a reasonable solution just by using one of the popular frameworks and a lot of computational power granted by Graphical Cards.
As you may see, there are a lot of possibilities to create new features. The real goal is to engineer such features that will help our data science pipeline.
But it even does not end here with the mentioned methods. There are even more. For example, generating features by mixing a continuous and a categorical feature into a new one. NLP and CV grant us a lot of further features. This still does not end here. The only way to get them all is through practice and experimentation. Due to the huge diversity, the feature engineering is often called an art.
Bio: Paweł Grabiński is oscillating between computers and physics, interested in things from theoretical physics to application development. Machine Learning enthusiast, with focus on Natural Language Processing. Helping to build Machine Learning Academy at MLJAR.
Resources:
- On-line and web-based: Analytics, Data Mining, Data Science, Machine Learning education
- Software for Analytics, Data Science, Data Mining, and Machine Learning
Related: