 Who is a typical Data Scientist in 2019?

 Who is a typical Data Scientist in 2019?
We investigate what a typical data scientist looks like and see how this differs from this time last year, looking at skill set, programming languages, industry of employment, country of employment, and more.
By Iliya Valchanov, 365 Data Science.
The term ‘data scientist’ has been around for 11 years now, after allegedly being coined in 2008 by Jeff Hammerbacher and DJ Patil.
Since then the data scientist has become the top job in the US for the last 4 years running (according to sources like the Harvard Business Review and Glassdoor report). But KDnuggets readers know all that very well. In fact, that may be one of the reasons why we all keep coming back here.
Even with all that considered, there are few ‘clear’ routes to building up the skill set needed to become part of this lucrative career. That’s why, last year, we performed a study of 1,001 LinkedIn profiles to build a picture of the ‘typical’ data scientist. The results were, in a way, confirmatory of other studies and polls, such as the yearly KDnuggets Software Poll, but also shed some light on other interesting aspects of what makes a data scientist… a data scientist.
What makes this study different is that, while the data is self-reported, we’ve gathered it from job seekers in the way they present themselves to employers.
Methodology
Just as we did last year, we investigated 1,001 data scientist’s LinkedIn profiles. Unlike other methods of gathering data, such as job ads, we believe that data posted by the professionals themselves are a good proxy of their actual resumes.
It was essential that we kept the same quotas. Therefore, once more, we took 40% of our profiles from Fortune 500 companies and 60% from elsewhere. Our country quotas were also the same, 40% from the USA, 30% from the UK, 15% from India, and another 15% from other countries. Convenience sampling was employed due to data accessibility limitations.
Summary
So, how does today’s ‘typical’ data scientist differ to one from a year ago?
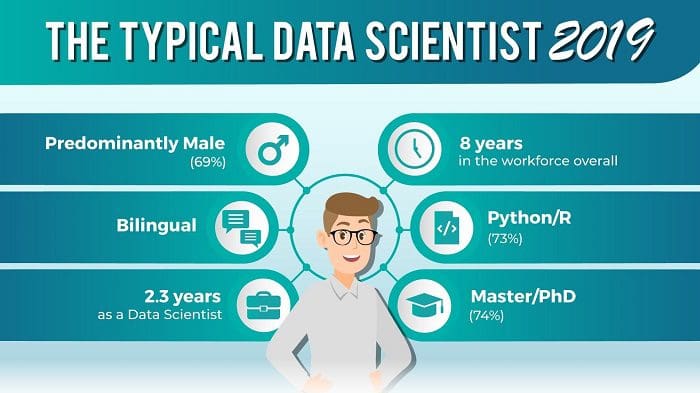
At first glance, it seems, not much. The field is still dominated by men, dropping only 1% since last year (69% in 2019 – 70% in 2018); three quarters of our cohort have a master’s or PhD (again, negligibly decreasing); and the average experience in the role has risen just 0.3 years from 2 to 2.3.
One notable general change, however, is that last year, on average, data scientists had been in the workforce for 4.5 years, while today that number is 8 years. This implies more people are switching careers at an older age or what we deem more probable – statisticians, ‘data miners’, econometricians, and others have evolved (likely acquiring new skills, too) and embraced the new name of their profession: data scientist. In fact we’ve looked into the naming conventions in the field before, and you can find a detailed overview here.
This was not the only revelation, however, as we segment the data further, we come across some fascinating insights about the 2019 data scientist.
Skill Set
Arguably the most important aspect of a data scientist is the skills they have.
After exploring the top 3 tools each data scientist values the most, we find that, just like last year, it is programming languages that are found most in a data scientists toolkit (as opposed to software, such as Tableau or SAS).
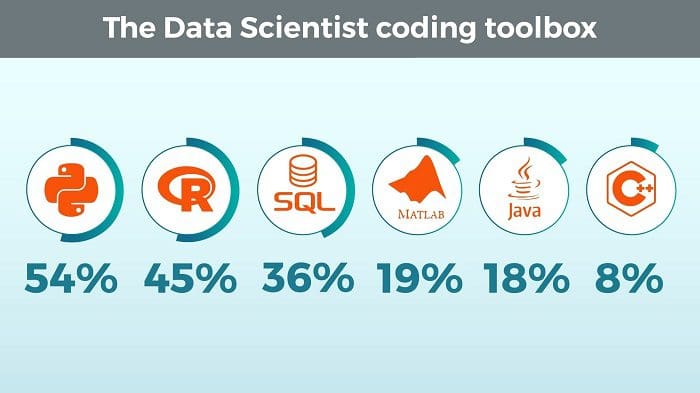
It is still R and Python that are leading the pack, but while both sat equally in 2018, with 53% of data scientists boasting either skill, Python is now leaving R in the dust (or as Gregory Piatetsky-Shapiro put it – Python continues to eat away at R). 54% of our cohort put Python as one of their top skills and only 45% mention R.
SQL is a solid 3rd choice (with 36%)for our participants (only a 4% drop from last year). The last 3 languages in the top 6 haven’t changed from 2018.MATLAB and Java users even equal those of last year (19% and 18% respectively), however, we do observe a significant 10% drop for C/C++ programmers (18% to 8%).
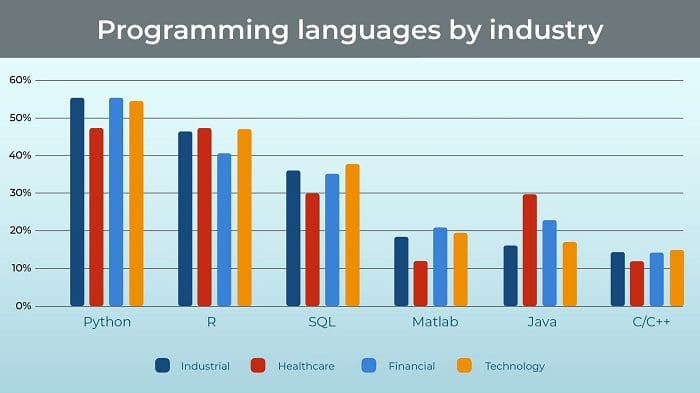
Finally, last year we looked at the skill set by industry, so it makes sense to replicate this analysis, too. In terms of distribution of languages across industry, we observe very similar results to the 2018 trends. The main take-away is that even in this segmentation the results essentially mirror what we see as an overall preference – Python is dominating all industries.
Industry of employment
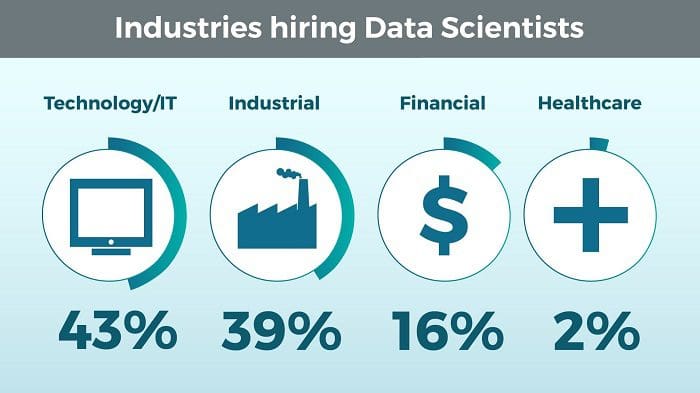
The biggest employer of data scientists continues to be the Technology/IT industry, increasing 1% since last year (43% in 2019 – 42% in 2018). However, while tech is still reigning, data scientists in the industrial sector are also increasing, rising from 37% to 39%. The financial sector is unchanged at 16%, while the healthcare industry went from employing 5% of data scientists, to a tiny 2% (certainly it is worth noting that Healthcare is an insignificantly small group compared to the others, so this drop may be completely attributed to sampling limitations).
These results don’t particularly show huge changes, year by year, in the areas where data scientists are desired, but what if we look at these industries segmentedby country.
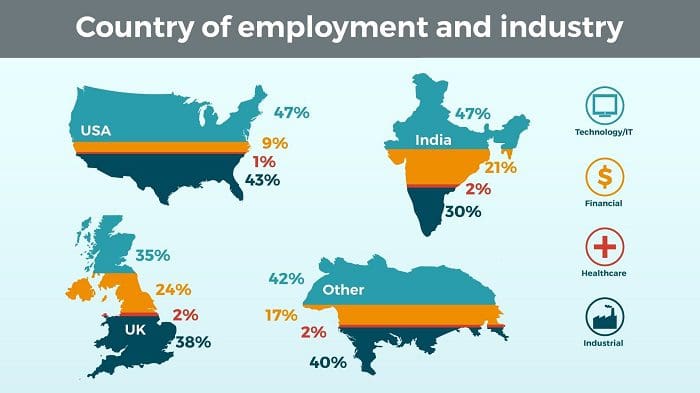
As it was last year, most of the countries’ results resemble those of the aggregate, aside from the UK which favours the finance industry more than the other countries.Even with the unclear future of London as the financial center of Europe, financial institutions in the UK seem to be heavily invested in data science.
The most prominent change, however, comes from India, which looks to have decreased the number of data scientists in their tech industry from a massive 63% to a more average 47%. Some of these have gone across to the industrial sector, that now hires 30% of India’s data scientists, up from 21.4%. But it looks like India has taken a page out of the UK’s book, as their financial industry has gained a whopping 13% more data scientists (8.3% in 2018 – 21% in 2019). It is no secret that India has dominated the tech world with many companies outsourcing and data science is following suit. Continuing to follow the developments of the field in India is surely something we are looking forward to.
Conclusion
This replicated study has reiterated what it takes to become a data scientist. The programming languages required for a data scientist appear clearer than ever, with the gap between Python and R continuing to expand. This is yet another ‘check’ for aspiring data scientists, helping them to choose wisely which skills to focus on, depending on the country and industry you intend to work in.
The changes witnessed from 2018 to 2019 may seem less revolutionary than what a researcher wants, but they are indeed a confirmation of the trends that are already taking place. As data science is standing stronger than ever, we expect to see more stability and less surprises in the data scientist profile. While far away from a mature field, data science is still evolving and keeping up with tends and patterns is as important as ever.
For all findings, follow this link for the 2019 study and this link for the 2018 one.
Resources:
- On-line and web-based: Analytics, Data Mining, Data Science, Machine Learning education
- Software for Analytics, Data Science, Data Mining, and Machine Learning
Related: