 6 bits of advice for Data Scientists
 6 bits of advice for Data Scientists
As a data scientist, you can get lost in your daily dives into the data. Consider this advice to be certain to follow in your work for being diligent and more impactful for your organization.
To err is human.
And who is more human than us data scientists when measured by that metric.
The important thing is to look at our mistakes. And learn from them.
A data scientist needs to be critical and always on a lookout of something that others miss.
But sometimes in our day to day job and coding per se, we get lost in our train of thought and fail to look at the overall picture.
In the end, our business partners have only hired us to generate value, and we won’t be able to generate value unless we develop business critical thinking.
So here is some advice that one can include in the day to day data science work to be more diligent and more impactful at the same time.
1. Beware of the Clean Data Syndrome

How many times it happens that we start working straight on the data we get. Start creating models? Or even present descriptive analytics generated automatically to our business counterparts?
But, do you ever ask — Does this data make sense?
Falsely assuming that the data is clean could lead you towards wrong Hypotheses.
You actually can discern a lot of important patterns by looking at discrepancies in the data.
For example, if you notice that a particular column has more than 50% values missing, one might think about dropping the column.
But what if some data collection instrument has some error? You could have helped the business to improve the process.
Or let us say you have a distribution of Male vs. Female as 90:10 in a Female Cosmetic business.
One may assume clean data and show the results as it is or they can use common sense and ask their business partner if the labels are switched.
2. Be Aware
We all know fab.com. For those who don’t, it is a website that sells “CURATED HEALTH, FITNESS & WELLNESS PRODUCTS.”
But it was not always so.
Fab.com started up as fabulis.com, a site to help gay men meet people.
One of the site’s popular features was the “Gay deal of the Day.”
One day the deal was for Hamburgers — and half of the buyers were women. Why were women on the site?
The above fact caused the data team to realize that there was a market for selling goods to women. So Fabulis.com changed its business model to fab.com as a sale site for designer products.
Be on the lookout for something out of the obvious. Be ready to ask questions. If you find something you may have hit gold.
Data can help a business to optimize revenue, but sometimes data has the power of changing the direction of the company as well.
Another example, Flickr started up as a Multiplayer game. Only when the founders noticed that people were using it as a photo upload service, did they pivot to a photo-sharing app.
There are countless examples as such.
Try to make a good example out of your company’s business as well.
3. Start Focusing on the right metrics
What do we want to optimize for?
Most of the businesses fail to answer this simple question.
Every business problem is a little different, and it should be optimized differently.
For example, A website owner might ask you to optimize for active users. But is it the right metric? It is just a vanity metric, which will always increase.
I would instead try to optimize the percentage of users that are active to know how my product is performing.
Another Example, We all have created classification models. A lot of time we have tried to increase accuracy for our models. But do we want accuracy as a metric of our model performance?
What if we are predicting the number of asteroids that will hit the earth.
Just say zero all the time. And you will be 99% accurate. My model can be reasonably accurate, but not at all valuable. A better metric would be the F score.
Designing a Data Science project is much more important than the modeling itself.
4. Statistics Lie sometimes, maybe a lot of times

Be critical of everything that gets quoted to you. Statistics have been used to lie in advertisements, in workplaces and a lot of other marketing venues in the past. People will do anything to get sales or promotions.
For example: Do you remember Colgate’s claim that 80% of dentists recommended their brand?
This statistic seems pretty good at first. All dentists use Colgate; I should too. Right?
It turns out that at the time of surveying the dentists, they could choose several brands — not just one. So other brands could be just as popular as Colgate.
The marketing department is just a myth creation machine. I can understand that.
The marketing department is just a myth creation machine.
But it is painful when you see such sort in research. For instance, the Small Arms survey suggests that for every 100 Americans, there are 120 guns.
It feels reasonable to assume that every American must be packing heat. Then there is another study that shows that only 47 percent of households have guns in them.
Are you confused yet?
Some of the household pack tons of guns. And thus it won’t be reasonable to say that every American is armed.
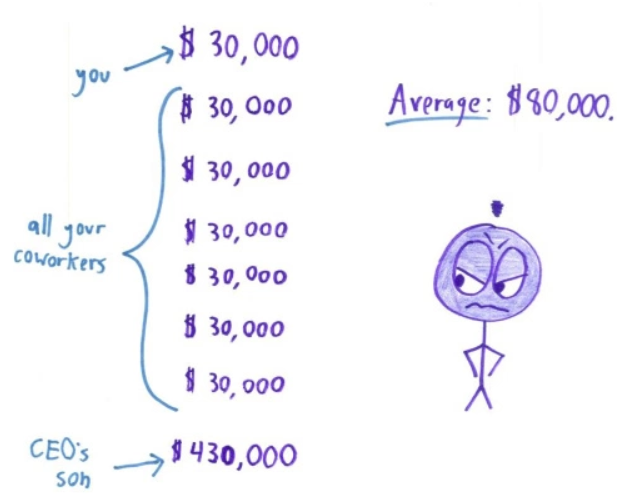
Also never trust a chart that doesn’t label the Y-axis.
Below chart was shown by Rep. Jason Chaffetz (R-UT) during a congressional hearing, to Planned Parenthood president, showing how abortions are going up and life-saving procedures are down.
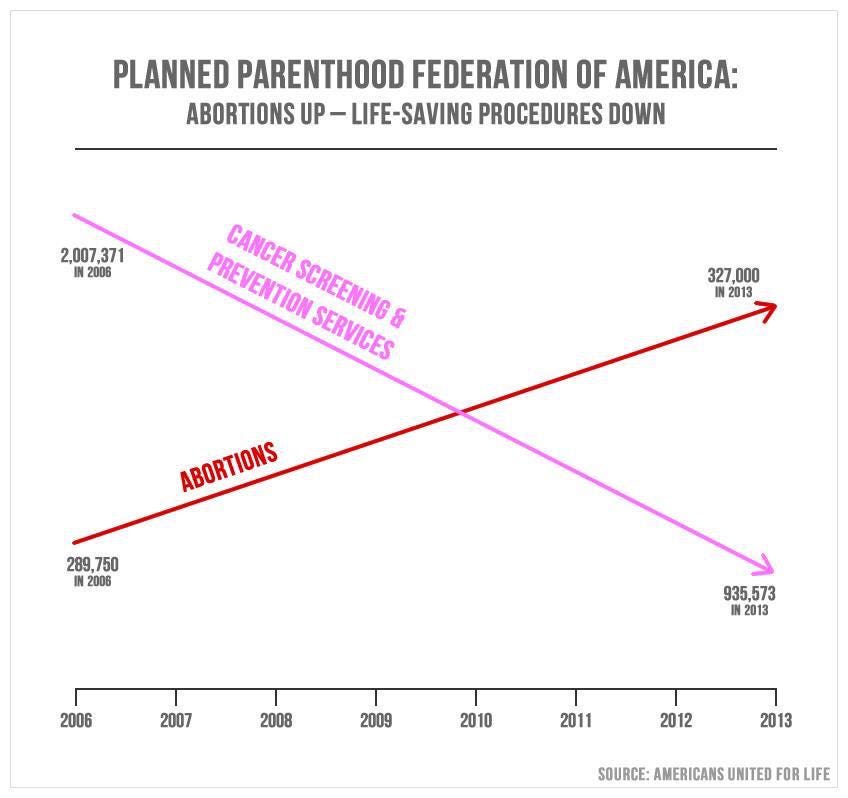
Look at the real picture with labeled axes, and one can see the lies being told…
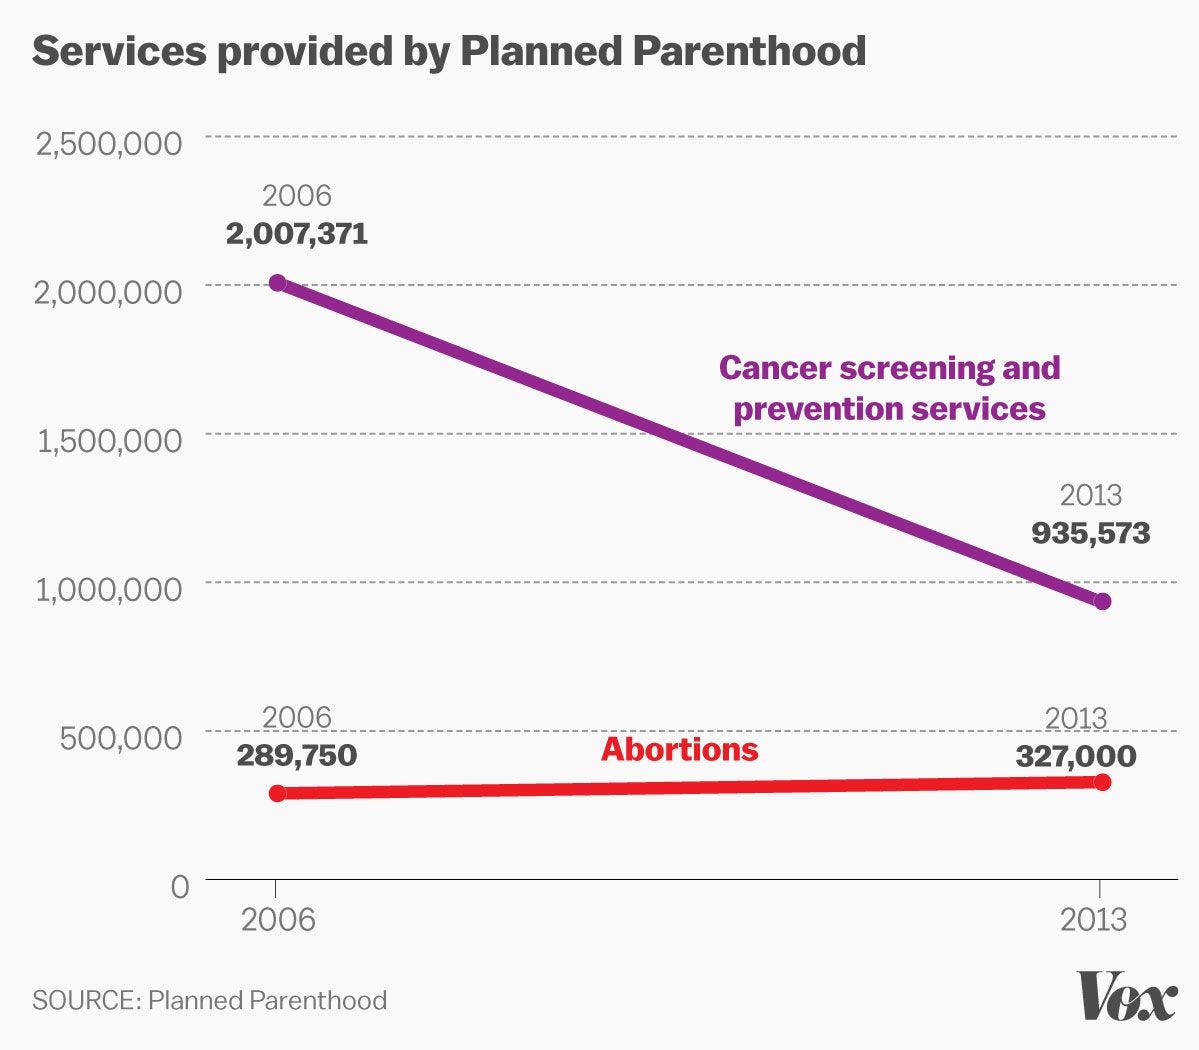
Add the fact that the U.S. Preventative Services Task Force changed its recommendation to get cancer screenings every two years, instead of every year, and one can even explain the decline in Cancer Screenings.
Be objective while seeing charts presented by politicians.
5. The Long string rule of Probability

It happened during the summer of 1913 in a Casino in Monaco.
Gamblers watched in amazement as a casino’s roulette wheel landed on black 26 times in a row.
And since the probability of a Red vs. Black is precisely half, they were confident that red was “due”. It was a field day for the Casino — a perfect example of Gambler’s fallacy, aka the Monte Carlo fallacy.
And this happens in real life. People tend to avoid long strings of the same answer. Sometimes sacrificing accuracy of judgment for the sake of getting a pattern of decisions that look fairer or probable.
For example, an admissions officer may reject the next application if he has approved three applications in a row, even if the application should have been accepted on merit.
Don’t give in to such fallacies.
The world works on probabilities. We are seven billion people, doing an event every second of our life.
Rare events are bound to happen. But don’t put your money on them.
6. Correlation does not imply Causation
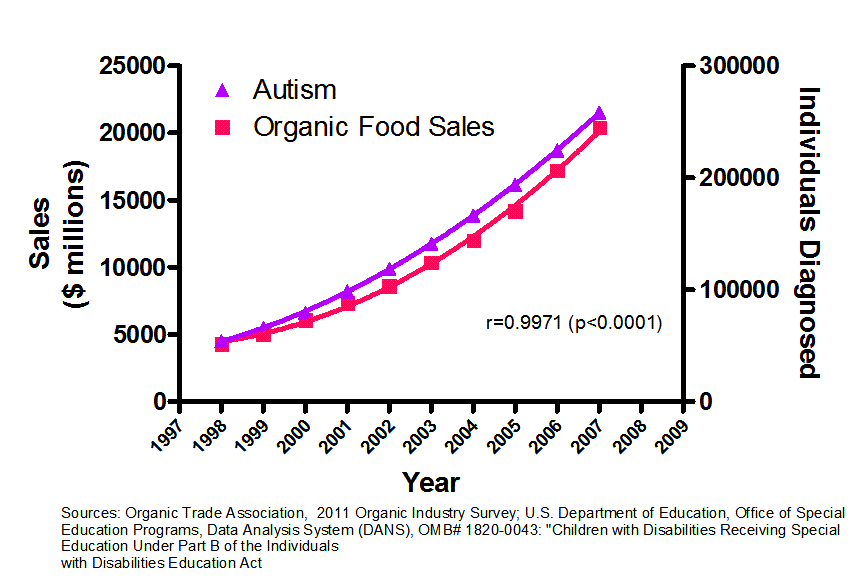
Can you believe this — Autism being caused by Organic food. Good. Or the fact is just the opposite. Does Autism increase organic food sales? Not really. Or maybe.
Just because two variables move together in tandem doesn’t necessarily mean that one causes the another.
Correlation does not imply causation.
It is the Holy Grail of a Data scientist toolbox.
There have been other hilarious examples for this in the past. Some of my favorites are:
- Looking at the firehouse department data you infer that the more firemen are sent to a fire, the more damage is done.
- When investigating the cause of crime in New York City in the 80s, an academic found a strong correlation between the amount of serious crime committed and the amount of ice cream sold by street vendors!Obviously, there was an unobserved variable causing both. Summers are when the crime is the greatest and when the most ice cream is sold. So Ice cream sales don’t cause crime. Neither crime increases ice cream sales.
Repeat with me: Correlation does not imply causation.
Original. Reposted with permission.
Bio: Rahul Agarwal is a data scientist consultant and big data engineer working with WalmartLabs. Previously, Rahul worked at startups like Fractal and MyCityWay and coglomerates like Citi.
Related: