Using the Fitbit Web API with Python
Fitbit provides a Web API for accessing data from Fitbit activity trackers. Check out this updated tutorial to accessing this Fitbit data using the API with Python.
By Michael Galarnyk, Data Scientist
Fitbit provides a Web API for accessing data from Fitbit activity trackers, Aria & Aria 2 scales, and manually entered logs. So if you have been using a Fitbit, you can use the Fitbit API (https://dev.fitbit.com/build/reference/web-api/basics/) to get your own data. Apart from the convenience of using the API to get the data you can also get on the online app, you can use the API to get intraday (minute by minute) data which is not available on the online app. While this tutorial is initially similar to Stephen Hsu’s amazing tutorial, I figured I would update the process a little, address a couple errors you could get, and show a bit of how you could go about graphing data. As always, the code used in this tutorial is available on my GitHub. With that, let’s get started!
1.) Create a Fitbit account
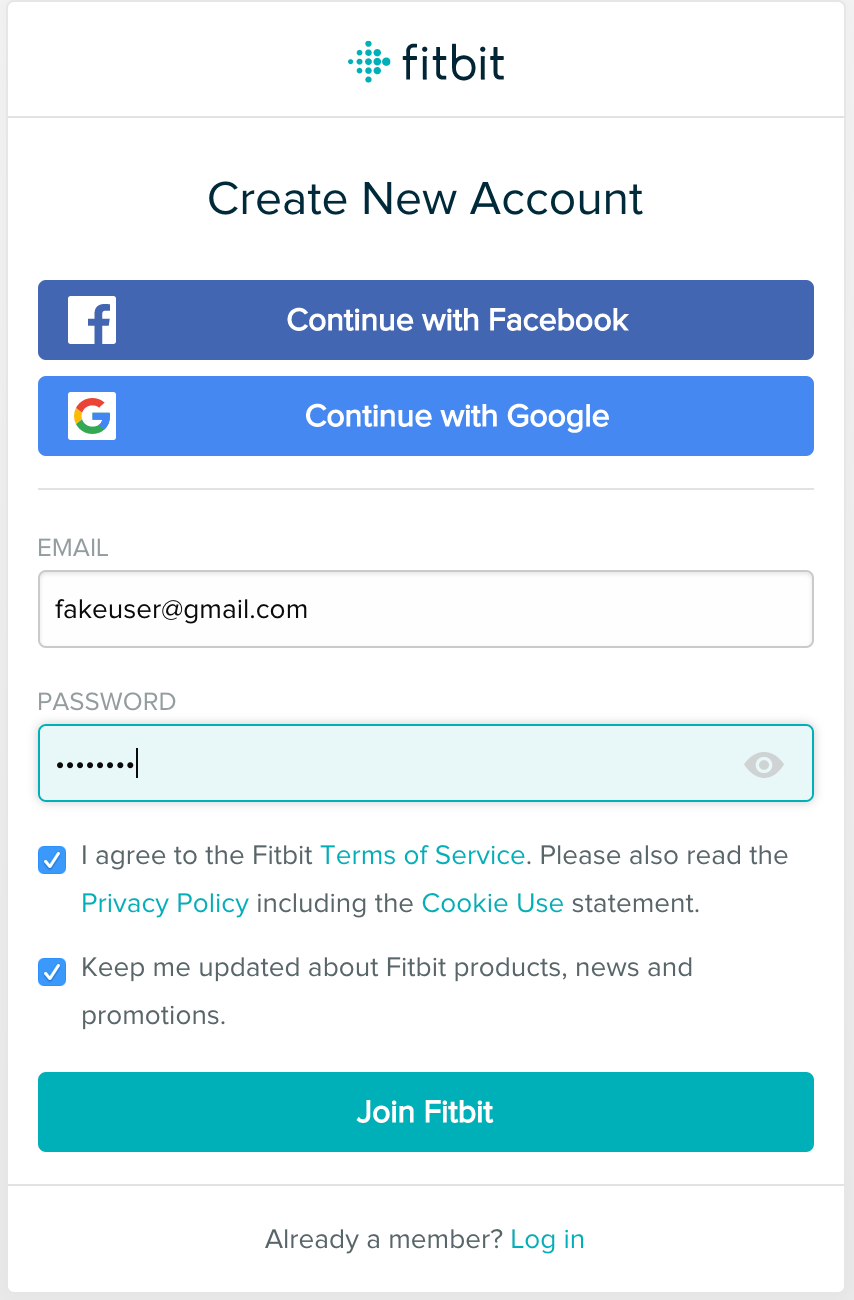
You can create a Fitbit account by clicking here. It will take you to a page similar to the one below.
2.) Set up your account and create the app
Go to dev.fitbit.com. Hover on “Manage” and click on “Register An App”.
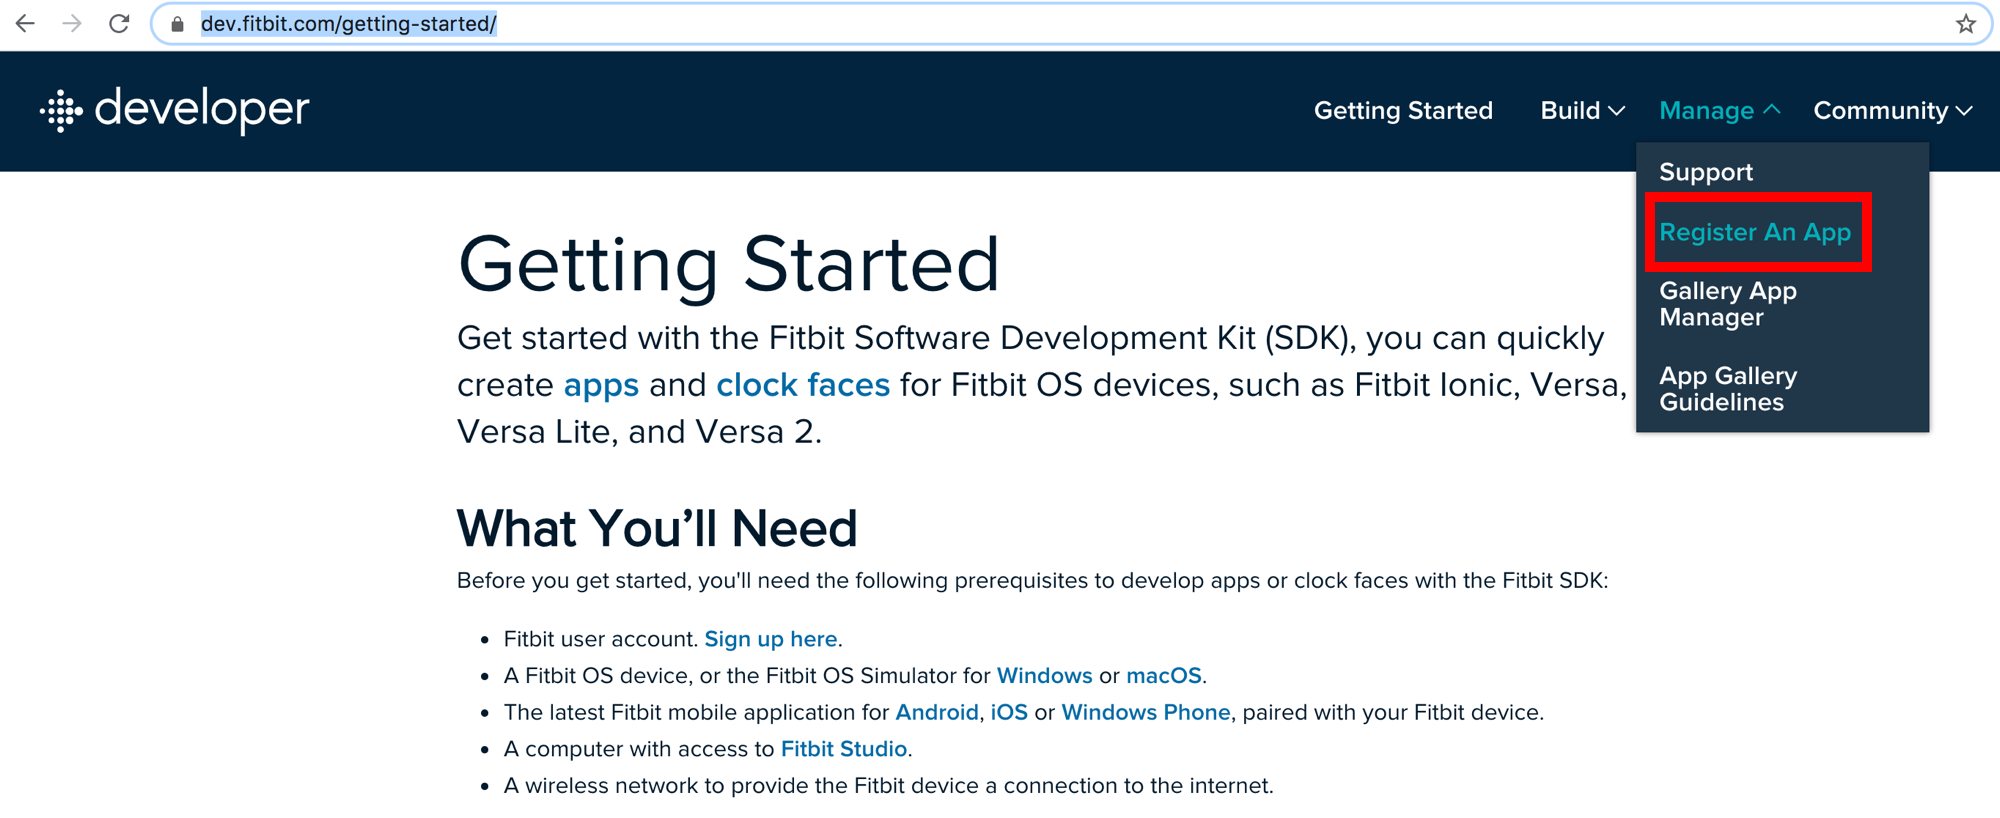
A page should appear that looks similar to the one below.

For each of the fields in the image, here is some advice of what you can put in the registration page.
Application Name: Can be anything.
Description: Can be anything.
Application Website: Can be anything.
Organization: Can be anything.
Organization Website: Since I am using it for personal use (to look at personal fitbit data), this may not apply.
Terms of Service Url: I put in the Fitbit terms of service: https://dev.fitbit.com/legal/platform-terms-of-service/
Privacy Policy Url: I put in the Fitbit privacy policy: https://www.fitbit.com/legal/privacy-policy
OAuth 2.0 Application Type: OAuth 2.0 Application Type should be “Personal” if you want to download your intraday data. By the way, if you don’t know what OAuth is, here is an explanation.
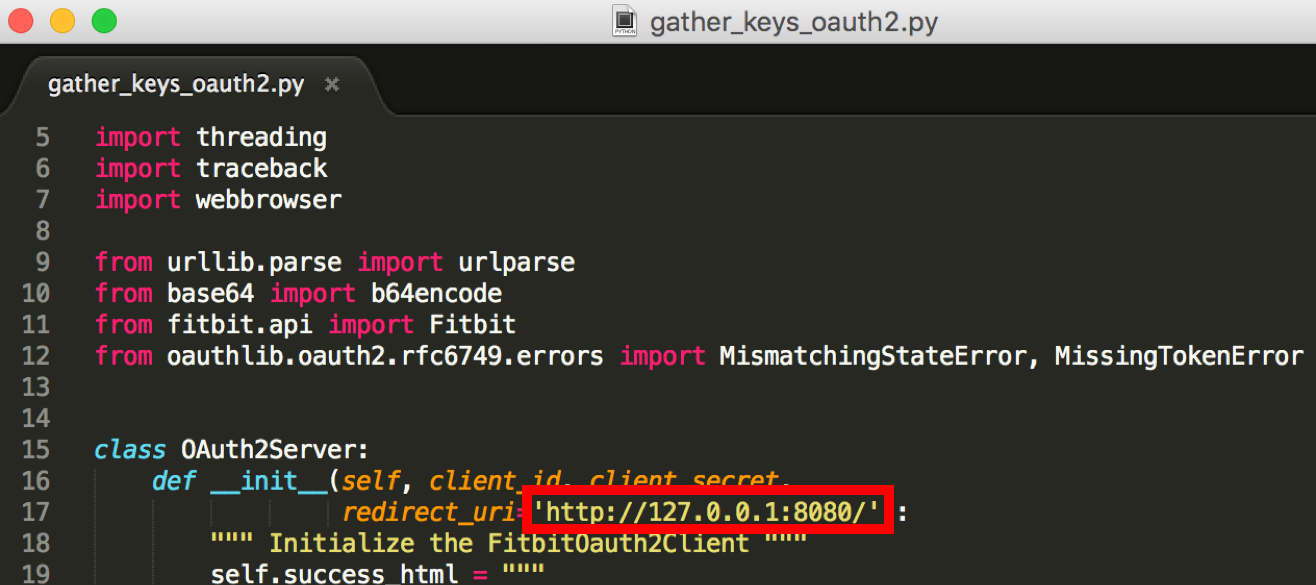
Callback Url: Make sure the Callback URL is http://127.0.0.1:8080/ in order to get our Fitbit API to connect properly. This is due to the library we will use that requires this as you can see below.
Finally, click on the agreement box and click on register. A page that looks similar to the one below should appear.
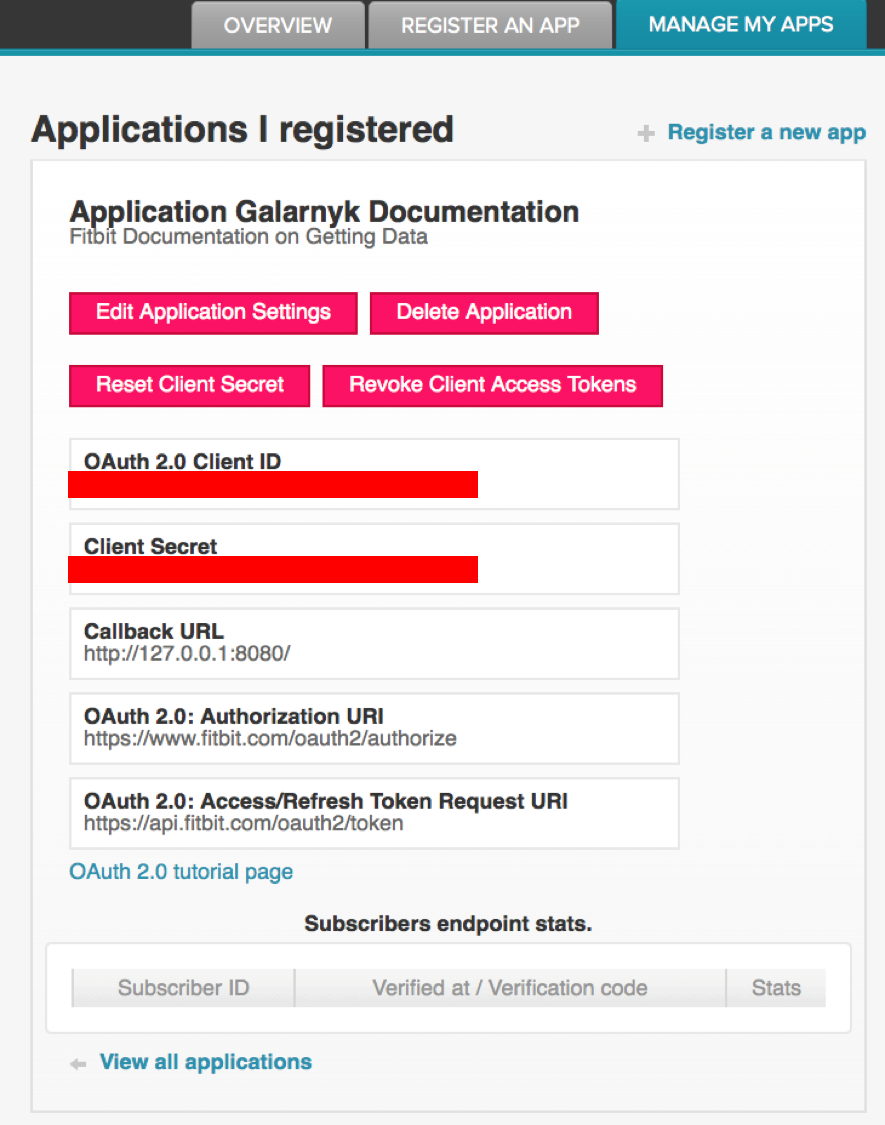
The parts we will need from this page are the OAuth 2.0 Client ID and the Client Secret. You will need the client ID and client secret for later so take note of them.
# OAuth 2.0 Client ID
# You will have to use your own as the one below is fake
12A1BC# Client Secret
# You will have to use your own as the one below is fake
12345678901234567890123456789012
3.) Installing the Python Library
The next step is to use a Fitbit unofficial API. After clicking on the link, click the green button. Next, click on Download Zip and proceed to unzip the file.
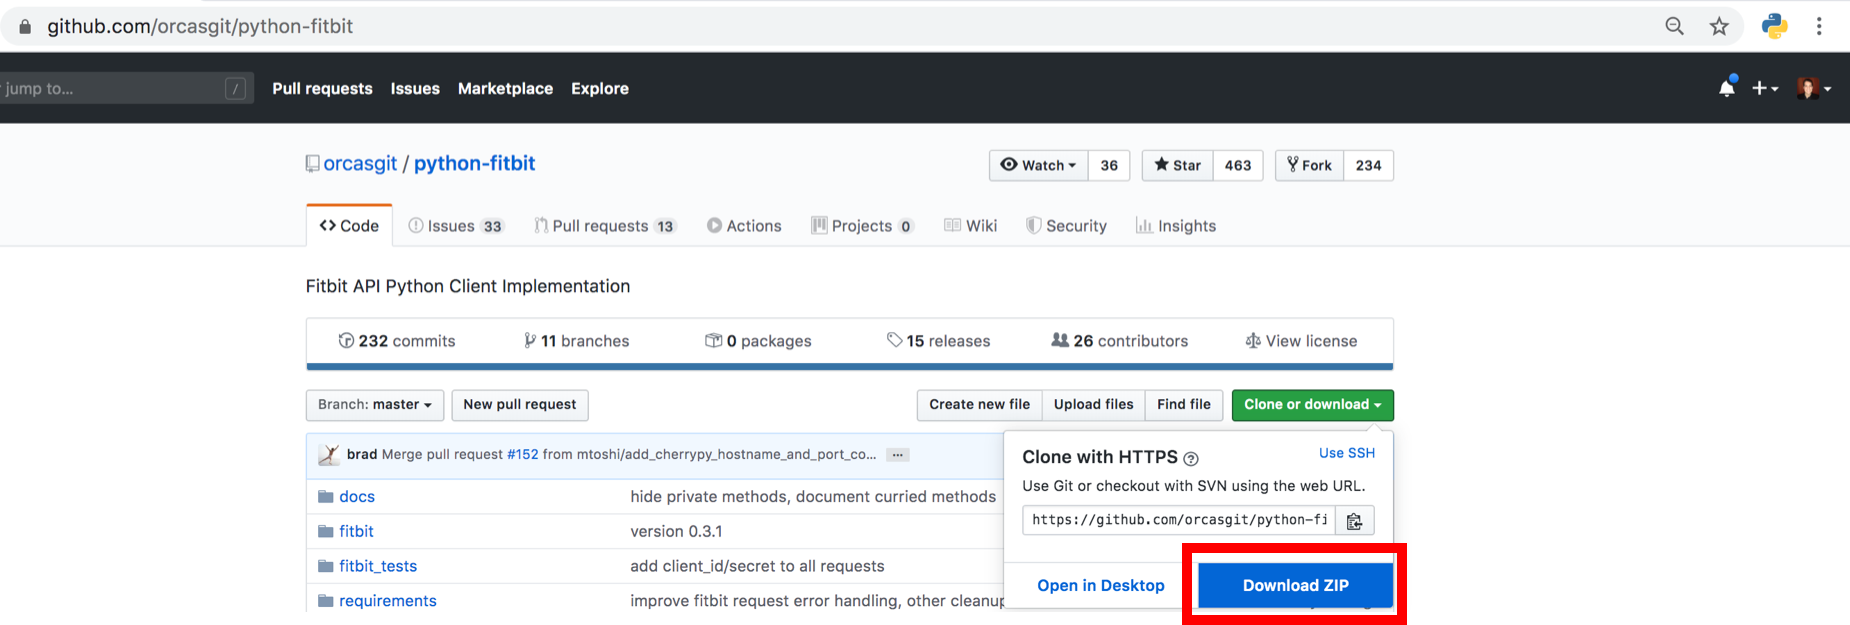
After that, open up a terminal/command line to change directories to the unzipped folder and run the command below.
#reasoning for it here:
#https://stackoverflow.com/questions/1471994/what-is-setup-py
# If you want to install it a different way, feel free to do so. python setup.py install
4.) API Authorization
Before starting this section, I should note two things. First, the code used in this tutorial is available on my GitHub. Second, if you have errors, I have a potential errors section later in the blog post.
The code below imports various libraries and assigns your CLIENT_ID and CLIENT_SECRET from step 2 to variables.
# This is a python file you need to have in the same directory as your code so you can import it
import gather_keys_oauth2 as Oauth2import fitbit
import pandas as pd
import datetime# You will need to put in your own CLIENT_ID and CLIENT_SECRET as the ones below are fake
CLIENT_ID='12A1BC'
CLIENT_SECRET='12345678901234567890123456789012'
The code below enables the authorization process to take place
server=Oauth2.OAuth2Server(CLIENT_ID, CLIENT_SECRET)
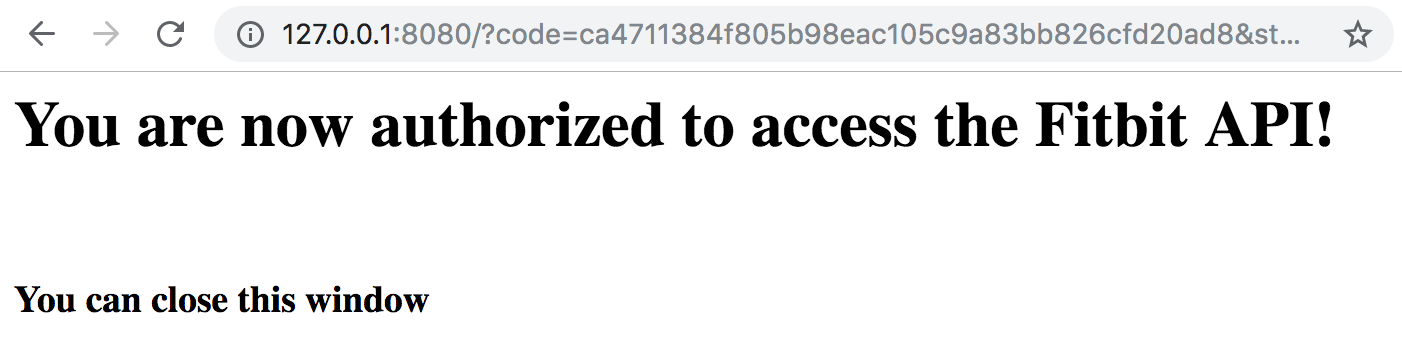
server.browser_authorize()
ACCESS_TOKEN=str(server.fitbit.client.session.token['access_token'])
REFRESH_TOKEN=str(server.fitbit.client.session.token['refresh_token'])
auth2_client=fitbit.Fitbit(CLIENT_ID,CLIENT_SECRET,oauth2=True,access_token=ACCESS_TOKEN,refresh_token=REFRESH_TOKEN)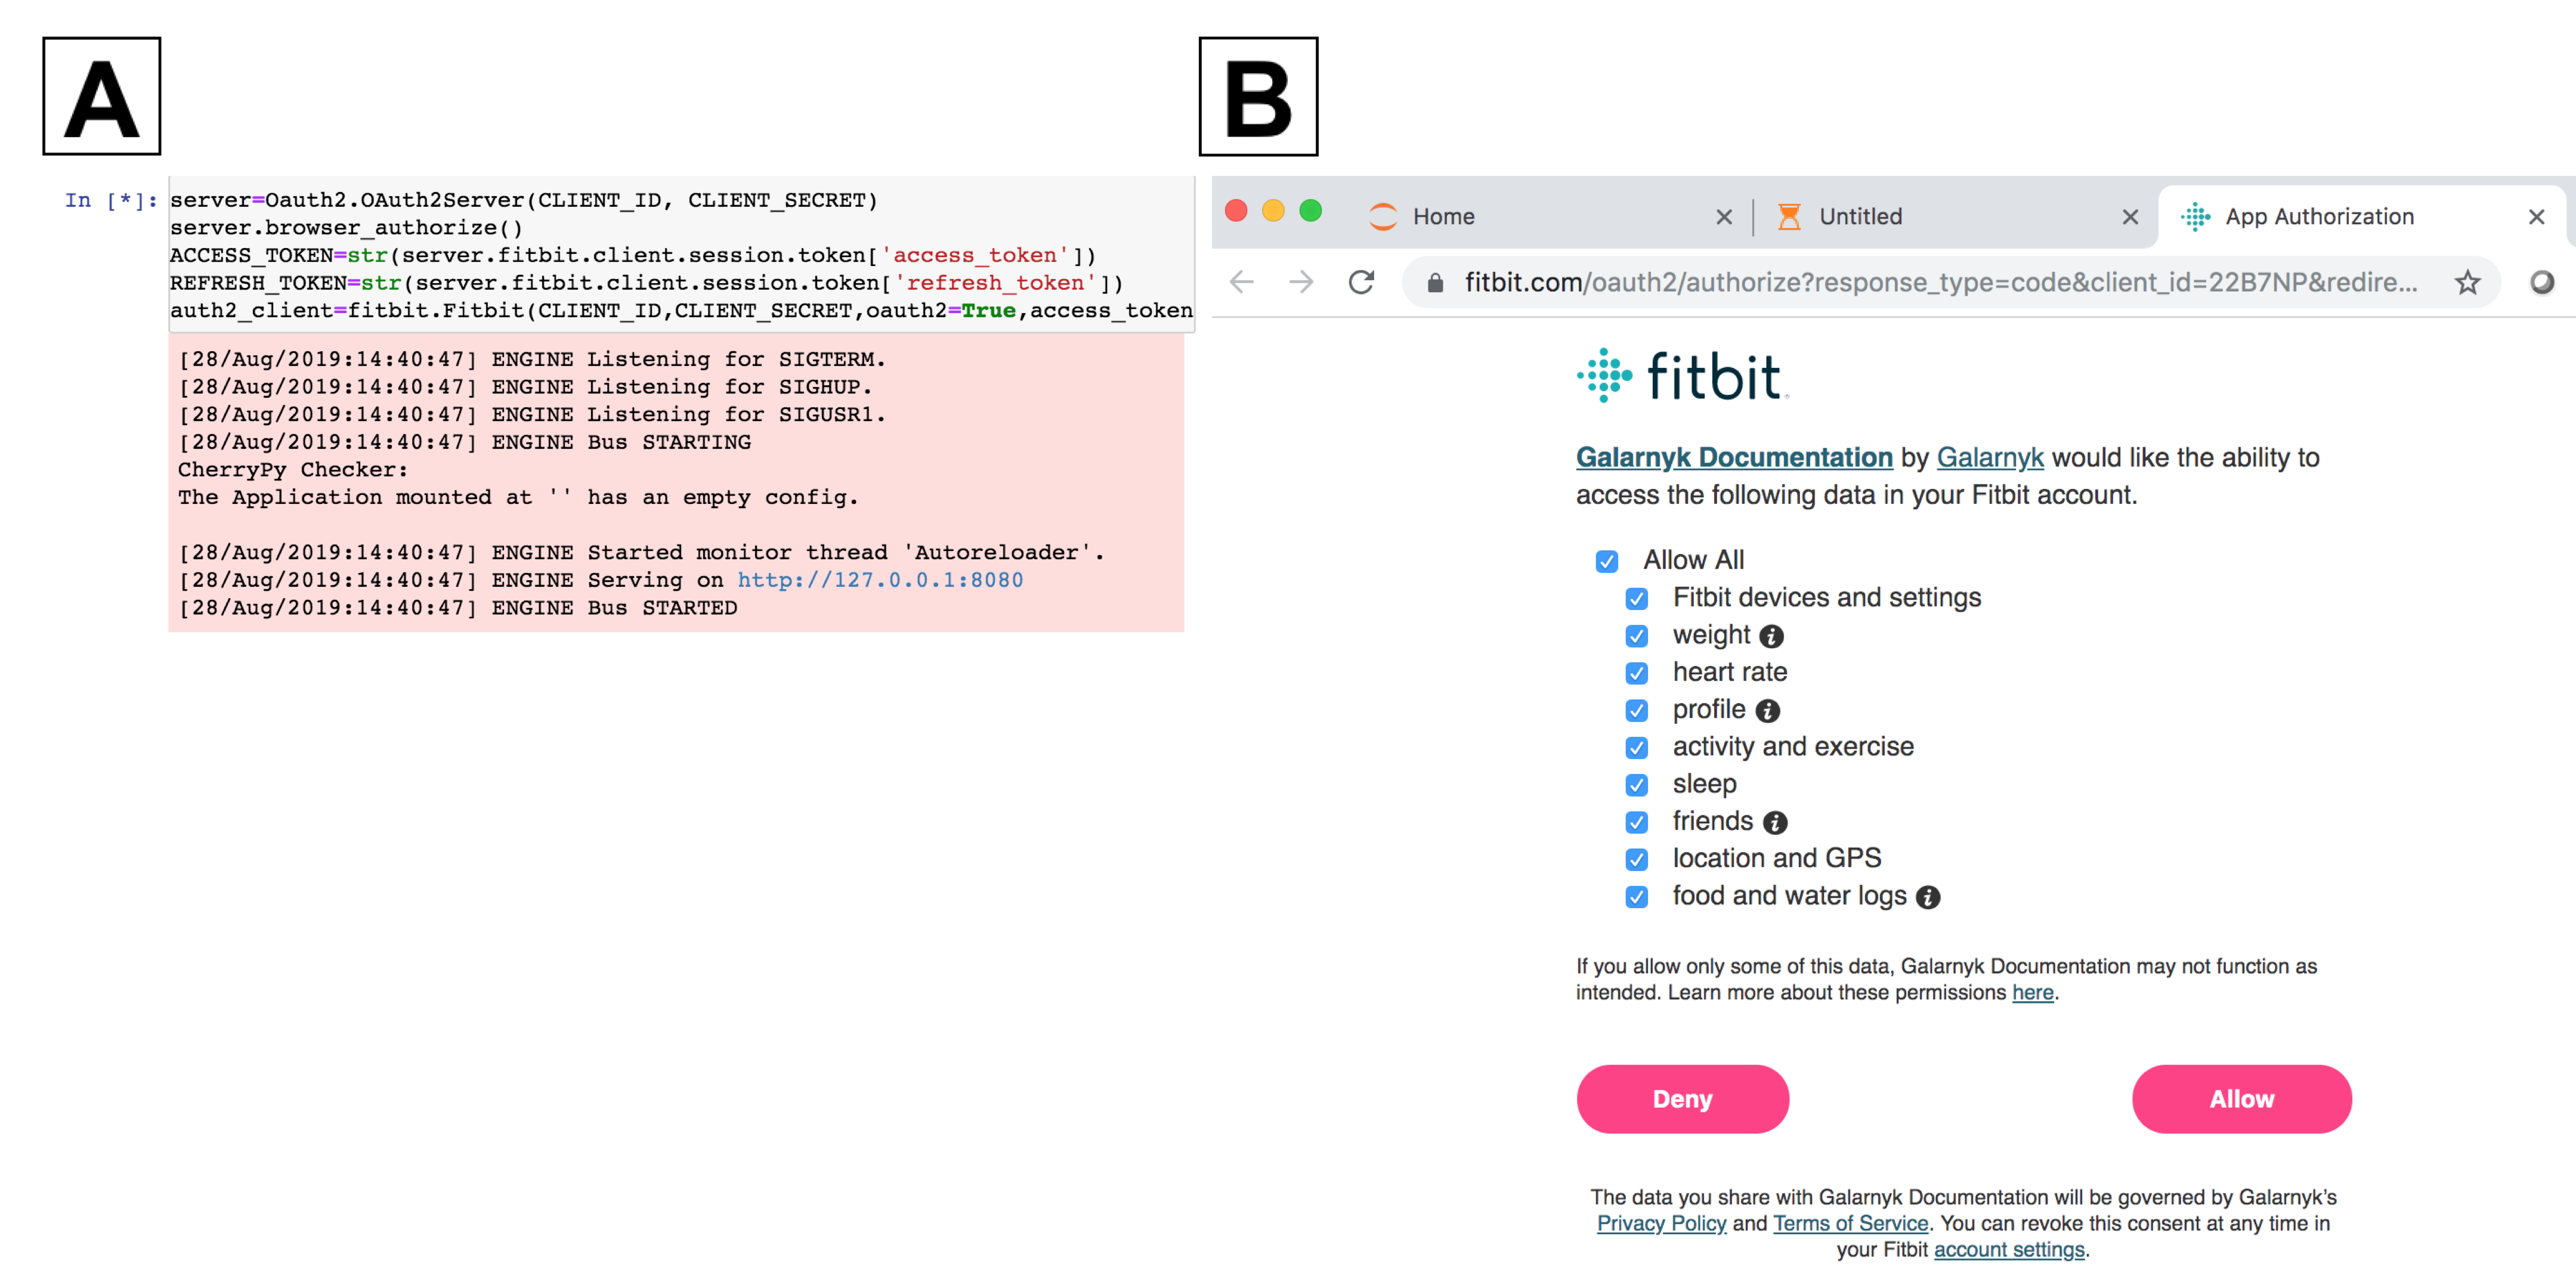
What the page should look like after authorization and signing in.
5a.) Get One Day of Data
I will first start by getting one day of data so that the next section will be easier to understand.
# This is the date of data that I want.
# You will need to modify for the date you want
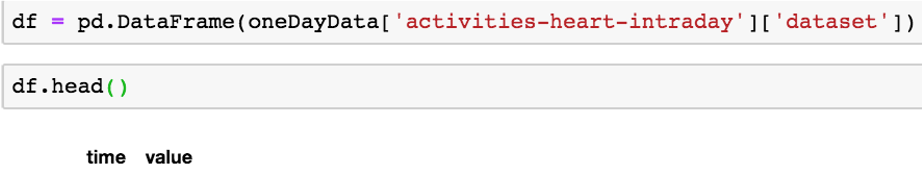
oneDate = pd.datetime(year = 2019, month = 10, day = 21)oneDayData = auth2_client.intraday_time_series('activities/heart', oneDate, detail_level='1sec')
You can put this data into a pandas DataFrame if you want.
Of course, you can always export your data to a csv or excel file.
# The first part gets a date in a string format of YYYY-MM-DD
filename = oneDayData['activities-heart'][0]['dateTime'] +'_intradata'# Export file to csv
df.to_csv(filename + '.csv', index = False)
df.to_excel(filename + '.xlsx', index = False)
5b.) Get Multiple Days of Data
The code below gets all the days of data you have starting from the startTime variable (called oneDate in the code below).
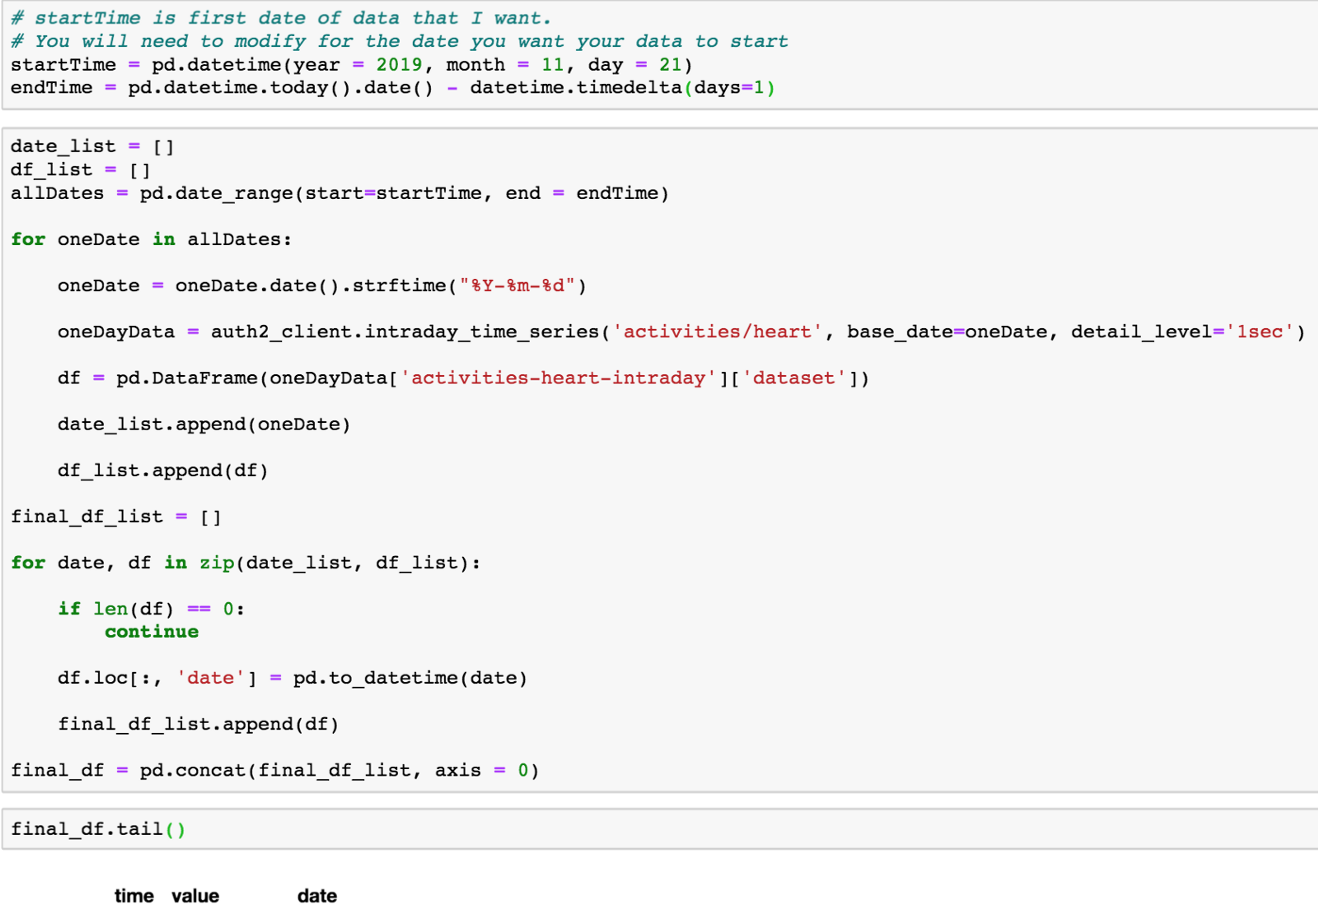
You can of course export final_df to a csv file (I would recommend not trying to export to excel as the there can be too many rows to easily export to excel).
filename = 'all_intradata'
final_df.to_csv(filename + '.csv', index = False)
6.) Try to Graph Intraday Data
This is a section I would highly advise you look at the GitHub code for with your own data.
The end goal of this section is to get a particular time on a particular day graphed appropriately (date to also have the time of the day included). I should note that I am not making my code efficient partially due to my laziness. If you don’t understand what is going on, don’t worry. You can scroll down and see the end result.
# I want to get the hour of the day and time. The end goal of this section is to get a particular time on a particular day.
hoursDelta = pd.to_datetime(final_df.loc[:, 'time']).dt.hour.apply(lambda x: datetime.timedelta(hours = x))minutesDelta = pd.to_datetime(final_df.loc[:, 'time']).dt.minutes.apply(lambda x: datetime.timedelta(minutes = x))secondsDelta = pd.to_datetime(final_df.loc[:, 'time']).dt.seconds.apply(lambda x: datetime.timedelta(seconds = x))# Getting the date to also have the time of the day
final_df['date'] = final_df['date'] + hoursDelta + minutesDelta + secondsDelta
The next step for me will be looking at 3 days of data rather than bunch of days.
startDate = pd.datetime(year = 2019, month = 12, day = 24)
lastDate = pd.datetime(year = 2019, month = 12, day = 27)coupledays_df = final_df.loc[final_df.loc[:, 'date'].between(startDate, lastDate), :]
Keep in mind that you can also try to graph by grouping by date and hour (or even seconds if you want) and taking the mean of the heart rate. The code also tries to make the graph look a bit better.
fig, ax = plt.subplots(figsize=(10, 7))# Taken from: https://stackoverflow.com/questions/16266019/python-pandas-group-datetime-column-into-hour-and-minute-aggregations
times = pd.to_datetime(coupledays_df['date'])
coupledays_df.groupby([times.dt.date,times.dt.hour]).value.mean().plot(ax = ax)ax.grid(True,
    axis = 'both',
    zorder = 0,
    linestyle = ':',
    color = 'k')
ax.tick_params(axis = 'both', rotation = 45, labelsize = 20)
ax.set_xlabel('Date, Hour', fontsize = 24)
fig.tight_layout()
fig.savefig('coupledaysavergedByMin.png', format = 'png', dpi = 300)
With all this work, maybe this is not a good avenue for me to go down as the current data doesn’t give enough context to know it was during rest or moving around.
7.) Resting Heart Rate
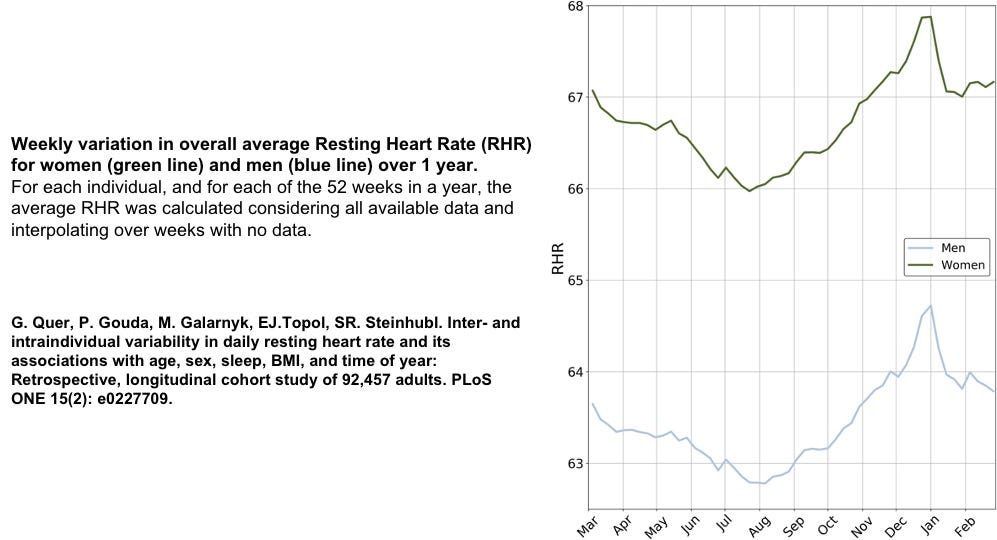
There are studies that talk about how resting heart rate can reflect your current and future health. There was actually a research paper that showed the Inter- and intraindividual variability in daily resting heart rate and its associations with age, sex, sleep, BMI, and time of year for 92,447 adults who wore a Fitbit consistently. Below is an image from the paper (with text added for clarity).
The api call we have been using also returns resting heart rate so the code below isn’t too different than earlier steps.
# startTime is first date of data that I want.
# You will need to modify for the date you want your data to start
startTime = pd.datetime(year = 2019, month = 11, day = 21)
endTime = pd.datetime.today().date() - datetime.timedelta(days=1)date_list = []
resting_list = []allDates = pd.date_range(start=startTime, end = endTime)for oneDate in allDates:

    oneDate = oneDate.date().strftime("%Y-%m-%d")

    oneDayData = auth2_client.intraday_time_series('activities/heart', base_date=oneDate, detail_level='1sec')

    date_list.append(oneDate)

    resting_list.append(oneDayData['activities-heart'][0]['value']['restingHeartRate'])# there is more matplotlib code on GitHub
fig, ax = plt.subplots(figsize=(10, 7))ax.plot(date_list, resting_list)
Try and graph your data.
8.) Get Sleep Data
Without going into too much detail, the code below gets sleep data per minute (final_df) and sleep summary information final_stages_df of how much overall time in minutes a Fitbit user spends in deep, light, rem, and wake stages of sleep.
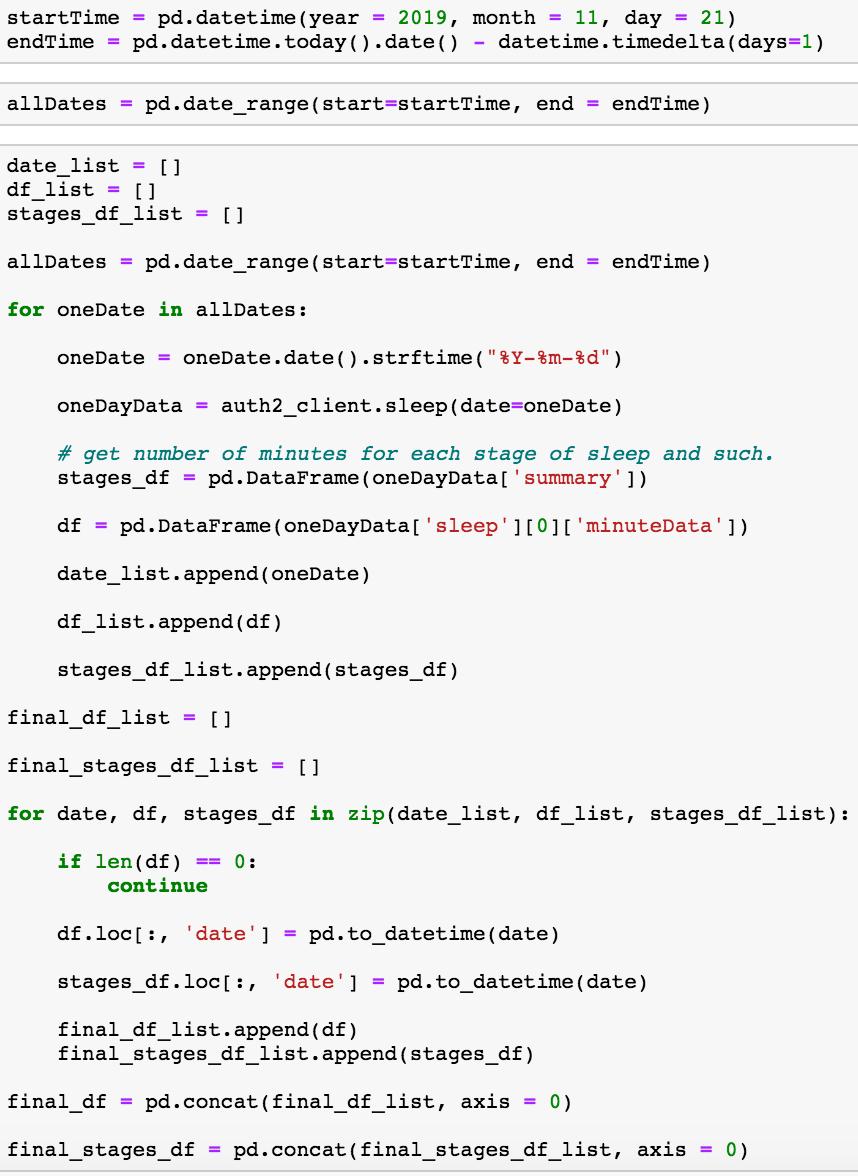
final_stages_df is a pandas DataFrame which shows how much of each stages a Fitbit user slept in a given night (wake, deep, light, rem) for a given date as well as total time in bed.

final_df is a pandas DataFrame which gives a dateTime, date, and a value. A 1 in value column is “asleep”, 2 is awake, and 3 is really awake.
Potential Errors
No module named gather_keys_oauth2
This is for the case where you get an error similar to the one below.
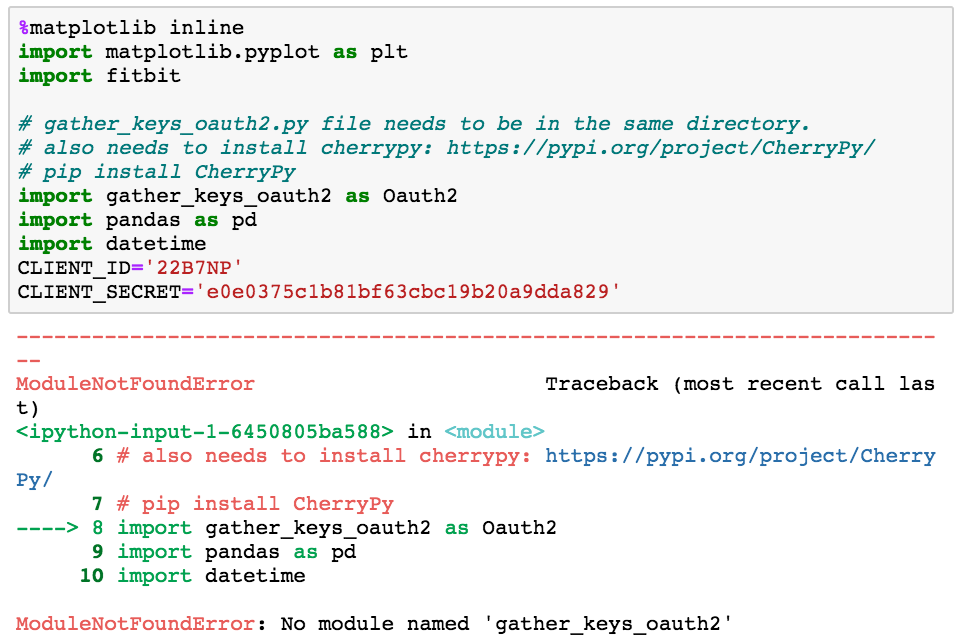
To solve this, you can put the gather_keys_oauth2.py file into the same directory where you have python file or jupyter notebook. You can see how my project directory is arranged below.
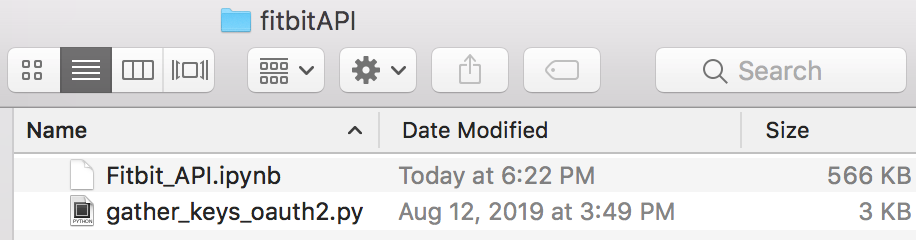
Notice that gather_keys_oauth2.py is in the same directory as my jupyter notebook. This is a file contained in python-fitbit-master we downloaded in step 3.
CherryPy Not Recognized, No module named cherrypy
If you get an error similar to the one below, first close your jupyter notebook or python file.
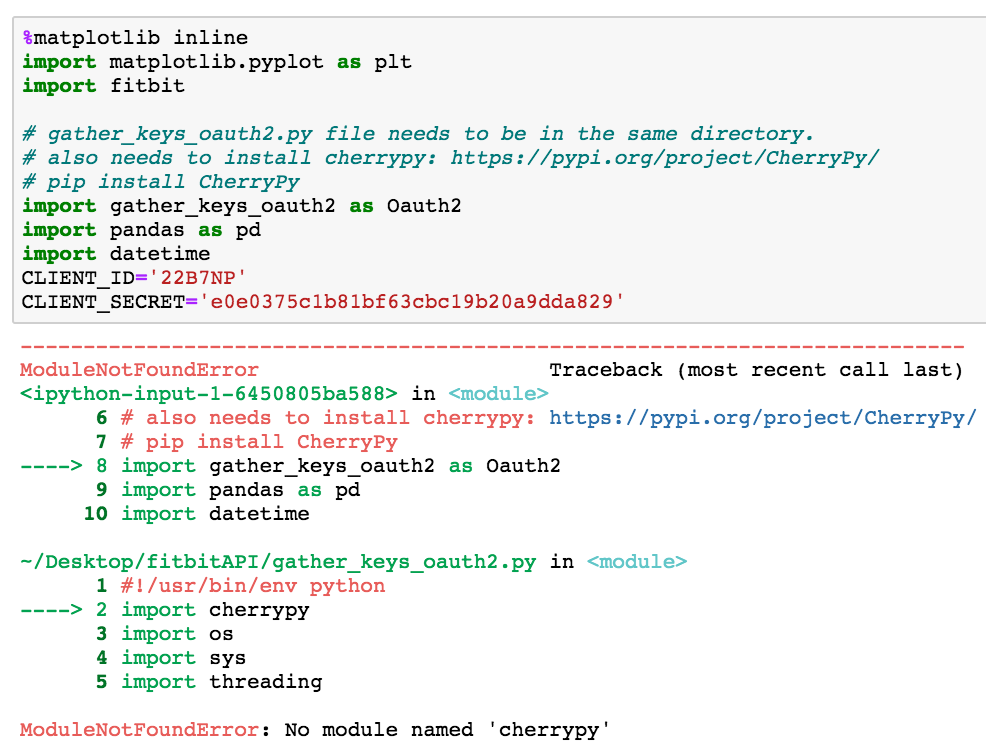
You can solve the problem by using the following command.
pip install CherryPy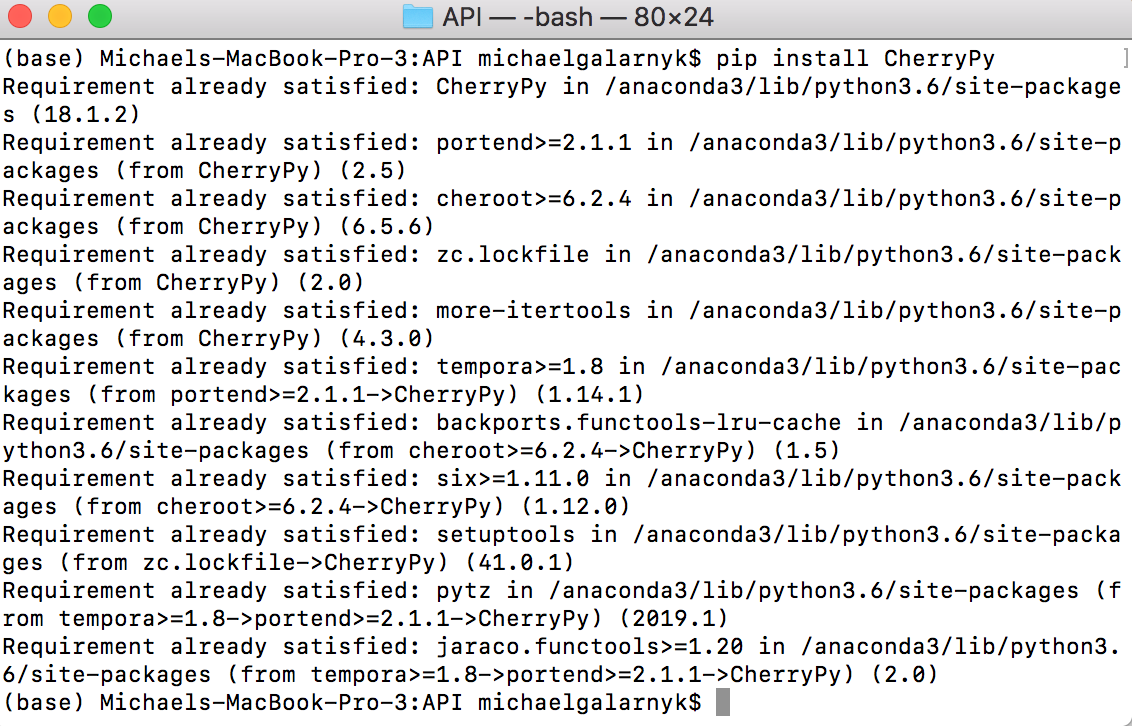
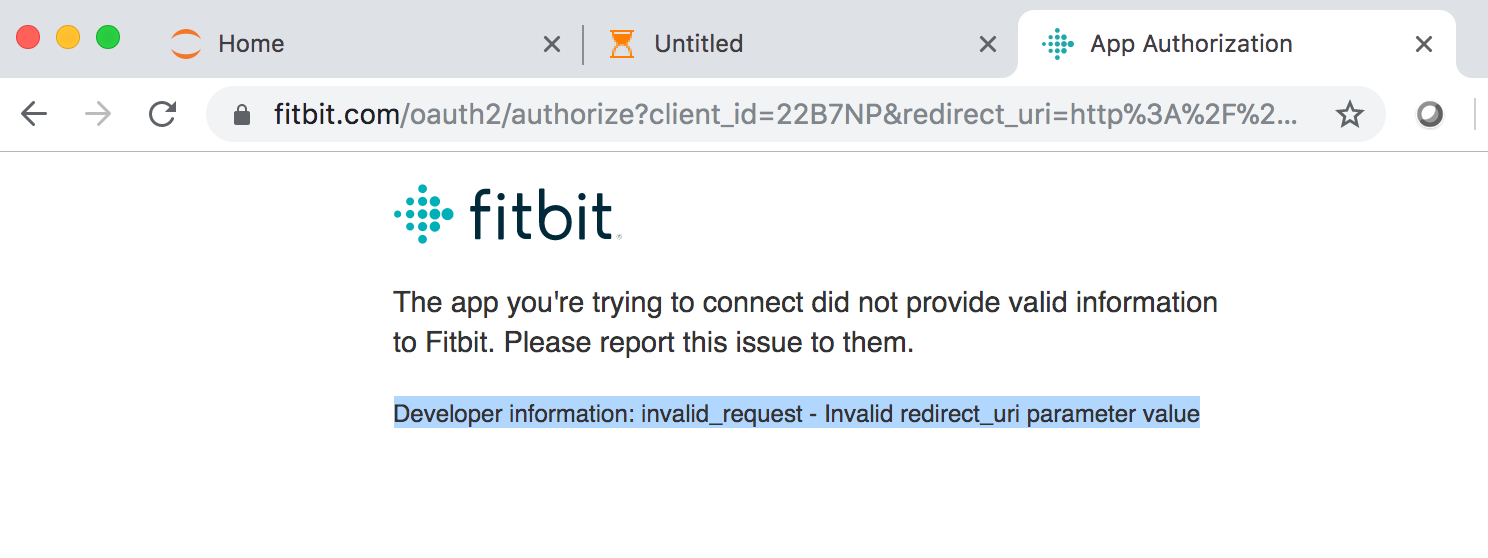
Https vs Http Error
The following error was from step 2 when I once tried to make the callback url be https instead of http.
HTTPTooManyRequests: Too Many Requests
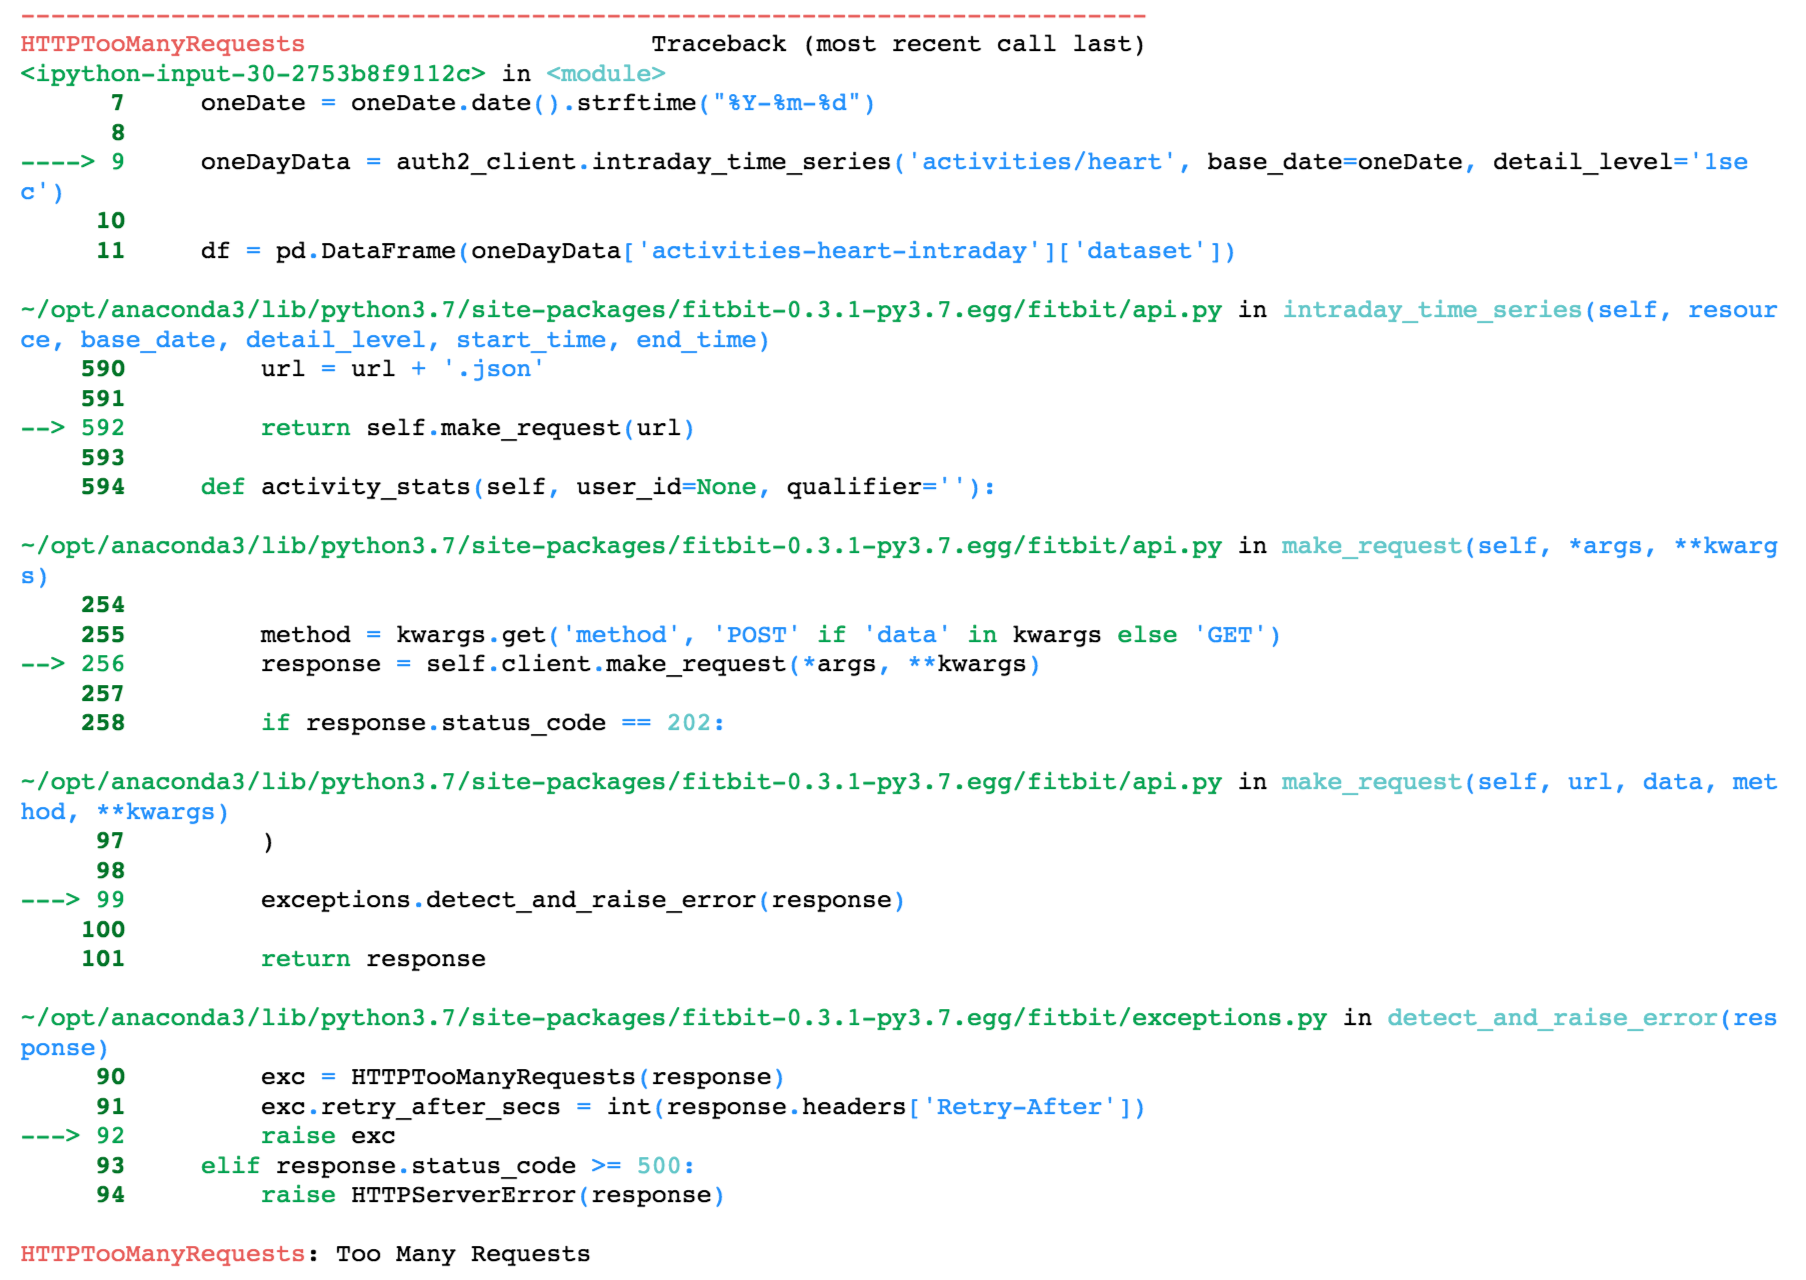
The fitbit community forum has an answer for this question. With the API, you can do up to 150 requests per user/fitbit per hour. This means that if you have over 150 days of data and you use the code from step 5b in this tutorial, you might need to wait a bit to get the rest of your data.
Concluding Remarks
This post went over how to get data from an individual Fitbit. While I covered quite a bit, there are still things I didn’t cover over like how the Fitbit api can get your step counts. The Fitbit API is something I am still learning so if you have contributions, please let me know. If you have any questions or thoughts on the tutorial, feel free to reach out in the comments below or through Twitter.
Bio: Michael Galarnyk is a Data Scientist and Corporate Trainer. He currently works at Scripps Translational Research Institute. You can find him on Twitter (https://twitter.com/GalarnykMichael), Medium (https://medium.com/@GalarnykMichael), and GitHub (https://github.com/mGalarnyk).
Original. Reposted with permission.
Related:
- Understanding Decision Trees for Classification in Python
- Python Lists and List Manipulation
- Python Tuples and Tuple Methods