Machine Learning Experiment Tracking
Why is experiment tracking so important for doing real world machine learning?
By Lukas Biewald, Founder/CEO of Weights and Biases.
At first glance, building and deploying machine learning models looks a lot like writing code. But there are some key differences that make machine learning harder:
- Machine Learning projects have far more branching and experimentation than a typical software project.
- Machine Learning code generally doesn’t throw errors, it just underperforms, making debugging extra difficult and time consuming.
- A single small change in training data, training code or hyperparameters can wildly change a model’s performance, so reproducing earlier work often requires exactly matching the prior setup.
- Running machine learning experiments can be time consuming and just the compute costs can get expensive.
Tracking experiments in an organized way helps with all of these core issues. Weights and Biases (wandb) is a simple tool that helps individuals to track their experiments — I talked to several machine learning leaders of different size teams about how they use wandb to track their experiments.
Getting started with experiment tracking with wandb
The essential unit of progress in an ML project is an experiment, so most people track what they’re doing somehow — generally I see practitioners start with a spreadsheet or a text file to keep track of what they’re doing.
Spreadsheets and docs are incredibly flexible — what’s wrong with this approach?
Here is a Google doc I was using for a project a few years ago:
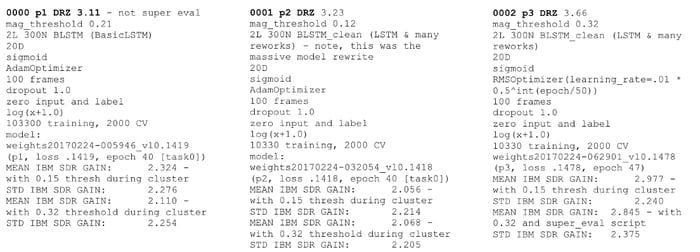
I’m sure these notes were important at the time, but now I have no idea what these notes mean.
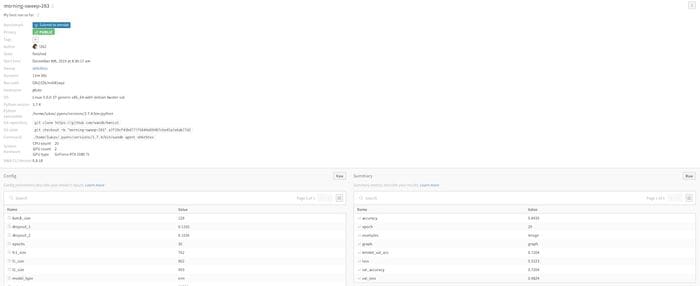
Weights and Biases makes it very simple to automatically record all of the hyperparameters (inputs) and metrics (outputs).
This is how you would setup wandb in pytorch (you can find other common ML frameworks in the documentation).
import wandbwandb.init(config=args) # track hyperparameters
wandb.watch(model) # track model metricsmodel.train()
for batch_idx, (data, target) in enumerate(train_loader):
  output = model(data)
  loss = F.nll_loss(output, target)
  loss.backward()
  optimizer.step()  wandb.log({“loss”: loss}) # track a specific metric
Once set up, Weights and Biases monitors a lot of things by default. Any command line argument becomes a saved hyperparameter. Any value made available by pytorch becomes a metric. The experiment can automatically be linked to the latest git commit or the exact state of the training code. Collecting information passively is really important because it’s nearly impossible to consistently write down all the things you might care about.
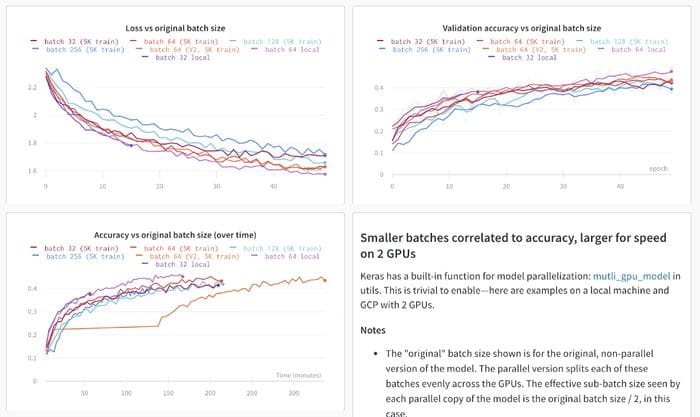
It’s also extremely important to write down qualitative notes about the models you build for later. In Weights and Biases, you can create reports to track notes alongside model metrics, and to share your findings and progress with your team.
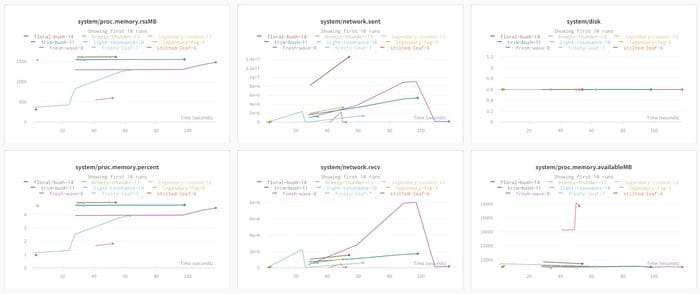
Collecting system metrics in the background is a good example. Wandb collects system usage metrics in the background — things like GPU Memory Allocated, Network Traffic and Disk Usage. Most of the time you don’t need to look at all of this information, but it’s easy to make a change where you are no longer using most of your GPUs memory and hard to track down when you made that change. If you instrument your training code with wandb once, you will be able to look back at all of your experiments and see where the usage changed.
Using experiment tracking to compare results across experiments
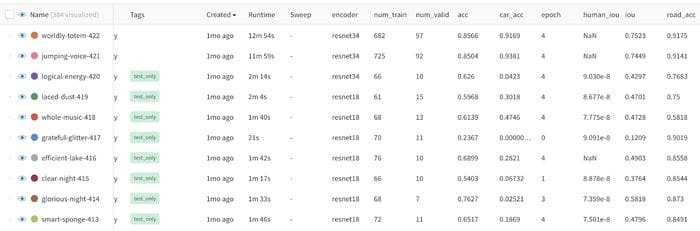
A typical ML workflow involves running lots of experiments. We’ve found that looking at results in the context of other results is much more meaningful than looking at a single experiment alone.
Looking across lots of experiments at once gets messy quickly. There are lots of inputs changing and lots of different possible outputs. Some runs inevitably fail early.
Different experimentation styles lead to different workflows, but we’ve found that logging every metric that you might care about and tagging experiments with a few consistent tags meaningful to you can keep things much more organized later.
Once you have a number of models logged, you have way more dimensions to examine than can be looked at all at once. One powerful visualization tool we’ve discovered is the parallel coordinates chart.
Here each line is an individual experiment and each column is an input hyperparameter or an output metric. I’ve highlighted the top accuracy runs and it shows quite clearly that across all of my experiments that I’ve selected, high accuracy comes from low dropout values.
Looking across experiments is so important that wandb lets you build workspaces where you can select groups of graphs in visualizations like a scatterplot and then immediately view comparisons of the selected runs
Viewing specific examples
Aggregate metrics are good, but it is essential to look at specific examples. The function wandb.log() can handle all kinds of datatypes and automatically visualizes them.

Logging Images
Logging images is important for many applications and it’s possible to see images across multiple runs. Here are different approaches to building a GAN and the results at various scales and timesteps.

Logging Matplotlib Plots
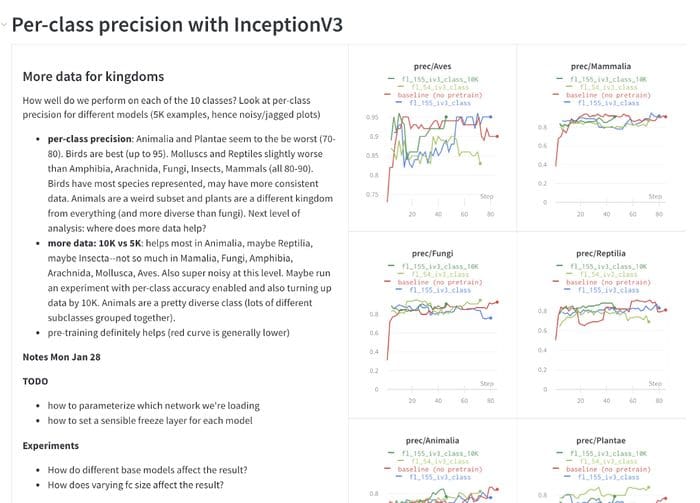
Often code already tracks things in matplotlib — if you log the chart it will be saved forever and easy to pull back up. In fact you can log a unique chart for every step of your training code.

Using experiment tracking to manage distributed training
When doing distributed training, even just visualizing results can get even harder.
In a distributed run over many machines, every instance can call wandb init and set group and job_type like this:
wandb.init(group=”first-run”, job_type=”train”)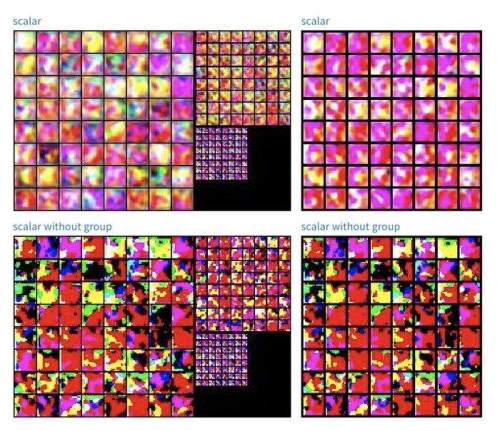
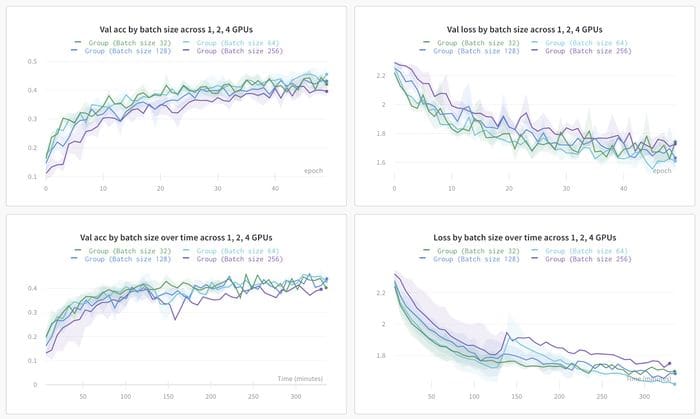
Wandb will show the metrics for all of the runs in the group aggregated together, but it’s also possible to go in and look at the individual process and see how well they perform.
Using experiment tracking reports to manage team collaboration
As teams grow, tracking everything becomes more and more important. Wandb lets you build static reports that show exactly the experiments you’ve run with aggregate statistics and the ability to dig deeper.
On the OpenAI robotics team, wandb reports are the place where ML practitioners record the work they’ve done and share it with their colleagues. It is crucial for visualizing when a change may have inadvertently hurt progress.
At Latent Space, every team project meeting starts with a review of the latest wandb experiment report and a discussion around how well the current approach is working and what experiments should be tried next.

Using experiment tracking as system of record for models
As teams grow and models become are deployed into production it becomes more and more important to have a record of everything that happened. At Toyota Research, the wandb experiment link is used as the official record of every ML model that gets built. If something happens downstream of a model build, they can trace the issue back to the wandb training run. Building a report from a set of experiments means there is a permanent record of the work done and teams can easily go back and review exactly what happened.
Bio: Lukas Biewald is the founder of Weights & Biases, and previously, the founder of Figure Eight (formerly CrowdFlower).
Original. Reposted with permission.
Related:
- Why are Machine Learning Projects so Hard to Manage?
- Interactive Machine Learning Experiments
- Model Evaluation Metrics in Machine Learning