What is Simpson’s Paradox and How to Automatically Detect it
Looking at data one way can tell one story, but sometimes looking at it another way will tell the opposite story. Understanding this paradox and why it happens is essential, and new tools are available to help automatically detect this tricky issue in your datasets.
By Eric Hart, Ph.D. and Mariam Walaa, Altair.
When we want to study relationships in data, we can plot, cross-tabulate, or model that data. When we do this, we might come across cases where the relationships we see from two different views of a single dataset lead us to opposing conclusions. These are cases of Simpson’s Paradox.
Finding these cases can help us understand our data better and discover interesting relationships. This article gives some examples of where these cases happen, discusses how and why they happen, and suggests ways to automatically detect these situations in your own data.
What is Simpson’s Paradox?
Simpson’s Paradox refers to a situation where you believe you understand the direction of a relationship between two variables, but when you consider an additional variable, that direction appears to reverse.
Why does Simpson’s Paradox happen?
Simpson’s Paradox happens because disaggregation of the data (e.g., splitting it into subgroups) can cause certain subgroups to have an imbalanced representation compared to other subgroups. This might be due to the relationship between the variables, or simply due to the way that the data has been partitioned into subgroups.
Example #1: Admissions
A famous example of Simpson’s Paradox appears in the admissions data for graduate school at UC Berkeley in 1973 [source]. In this example, when looking at the graduate admissions data overall, it appeared that men were more likely to be admitted than women (gender discrimination!), but when looking at the data for each department individually, men were less likely to be admitted than women in most of the departments.
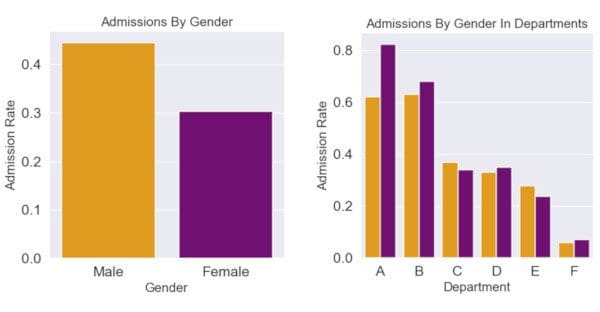
Here is an explanation of why this happens:
- Different departments had very different acceptance rates (some were much “harder” to get into than others)
- More females applied to the “harder" departments
- Therefore, females had a lower acceptance rate in aggregate
This leads us to ask: which view is the correct view? Do men or women have a higher acceptance rate? Is there a gender bias in admissions at this university?
In this case, it seems most reasonable to conclude that looking at the admissions rates by department makes more sense, and the disaggregated view is correct.
Example #2: Baseball
Another example of Simpson’s Paradox can be found in the batting averages of two famous baseball players, Derek Jeter and David Justice, from 1995 and 1996 [source]. David Justice had a higher batting average in both 1995 and 1996 individually, but Derek Jeter had a higher batting average over the two years combined.
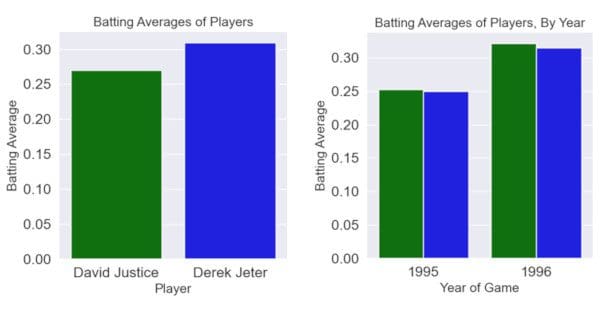
Here is an explanation of why this happens:
- Both players had significantly higher batting averages in 1996 than in 1995
- Derek Jeter had significantly more at-bats in 1996; David Justice had significantly more in 1995
- Therefore, Derek Jeter had a higher batting average in aggregate

Figure 1: Knowledge Studio Decision Tree displaying the imbalanced number of at-bats by each player in 1995 and 1996.
Again, we can ask: which view is the correct view? Was Derek Jeter or David Justice the better hitter? In this case, it seems most reasonable to conclude that the aggregated view is the correct view, and Derek Jeter was the better hitter over the two years.
With these two examples, it’s clear why Simpson’s Paradox can be an issue. It’s hard to draw conclusions from data when the data tells us two opposing stories at the same time. One might be tempted to think that the disaggregated view is always better since it contains more information, but it’s possible that disaggregating on an additional variable provides an unnecessary or confusing perspective.
As we see in the examples above, both cases are possible: sometimes the aggregated view is correct, and sometimes the disaggregated view is correct.
What to do about Simpson’s Paradox
Without enough domain knowledge, it’s hard to know which view of the relationship between two variables makes more sense – the one with or without the third variable.
But before we think about how to deal with Simpson’s Paradox, we need to find a way to efficiently detect it in a dataset. As mentioned earlier, it’s possible to find an instance of Simpson’s Paradox (a “Simpson’s Pair”) simply by disaggregating a contingency table or a plot of data points and studying the results. However, there are other ways we can find Simpson’s Pairs using models, e.g.:
- By building decision trees and comparing the distributions, or
- By building regression models and comparing the signs of the coefficients
There are benefits to both, however, this can get difficult very quickly, especially when working with big datasets. It’s hard to know which variables in the dataset may reverse the relationship between two other variables, and it can be hard to check all possible pairs of variables manually. Imagine we have a dataset with only 20 variables: we’d need to check almost 400 pairs to be sure to find all cases of Simpson’s Paradox.
There are also further challenges to consider, even if we have searched for (and found) all possible Simpson's Pairs. These challenges relate to interpretation, for example:
- Does the trend need to reverse in every subgroup to consider something a Simpson’s Pair? Or is a majority of the subgroups enough?
- Does the size of the subgroups matter? What if the trend reverses in a lot of small subgroups, but not the largest subgroup?
These last challenges don’t disappear when attempting to automatically detect Simpson’s Paradox, but by being forced to make decisions up front, we can at least handle them in a systematic and consistent way.
Existing Tools for Automatically Detecting Simpson’s Paradox
Luckily, some tools have already been developed to deal with Simpson’s Paradox in datasets:
- An R package, Simpsons, can detect Simpson’s Paradox for continuous data by having the user specify the independent variable, dependent variable, and the variable they would like to disaggregate their data with. However, this only works on continuous data and doesn’t check for Simpson’s Paradox in the whole dataset (e.g., you must know where to look in advance, which can be the hard part).
- The paper, Can you Trust the Trend: Discovering Simpson's Paradoxes in Social Data, discusses an algorithm to identify “Simpson’s Pairs,” and the authors helpfully include code on GitHub. This code only works for datasets with binary dependent variables.
How We Automatically Detect Simpson’s Paradox
We wrote our own function to automatically find Simpson’s pairs in a dataset. There are two versions: one using Decision Trees (which can currently only be used inside of Altair’s Knowledge Studio software), and one using Regression models, which works in Python and is available for download.
Conclusion
Simpson's Paradox is a tricky issue, but a good analyst or data scientist can handle it with the right tools and knowledge. We hope our new work can help others deal with this issue in an easier and more efficient manner.
Bio: Dr. Eric Hart is a Senior Data Scientist on the services team at Altair, and Mariam Walaa is an intern on the services team at Altair and an undergraduate student at the University of Toronto. This blog post was written as part of a summer research project at Altair.
Related: