 Learn to build an end to end data science project
 Learn to build an end to end data science project
Appreciating the process you must work through for any Data Science project is valuable before you land your first job in this field. With a well-honed strategy, such as the one outlined in this example project, you will remain productive and consistently deliver valuable machine learning models.
By Mathang Peddi, Data Science and Machine Learning Enthusiast.
A Data Scientist is the one who is the best programmer among all the statisticians and the best statistician among all the programmers.
Every Data Scientist needs an efficient strategy to solve data science problems.
Data Science positions are unique across the country so we can try and predict the salary of data science positions based on Job Title, Company, and Geography, etc. Here I have built a project where any user can plug in the information, and it splits up into a range of salaries, so if anyone is trying to negotiate, then this is a pretty cool tool for them to use.
Data Science Workflow
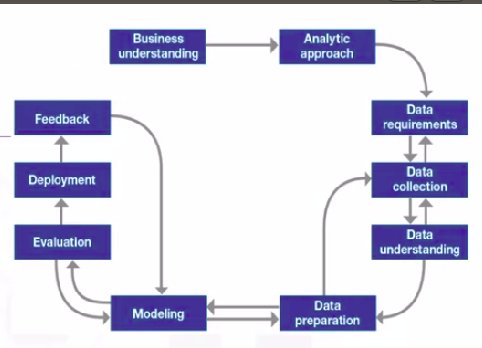
Business Understanding
This stage is significant because it helps clarify the customer’s target. The success of any project depends on the quality of the questions asked. If you understand the business requirement correctly, then it helps you collect the right data. Asking the right questions will help you narrow down the data acquisition part.
Analytic Approach
This is the stage where, once the business problem has been clearly stated, the data scientist can define the analytic approach to solve the problem. This step includes explaining the problem in the sense of statistical and machine-learning techniques, and it is important as it helps to determine what kind of trends are required to solve the issue in the most efficient way possible. If the issue is to determine the probabilities of something, then a predictive model might be used; if the question is to show relationships, a descriptive approach may be required, and if our problem requires counts, then statistical analysis is the best way to solve it. For each type of approach, we can use different algorithms.
Data Requirements
We find out the necessary data content, formats, and sources for initial data collection, and we use this data inside the algorithm of the approach we chose.
Data reveals impact, and with data, you can bring more science to your decisions.
Data Collection
We identify the available data resources relevant to the problem domain. To retrieve the data, we can apply web scraping on a related website, or we can use a repository with premade datasets that are ready to use. If you want to collect data from any website or repository, use the Pandas library, which is a very useful tool to download, convert, and modify datasets.
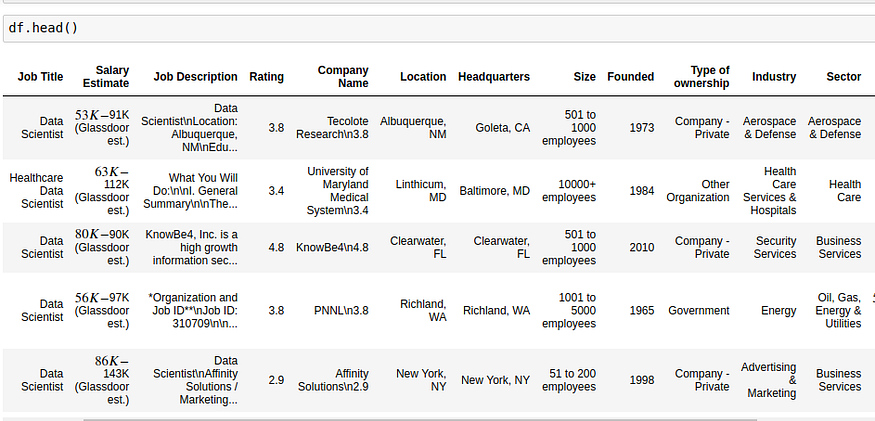
So for this purpose, I have tweaked the web scraper to scrape 1000 job postings from glassdoor.com. With each job, we get the following: Job title, Salary Estimate, Job Description, Rating, Company, Location, Company Headquarters, Company Size, Company Founded Date, Type of Ownership, Industry, Sector, Revenue, Competitors. So these are the various attributes for determining the salary of a person working in the Data Science field.
To check the Web Scraper Article, click here.
To check the Web Scraper Github code, click here.
You can have data without information, but you cannot have information without data.
Data Understanding
Data scientists try to understand more about the data collected before. We have to check the type of each data and have to learn more about the attributes and their names.
Few salaries contain -1, so those values are not of much importance to us so let’s remove them. As the salary estimate column is in a string right now, so we need to give -1 in the string format.
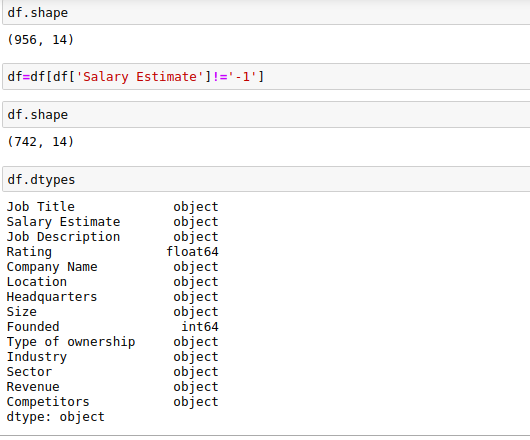
So now we can see that the number of rows has come down to 742. We observe that most of our variables are categorical and not numerical. This dataset comprises 2 numerical and 12 categorical variables. But in reality, our dependent variable, Salary Estimate, has to be numerical. So we need to convert that into a numerical variable.
Data Preparation
Data can be in any format. To analyze it, you need to have data in a certain format. Data scientists have to prepare data for modeling, which is one of the most crucial steps because the model has to be clean and should not contain any errors or null values.
In real-world scenarios, data scientists spend 80% of their time cleaning the data and only spend 20% of their time giving insights and conclusions.
This is a pretty messy process, so that’s something you should be prepared for.
After scraping the data, I needed to clean it up so that it was usable for our model. I made a few changes and created new variables.
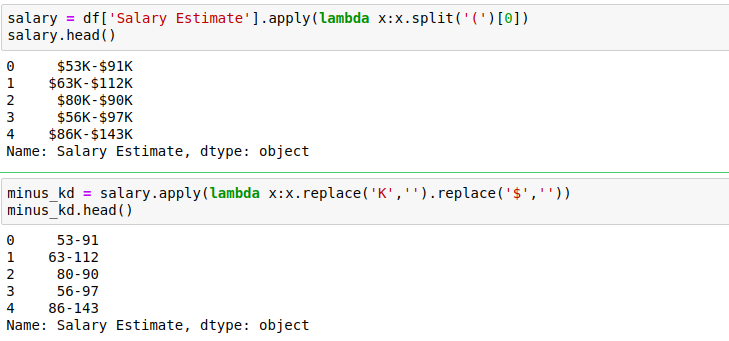
When we split on the left parenthesis, what happens is, the left and right sides of ‘(‘ of all the rows go into 2 different lists. That’s why we need to include [0] to get the salaries. After obtaining the salaries, replace ‘K’,’$’ with an empty string. In a few entries, the salary is given as ‘employer provided’ and ‘per hour’, so these are inconsistent and should be looked after.
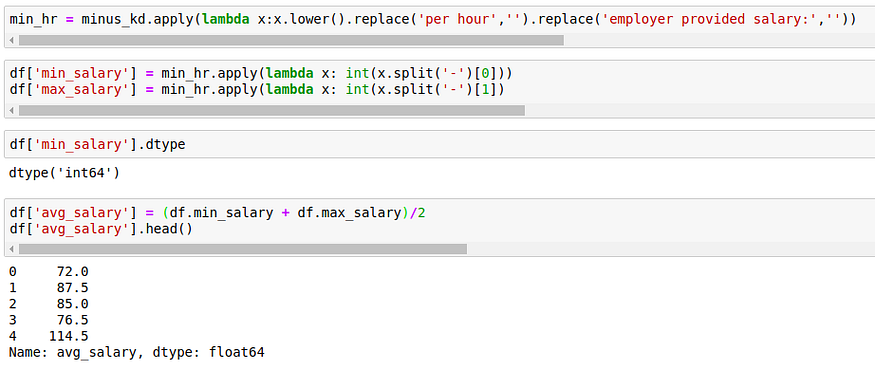
Now we shouldn’t have employer provided or per hour in salaries. So we return 2 lists which contain the minimum and maximum salaries of each entry. This becomes our final dependent variable(to predict the average salary of a person)
Exploratory Data Analysis
EDA plays a very important role at this stage as the summarization of clean data helps in identifying the structure, outliers, anomalies, and patterns in data. These insights could help us in building the model. However, I am going to discuss EDA in detail in a separate article, and you can find it in my medium profile.
Model Building
The data scientist has the chance to understand if his work is ready to go or if it needs review. Modeling focuses on developing models that are either descriptive or predictive. So here, we perform Predictive modeling, which is a process that uses data mining and probability to forecast outcomes. For predictive modeling, data scientists use a training set that is a set of historical data in which the outcomes are already known. This step can be repeated more times until the model understands the question and answer to it.
If we have categorical data, then we need to create dummy variables, so that's why I transformed the categorical variables into dummy variables. I also split the data into train and test sets with a test size of 20%. I tried three different models and evaluated them using Mean Absolute Error. I chose MAE because it is relatively easy to interpret, and outliers aren’t particularly bad for this type of model.
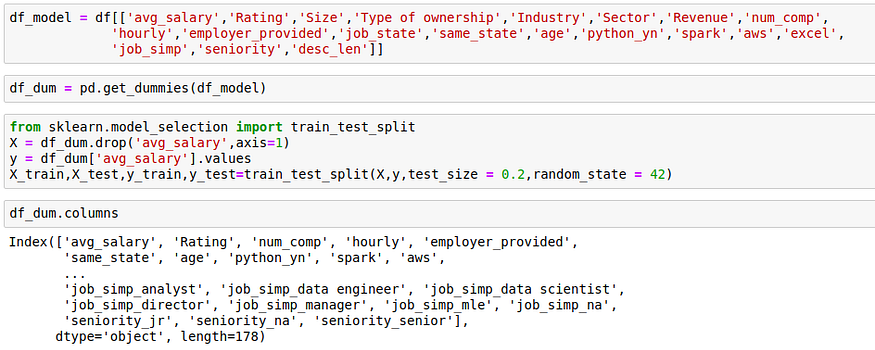
After this conversion, the number of columns in our dataset has increased from 14 to 178!!
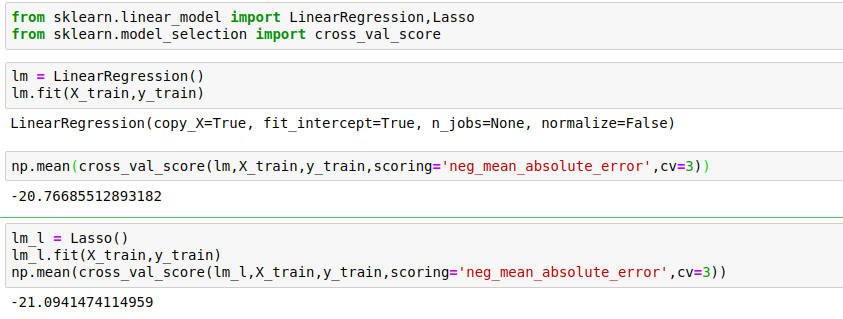
I have implemented three different models:
- Multiple Linear Regression — Baseline for the model
- Lasso Regression — Because of the sparse data from the many categorical variables, I thought a normalized regression like lasso would be effective.
- Random Forest — Again, with the sparsity associated with the data, I thought this would be a good fit.
Now when it starts, it’s a little worse. So we try to find the optimal value of alpha for which the error is the least.
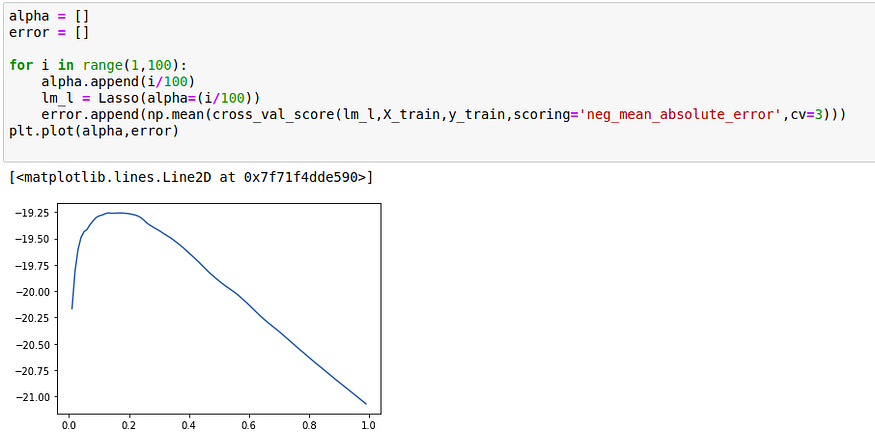
Here I have chosen i/10 as well, but the error was still high, so that’s why I have reduced the values of alpha.
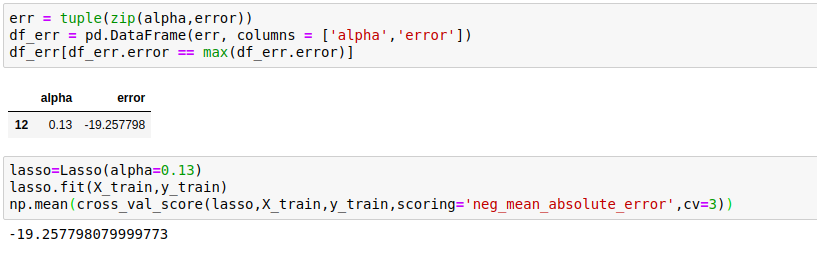
After plotting the graph and checking the value of alpha, we see that an alpha value of 0.13 gives the best error term. Now our error has reduced from 21.09 to 19.25 (which means 19.25K dollars). We can also improve the model tuning the GridSearch.
GridSearch is the process of performing hyperparameter tuning in order to determine the optimal values for a given model. GridSearchCV is basically like you put in all the parameters which you want, and then it runs all the models and splits the ones with the best results.
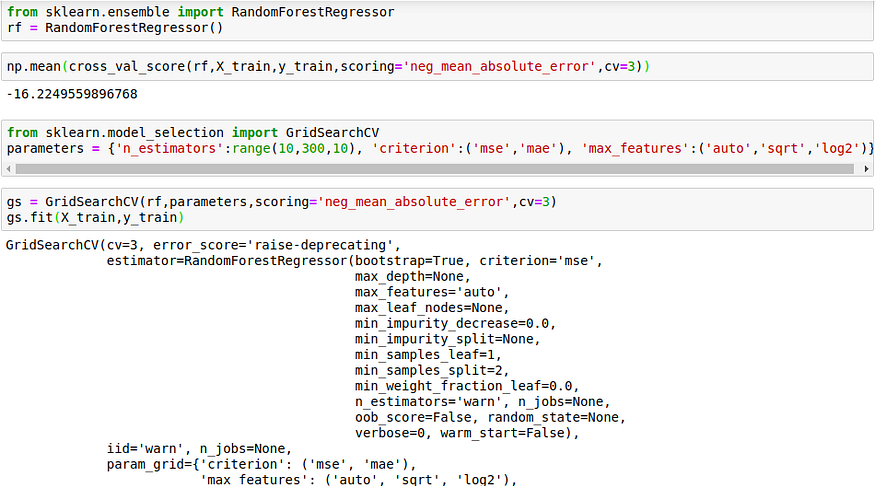
We can even use Support Vector Regression, XGBoost, or any other models.
Random Forest Regression is a tree-based decision process, and also, there are many 0s, 1s in our dataset, so we expect it to be a better model. So that’s why I have preferred Random Forest Regression here.
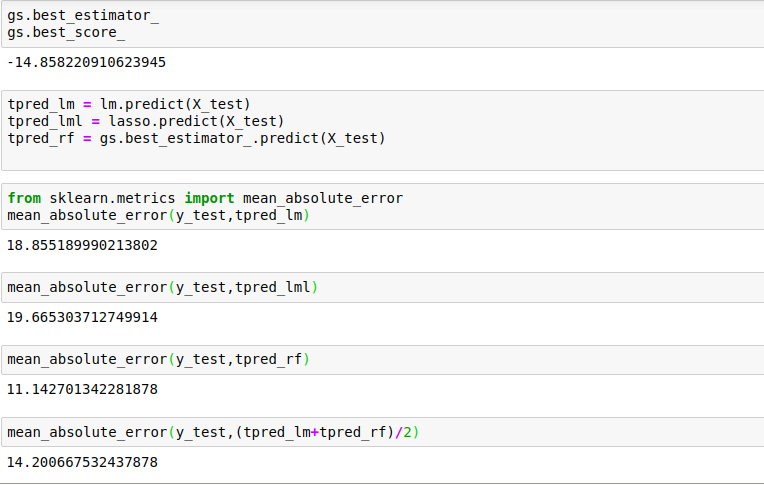
So here we are getting a smaller value of error than the previous ones, so the Random Forest model is better than the previous models. I have combined the Random Forest model with the Linear Regression model to make a prediction. So I have taken the average of both, which means that I have given 50% weightage to each of the models.
Most of the time, it’s better to combine different models and then make predictions because there are very good chances of increasing our accuracy. These types of models are called ensemble models, and they are widely used. The error may or may not increase because one model might be overtraining.
The tuned Random Forest model is the best here because it has the least error when compared to Lasso and Linear regression. So instead of taking the average of both, we can even merge 90% of the random forest model with 10% of any other models and test the accuracy/performance. Generally, these types of ensemble models are better for classification problems.
The project should not be about trying all the models, but it should be to choose the most effective models and should be able to tell a story as to why we have chosen those specific ones. Usually, Lasso regression should have more effect than linear regression as it has the normalization effect, and we have a sparse matrix, but here the Lasso performed worse than the linear regression. Hence it depends model to model, and we cannot generalize anything.
Model Evaluation
Data scientists can evaluate the model in two ways: Hold-Out and Cross-Validation. In the Hold-Out method, the dataset is divided into three subsets: a training set, a validation set that is a subset that is used to assess the performance of the model built in the training phase, and a test set is a subset to test the likely future performance of a model. In most of the cases, the training:validation:test set ratios will be 3:1:1, which means 60% of the data to the training set, 20% of the data to the validation set, and 20% of the data to the test set.
Model Deployment
So I have created a basic webpage so that it’s simple to understand. Given the details of the employee and company, this model predicts the expected salary for the employee.
I have deployed my Machine Learning model in Heroku using flask. I have trained the model using Linear regression (because it’s easy to understand), but you can always train your model using any other Machine Learning model, or you can even use ensemble models as they provide good accuracy.
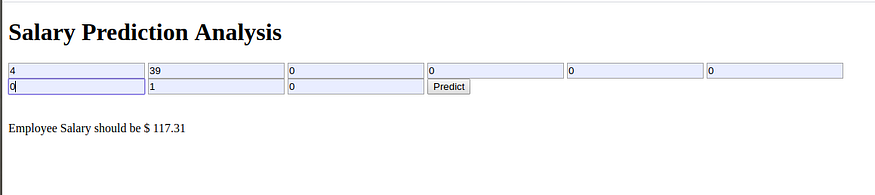
After deploying the model, I have made an attempt to predict the salary of a machine learning engineer where the company’s rating is 4, and the company was founded 39 years ago. So, according to my model, the Employee’s Expected salary is 117.31K dollars.
In this article, I have not discussed everything in detail. But you can always refer to my GitHub Repository for the whole project. My conclusion from this article is that you don’t expect a perfect model, but expect something you can use in your own company/project today!
A huge shout out to Ken Jee for his amazing contributions and projects on Data Science.
“The goal is to turn data into information, and information into insight.”–Carly Fiorina
Original. Reposted with permission.
Related: