Inside the Architecture Powering Data Quality Management at Uber
Data Quality Monitor implements novel statistical methods for anomaly detection and quality management in large data infrastructures.
I recently started a new newsletter focus on AI education and already has over 50,000 subscribers. TheSequence is a no-BS( meaning no hype, no news etc) AI-focused newsletter that takes 5 minutes to read. The goal is to keep you up to date with machine learning projects, research papers and concepts. Please give it a try by subscribing below:

Data quality management is one of those often forgotten aspects of machine learning workflows. Small inconsistencies or missing values can have a drastic negative impact on the training of machine learning models. In any medium to large organization, the proliferation of disparate data sources make their quality control a tremendous challenge. In the case of Uber, the transportation giant relies on thousands of data sources to power machine learning processes that ensure missing critical decisions. How to ensure the quality of those data sources? Recently, the Uber engineering team shared some details about their Data Quality Monitor(DQM), a solution that leverages statistical modeling to manage the quality of data sources across Uber’s infrastructure.
Despite its importance, data quality management has never experienced mainstream adoption as a segment of the enterprise software market. In the early 2000s we saw a generation of data quality management tools that try to maintain and enforce hardcoded rules that describe the state of quality of a dataset. Many of those solutions were added to popular database servers such as Oracle or Microsoft SQL Server. The adoption of the first generation of data quality stacks was relatively limited due to expected issues with the maintenance of the rules, datasets falling out of sync etc. After that, the data quality management space remained largely ignored until a few years ago a new generation of startups revisited the problem with a new core design principle: machine learning.
Instead of hardcoding rules to enforce the quality of data, wouldn’t it be possible to leverage machine learning to learn the key pattern of a dataset and infer the relevant rules? This has been the approach followed by platforms like Trifacta, Paxata, Alation and several new vendors that have been reimagining the data quality management space. These solutions provide an improvement in flexibility compared to its predecessors and have seen much higher levels of adoptions but still experience challenges when applied in large and complex environments. In the case of Uber, the diversity and complexity of its data infrastructure were such that the engineering team decided to build their own custom solution.
Uber’s Data Quality Monitor
Addressing data quality challenges at the scale of an organization like Uber requires a delicate balance. On one end a data quality management solution should effectively detect anomalies on the datasets and notify the relevant parties. However, we can imagine that the number of potential anomalies detected at any given time can overwhelm the most thorough of analysts. Factoring in those elements, Uber’s DQM needs to be able to detect relevant quality errors in a dataset but discriminate them in a way that can be effectively managed by the data source owners.
To accomplish that, DQM relies on statistical modeling to detect the most destructive anomalies in data sources and alert the relevant parties. The DQM solution combines a clever statistical methodology with a simple implementation that has been able to adapt to a complex and diverse data environment like Uber.
The Statistical Methodology
In order to detect anomalies in data sources, DQM transforms any data table into a multi-dimensional time series that can be analyzed for historical pattern detections. That transformation is done using a custom Uber service known as the Data Stats Service (DSS). Functionally, DSS queries any date-partitioned data table and generates the corresponding time series quality metrics for each column. Having a dataset represented as a multi-dimensional time series makes the quality analysis drastically simpler. However, this approach falls through when applied to massively large data sources given that the resulting time series becomes unmanageable. To address this challenge, DQM’s statistical methodology relies on three key steps:
- Time Series Simplification
- Anomaly Detection
- Data Quality Scoring
Time Series Simplification
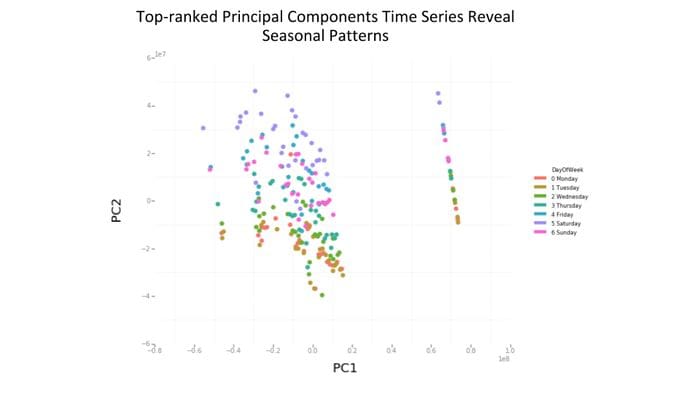
Detecting anomalies in large multi-dimensional time series is a difficult problem to solve at scale. Uber’s DQM starts by condensing the time series dataset into a representation that is easier to analyze. Specifically, DQM represents each table’s metrics as bundles based on the recording of correlated events. For instances, records related to the duration and distance of a trip are assumed to be related. After these relationships have been established, DQM performs a principal component analysis(PCA) to reduce the dimensionality of the time series and obtain a representation that is easier to process for anomaly detection.
Anomaly Detection
Having created a simpler representation of the multi-dimensional time series, the next step in the DQM process is to detect anomalies. To achieve that, DQM relies on a technique known as one-step ahead forecasting which attempts to predict the next step in a given time series. Essentially, DQM will use the prediction to determine whether the next value in the time series matches historical patterns and, otherwise, flagged it as an anomaly. Specifically, DQM forecasting is based on the Holt-Winters model which is a traditional exponentially smoothing technique that places more weight on recent records in the time series compared to previous points. This type of approach adapts well to a fast-changing and highly seasonal business like Uber.
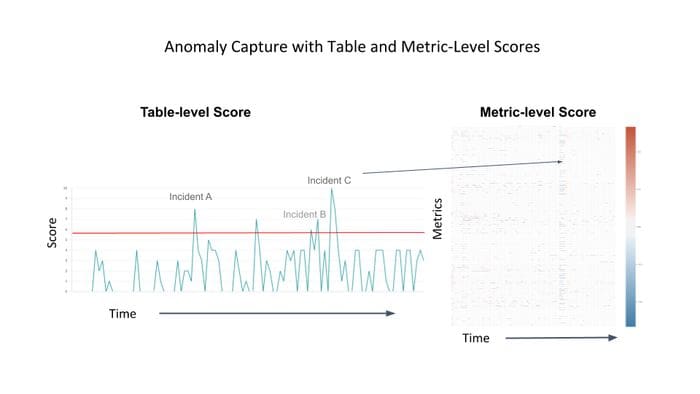
Data Quality Scoring
After the anomaly detection process completes, DQM needs to score the severity of the anomalies in order to alert the relevant parties. The scoring method is based on the distance between the forecasted values and the actual values, given different prediction interval widths. Creating a uniform scoring methodology allows creating clusters of anomalies at the metric level instead of at the table level which reduces the number of generated alerts.
Architecture and Implementation
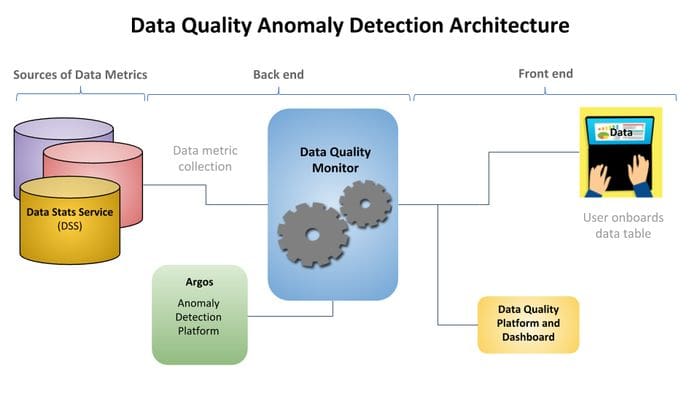
Uber’s DQM architecture leverages several custom data services at Uber. The core anomaly detection processes are implemented by Argos, Uber’s data exploration and anomaly detection tool. The anomaly metrics are surfaced through Databook, Uber’s metadata management platform. Similarly, Uber’s DSS is responsible for generating the multi-dimensional time series representation from any given dataset.
Uber’s backed components were implemented using PySpark which was responsible for data transformation and the execution of the statistical methodology for anomaly detection. The DQM frontend enables the visualization of the quality analysis and the configuration of other tasks such as alerts and monitoring jobs.
Uber’s DQM is an reference architecture to study for any organization implementing large scale data quality processes. Whether you are using commercial data quality stacks or building your own solution, the techniques applied in Uber’s DQM represent some of the most innovative best practices for data quality management in modern architectures.
Original. Reposted with permission.
Related:
- Data Observability: Building Data Quality Monitors Using SQL
- OpenAI Releases Two Transformer Models that Magically Link Language and Computer Vision
- My machine learning model does not learn. What should I do?