 3 Mathematical Laws Data Scientists Need To Know
 3 Mathematical Laws Data Scientists Need To Know
Machine learning and data science are founded on important mathematics in statistics and probability. A few interesting mathematical laws you should understand will especially help you perform better as a Data Scientist, including Benford's Law, the Law of Large Numbers, and Zipf's Law.
By Cornellius Yudha Wijaya, Data Scientist | Lecturer | Biologist | Writer | Podcaster.

Photo by Jeswin Thomas on Unsplash.
While a Data Scientist works with data as their main activity, it doesn't mean that mathematical knowledge is something we do not need. Data scientists need to learn and understand the mathematical theory behind machine learning to efficiently solving business problems.
The mathematics behind machine learning is not just a random notation thrown here and there, but it consists of many theories and thoughts. This thought creates a lot of mathematical laws that contribute to the machine learning we can use right now. Although you could use the mathematics in any way you want to solve the problem, mathematical laws are not limited to machine learning after all.
In this article, I want to outline some of the interesting mathematical laws that could help you as a Data Scientist. Let’s get into it.
Benford's Law
Benford’s law, also called the Newcomb–Benford law, the law of anomalous numbers, or the first-digit law, is a mathematical law about the leading digit number in a real-world dataset.
When we think about the first digit of the numbers, it should be distributed uniformly when we randomly took a number. Intuitively, the random number leading digit 1 should have the same probability as leading digit 9, which is ~11.1%. Surprisingly, this is not what happens.
Benford’s law states that the leading digit is likely to be small in many naturally occurring collections of numbers. A leading digit of 1 happens more often than 2, a leading digit of 2 occurs more often than 3, and so on.
Let’s try using a real-world dataset to see how this law is applicable. For this article, I use the data from Kaggle regarding Spotify Track songs from 1921–2020. From the data, I take the leading digit of the song durations.
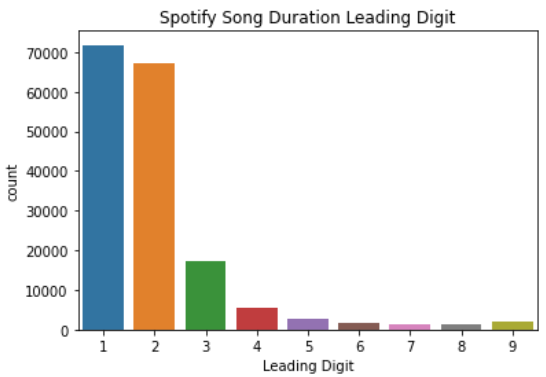
Image created by Author.
From the image above, we can see that the leading digit 1 occurs the most, then it is decreasing following the higher number. This is what Benford’s Law state above.
If we talk about the proper definition, Benford law state that a set of numbers is said to satisfy Benford’s law if the leading digit d (???? ∈ 1, …, 9) occurs with the equation,

Image created by Author.
From this equation, we acquire the leading digit with the following distribution,
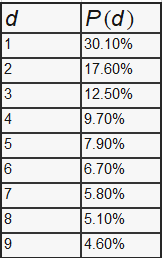
Image created by Author.
With this distribution, we can predict that 1 as the leading digit is 30% likely to occur more than the other leading digit.
Many applications for this law exist, for example, in fraud detection on tax forms, election results, economic numbers, and accounting figures.
Law of Large Numbers (LLN)
The Law of Large Numbers states that as the number of trials of a random process increases, the results' average get closer to the expected values or theoretical values.
For example, when rolling dice, the possibilities for a 6-sided die are 1, 2, 3, 4, 5, and 6. The mean for the 6-side dice would be 3.5. As we roll the die, the number we get is random from 1 to 6, but as we keep rolling the dice, the results' average get closer to the expected value, which is 3.5. This is what the Law of Large Numbers denote.
While it is useful, but the tricky part here is that you need many experiments or occurrences. However, having a large number required means that it is good for predicting long-term stability.
The Law of Large Numbers is different than the Law of Averages used to express a belief that outcomes of a random event will “even out” within a small sample. This is what we called “Gambler’s Fallacy,” where we expect the expected value occurs in a smaller sample.
Zipf's Law
Zipf’s law was created for quantitative linguistics and states that given some natural language dataset corpus, any word's frequency is inversely proportional to its frequency table rank. Thus the most frequent word occurs approximately twice as often as the second most frequent word and three times as often as the third most frequent word.
For example, in the previous Spotify dataset, I split all the words and punctuation to count them. Below is the top 12 of the most common words and their frequency.
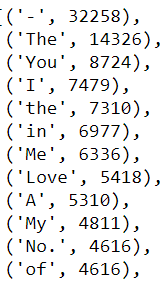
Image Created by Author.
When I sum all the words that exist in the Spotify corpus, the total is 759,389. We can see if Zipf’s law applies to this dataset by counting the probabilities when they occur. The first most occurring word or punctuation is ‘-’ with 32,258, which has the probability of ~4%, followed by ‘the,’ which has the probability of ~2%.
Faithful to the law, the probability keeps going down in some of the words. Of course, there is a little deviation, but the probability goes down most of the time following the frequency rank increase.
Original. Reposted with permission.
Related: