PyCaret 101: An introduction for beginners
This article is a great overview of how to get started with PyCaret for all your machine learning projects.
By Moez Ali, Founder & Author of PyCaret

PyCaret — An open-source, low-code machine learning library in Python
PyCaret
PyCaret is an open-source, low-code machine learning library and end-to-end model management tool built-in Python for automating machine learning workflows. Its ease of use, simplicity, and ability to quickly and efficiently build and deploy end-to-end machine learning pipelines will amaze you.
PyCaret is an alternate low-code library that can replace hundreds of lines of code with few lines only. This makes the experiment cycle exponentially fast and efficient.
PyCaret is simple and easy to use. All the operations performed in PyCaret are sequentially stored in a Pipeline that is fully automated for deployment. Whether it’s imputing missing values, one-hot-encoding, transforming categorical data, feature engineering, or even hyperparameter tuning, PyCaret automates all of it. To learn more about PyCaret, watch this 1-minute video.
PyCaret — An open-source, low-code machine learning library in Python
Features of PyCaret

Image by Author
Modules in PyCaret
PyCaret is a modular library arranged into modules and each module representing a machine learning use-case. As of the writing of this story, the following modules are supported:
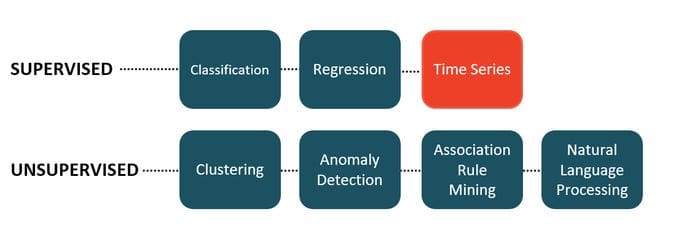
Image by Author — Machine Learning use-case supported in PyCaret
* Time Series module is in making and will be available in the next major release.
Installing PyCaret
Installing PyCaret is very easy and takes only a few minutes. We strongly recommend using a virtual environment to avoid potential conflicts with other libraries.
PyCaret’s default installation is a slim version of pycaret that only installs hard dependencies listed here.
# install slim version (default)
pip install pycaret# install the full version
pip install pycaret[full]
When you install the full version of pycaret, all the optional dependencies as listed here are also installed.
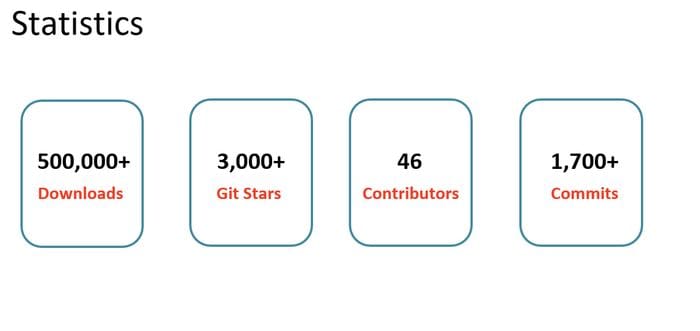
PyCaret by numbers — Image by author
???? Let’s get started
Before I show you how easy it is to do machine learning with PyCaret, let’s talk a little bit about the machine learning lifecycle at a high level:

Machine Learning Life Cycle — Image by Author (Read from left-to-right)
- Business Problem — This is the first step of the machine learning workflow. It may take from few days to a few weeks to complete, depending on the use case and complexity of the problem. It is at this stage, data scientists meet with subject matter experts (SME’s) to gain an understanding of the problem, interview key stakeholders, collect information, and set the overall expectations of the project.
- Data Sourcing & ETL — Once the problem understanding is achieved, it then comes to using the information gained during interviews to source the data from the enterprise database.
- Exploratory Data Analysis (EDA) — Modeling hasn’t started yet. EDA is where you analyze the raw data. Your goal is to explore the data and assess the quality of the data, missing values, feature distribution, correlation, etc.
- Data Preparation — Now it’s time to prepare the data model training. This includes things like dividing data into a train and test set, imputing missing values, one-hot-encoding, target encoding, feature engineering, feature selection, etc.
- Model Training & Selection — This is the step everyone is excited about. This involves training a bunch of models, tuning hyperparameters, model ensembling, evaluating performance metrics, model analysis such as AUC, Confusion Matrix, Residuals, etc, and finally selecting one best model to be deployed in production for business use.
- Deployment & Monitoring — This is the final step which is mostly about MLOps. This includes things like packaging your final model, creating a docker image, writing the scoring script, and then making it all work together, and finally publish it as an API that can be used to obtain predictions on the new data coming through the pipeline.
The old way of doing all this is pretty cumbersome, long, and requires a lot of technical know-how and I possibly cannot cover it in one tutorial. However, in this tutorial, I will use PyCaret to demonstrate how easy it has become for a data scientist to do all this very efficiently.
???? Business Problem
For this tutorial, I will be using a very popular case study by Darden School of Business, published in Harvard Business. The case is regarding the story of two people who are going to be married in the future. The guy named Greg wanted to buy a ring to propose to a girl named Sarah. The problem is to find the ring Sarah will like, but after a suggestion from his close friend, Greg decides to buy a diamond stone instead so that Sarah can decide her choice. Greg then collects data of 6000 diamonds with their price and attributes like cut, color, shape, etc.
???? Data
In this tutorial, I will be using a dataset from a very popular case study by the Darden School of Business, published in Harvard Business. The goal of this tutorial is to predict the diamond price based on its attributes like carat weight, cut, color, etc. You can download the dataset from PyCaret’s repository.
# load the dataset from pycaret
from pycaret.datasets import get_data
data = get_data('diamond')
Sample rows from data
???? Exploratory Data Analysis
Let’s do some quick visualization to assess the relationship of independent features (weight, cut, color, clarity, etc.) with the target variable i.e. Price
# plot scatter carat_weight and Price
import plotly.express as px
fig = px.scatter(x=data['Carat Weight'], y=data['Price'],
                 facet_col = data['Cut'], opacity = 0.25, template = 'plotly_dark', trendline='ols',
                 trendline_color_override = 'red', title = 'SARAH GETS A DIAMOND - A CASE STUDY')
fig.show()
Let’s check the distribution of the target variable.
# plot histogram
fig = px.histogram(data, x=["Price"], template = 'plotly_dark', title = 'Histogram of Price')
fig.show()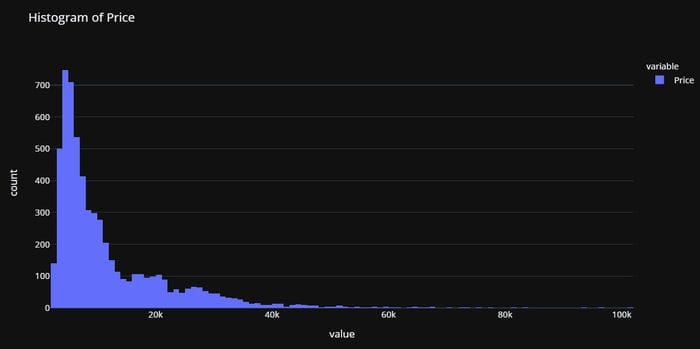
Notice that distribution of Price is right-skewed, we can quickly check to see if log transformation can make Price approximately normal to give fighting chance to algorithms that assume normality.
import numpy as np# create a copy of data
data_copy = data.copy()# create a new feature Log_Price
data_copy['Log_Price'] = np.log(data['Price'])# plot histogram
fig = px.histogram(data_copy, x=["Log_Price"], title = 'Histgram of Log Price', template = 'plotly_dark')
fig.show()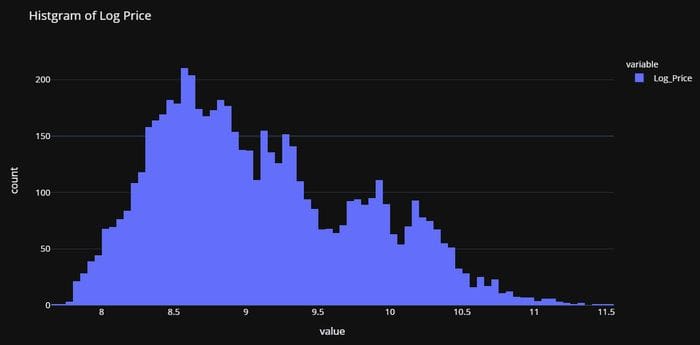
This confirms our hypothesis. The transformation will help us to get away with skewness and make the target variable approximately normal. Based on this, we will transform the Price variable before training our models.
???? Data Preparation
Common to all modules in PyCaret, the setup is the first and the only mandatory step in any machine learning experiment using PyCaret. This function takes care of all the data preparation required before training models. Besides performing some basic default processing tasks, PyCaret also offers a wide array of pre-processing features. To learn more about all the preprocessing functionalities in PyCaret, you can see this link.
# initialize setup
from pycaret.regression import *
s = setup(data, target = 'Price', transform_target = True, log_experiment = True, experiment_name = 'diamond')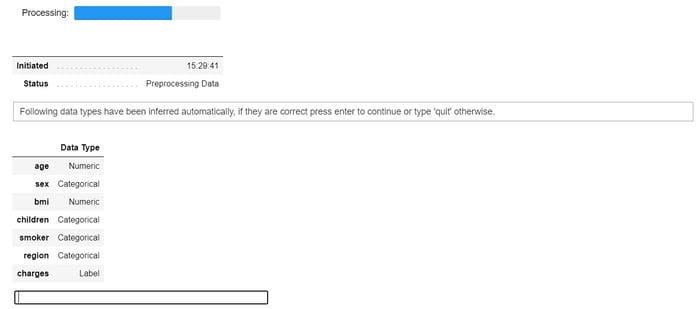
setup function in pycaret.regression module
When you initialize the setup function in PyCaret, it profiles the dataset and infers the data types for all input features. If all data types are correctly inferred, you can press enter to continue.
Notice that:
- I have passed
log_experiment = Trueandexperiment_name = 'diamond', this will tell PyCaret to automatically log all the metrics, hyperparameters, and model artifacts behind the scene as you progress through the modeling phase. This is possible due to integration with MLflow. - Also, I have used
transform_target = Trueinside thesetup. PyCaret will transform thePricevariable behind the scene using box-cox transformation. It affects the distribution of data in a similar way as log transformation (technically different). If you would like to learn more about box-cox transformations, you can refer to this link.

Output from setup — truncated for display
???? Model Training & Selection
Now that data is ready for modeling, let’s start the training process by using compare_models function. It will train all the algorithms available in the model library and evaluates multiple performance metrics using k-fold cross-validation.
# compare all models
best = compare_models()
Output from compare_models
# check the residuals of trained model
plot_model(best, plot = 'residuals_interactive')
Residuals and QQ-Plot of the best model
# check feature importance
plot_model(best, plot = 'feature')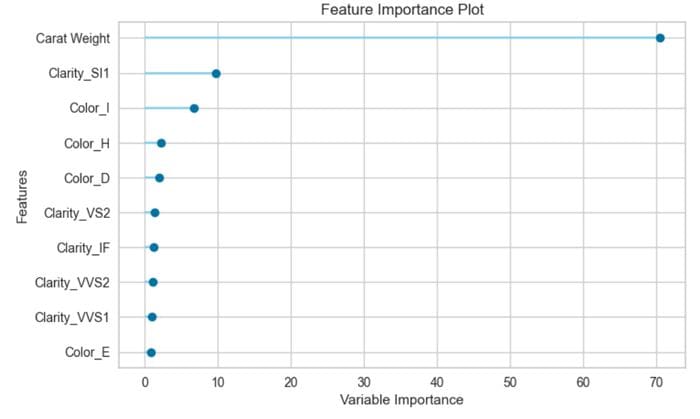
Finalize and Save Pipeline
Let’s now finalize the best model i.e. train the best model on the entire dataset including the test set and then save the pipeline as a pickle file.
# finalize the model
final_best = finalize_model(best)# save model to disk
save_model(final_best, 'diamond-pipeline')
save_model function will save the entire pipeline (including the model) as a pickle file on your local disk. By default, it will save the file in the same folder as your Notebook or script is in but you can pass the complete path as well if you would like:
save_model(final_best, 'c:/users/moez/models/diamond-pipeline'
???? Deployment
Remember we passed log_experiment = True in the setup function along with experiment_name = 'diamond' . Let’s see the magic PyCaret has done with the help of MLflow behind the scene. To see the magic let’s initiate the MLflow server:
# within notebook (notice ! sign infront)
!mlflow ui# on command line in the same folder
mlflow ui
Now open your browser and type “https://localhost:5000”. It will open a UI like this:

https://localhost:5000
Each entry in the table above represents a training run resulting in a trained Pipeline and a bunch of metadata such as DateTime of a run, performance metrics, model hyperparameters, tags, etc. Let’s click on one of the models:

Part I — CatBoost Regressor
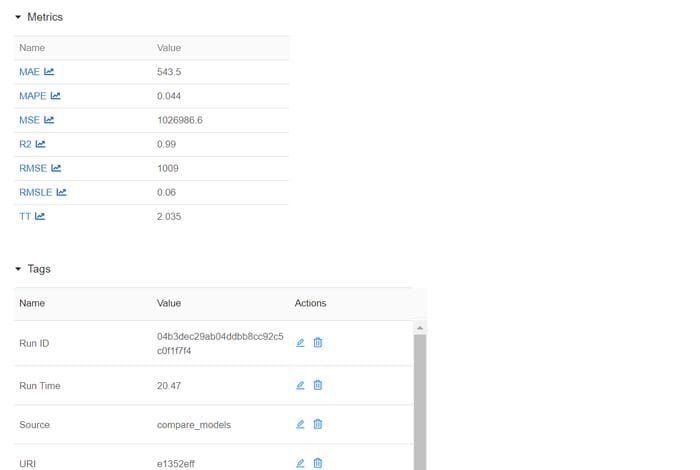
Part II — CatBoost Regressor (continued)
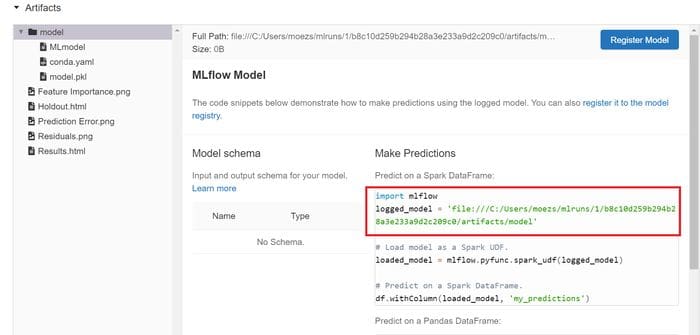
Part III — CatBoost Regressor
Notice that you have an address path for the logged_model. This is the trained Pipeline with Catboost Regressor. You can read this Pipeline using the load_model function.
# load model
from pycaret.regression import load_model
pipeline = load_model('C:/Users/moezs/mlruns/1/b8c10d259b294b28a3e233a9d2c209c0/artifacts/model/model')# print pipeline
print(pipeline)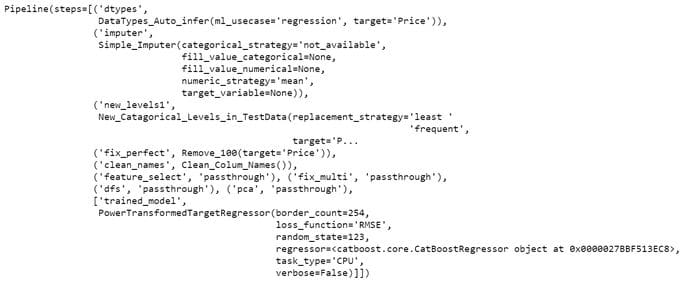
Output from print(pipeline)
Let’s now use this Pipeline to generate predictions on the new data
# create a copy of data and drop Price
data2 = data.copy()
data2.drop('Price', axis=1, inplace=True)# generate predictions
from pycaret.regression import predict_model
predictions = predict_model(pipeline, data=data2)
predictions.head()
Predictions generated from Pipeline
Woohoo! We now have inference from our trained Pipeline. Congrats, if this is your first one. Notice that all the transformations such as target transformation, one-hot-encoding, missing value imputation, etc. happened behind the scene automatically. You get a data frame with prediction in actual scale, and this is what you care about.
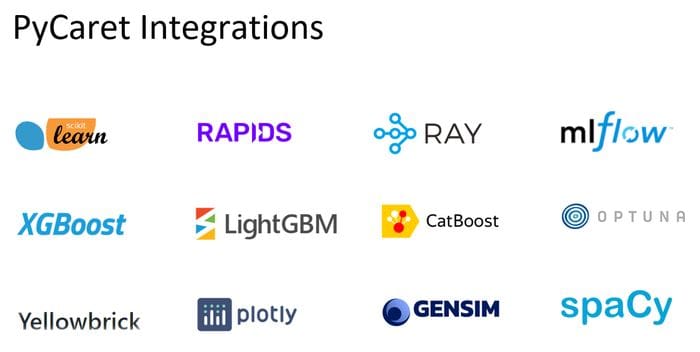
Image by Author

Image by Author
There is no limit to what you can achieve using this lightweight workflow automation library in Python. If you find this useful, please do not forget to give us ⭐️ on our GitHub repository.
To hear more about PyCaret follow us on LinkedIn and Youtube.
Join us on our slack channel. Invite link here.
You may also be interested in:
Build your own AutoML in Power BI using PyCaret 2.0
Deploy Machine Learning Pipeline on Azure using Docker
Deploy Machine Learning Pipeline on Google Kubernetes Engine
Deploy Machine Learning Pipeline on AWS Fargate
Build and deploy your first machine learning web app
Deploy PyCaret and Streamlit app using AWS Fargate serverless
Build and deploy machine learning web app using PyCaret and Streamlit
Deploy Machine Learning App built using Streamlit and PyCaret on GKE
Important Links
Documentation
Blog
GitHub
StackOverflow
Install PyCaret
Notebook Tutorials
Contribute in PyCaret
Want to learn about a specific module?
Click on the links below to see the documentation and working examples.
Classification
Regression
Clustering
Anomaly Detection
Natural Language Processing
Association Rule Mining
THE END
Bio: Moez Ali is a Data Scientist, and is Founder & Author of PyCaret.
Original. Reposted with permission.
Related:
- Easy MLOps with PyCaret + MLflow
- Write and train your own custom machine learning models using PyCaret
- 5 Things You Don’t Know About PyCaret
